

You’ve run kubectl describe pod. Your dashboard shows 40 millicores requested for the api-server container. You probably assumed your monitoring had the full picture.
The Kubernetes scheduler actually reserved 1000 millicores — a full CPU core — for it.
How could both values be true?
If you’re sizing clusters, building cost models, or tuning HPA thresholds based on per-container values, you might be working from the wrong number — in this case, 25 times smaller than what the cluster actually set aside.
The first sign is often unexpected cluster behavior: pods can’t schedule even though nodes appear to have available capacity, or workloads are evicted despite resource requests that look safe on paper.
This post explains why the discrepancy exists, when it applies, and how Dynatrace automatically surfaces the correct number — including a new Kubernetes 1.34 feature that no other monitoring platform we’re aware of has addressed yet.
The number Kubernetes doesn’t give you
When you run kubectl describe pod, you see per-container resource requests and limits. What you don’t see is the effective pod-level value — the actual CPU and memory footprint Kubernetes computes for the pod as a whole. It’s computed twice, for two different purposes: once for requests, which the scheduler uses to decide where the pod fits; once for limits, which the kubelet enforces via cgroups once the pod is running — readable from the pod cgroup on the node itself, which takes privileged host access, and even then, gives you no per-container attribution.
kubectl describe pod only shows per-container values — no pod-level total. kubectl describe node comes closer, correctly summing each pod’s effective value — though, in kubectl 1.35 and earlier, that breaks once pod-level resources are set. Either way, it’s not a field in the Kubernetes API; you’d still have to derive it yourself.
Kubernetes has never made this easy to find. You’d have to read the spec, implement the formula, and apply it to every pod. The raw specs are all there: init container limits, app container limits, pod-level resources. But Kubernetes doesn’t expose the effective pod-level value derived from applying the scheduling formula to those specs.
Monitoring tools have to compute it themselves from per-container data. Dynatrace does it at ingest, for every pod, by default — including the Kubernetes 1.34 pod-level resources case, which no other observability platform we’re aware of handles yet (see One more twist: pod-level resources below) as of this writing.
The hidden math
A Kubernetes pod can contain three kinds of containers (four, if you count ephemeral debug containers, but those don’t participate in resource accounting):
| Container type | When it runs | How it counts |
| App container | Entire pod lifetime | Added to running-phase sum |
Native sidecar (an init container with restartPolicy: Always) |
Starts during init phase, runs for entire pod lifetime | Added to running-phase sum and to the init-phase peak of any init container declared after it |
| Init container | Runs once, sequentially, before app containers start | Contributes to init-phase peak |
Because regular init containers must complete before any app container starts, they never run at the same time as your app. A pod with a 1000m init container and a 40m app container will never consume 1040m. But it will, at different points in its lifetime, need 1000m (during init) and 40m (during running).
For most pods, init containers are lightweight utilities: a readiness poller, a secret fetcher, a config renderer. The formula matters when an init container does heavier work than the app it precedes. For example, a database migration.
The formula is the same for both requests and limits. The effective value is the larger of those two phases:
effective resource = MAX(
    SUM(app containers + sidecar containers),           // running phase
    MAX(each init container + sidecars declared before it)  // init phase
)
// Scheduler uses requests (this formula). Kubelet enforces limits via cgroups (same formula).
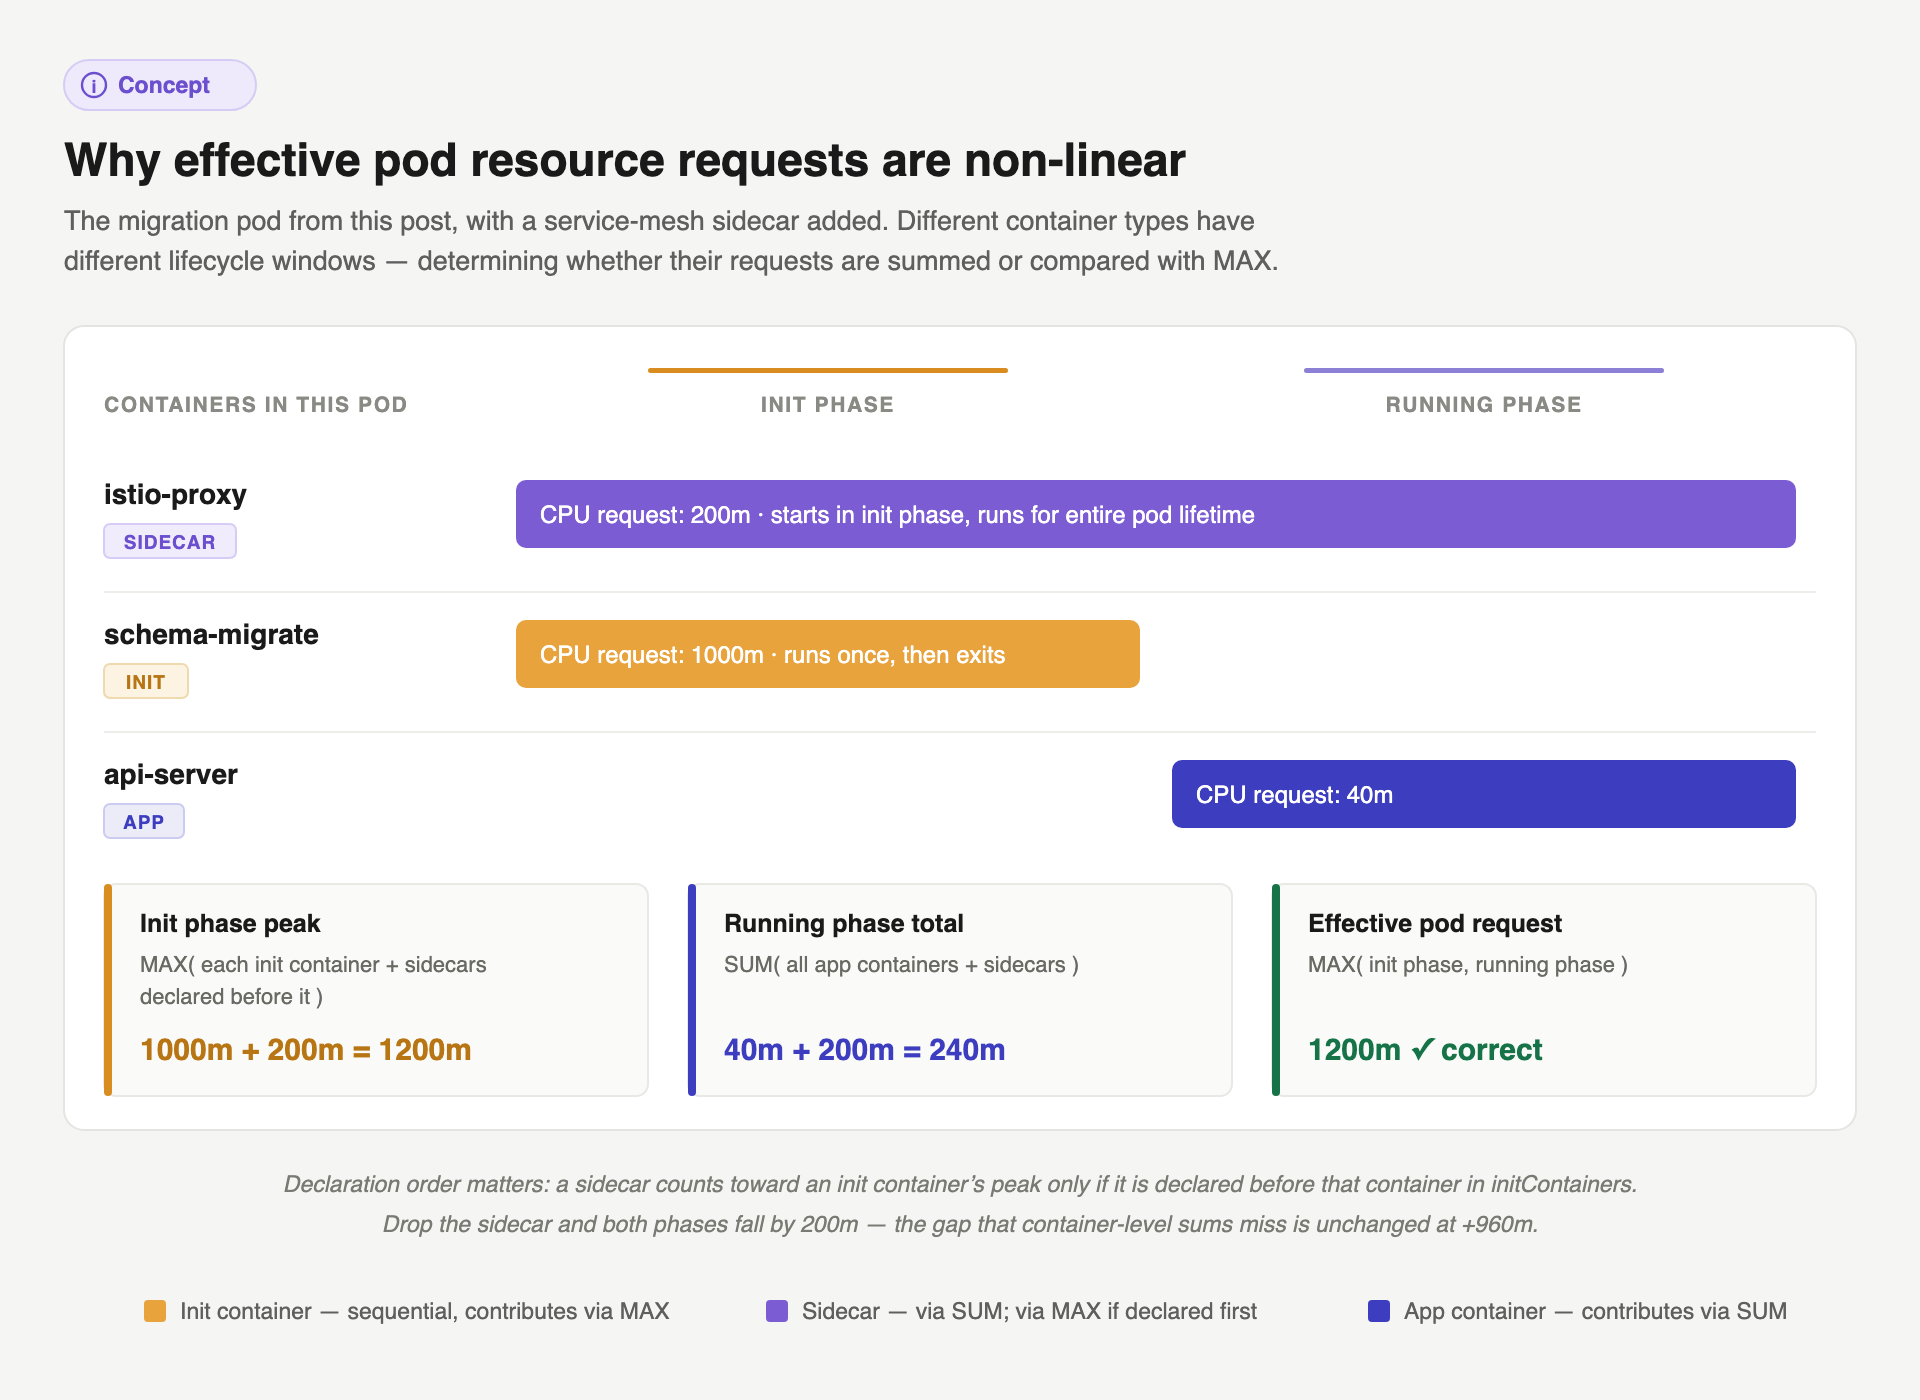
For a pod where the heaviest init container exceeds the combined running-phase total, the init container dominates, and a simple sum of all app containers can give a dramatically wrong answer.
When init dominates: the database migration pattern
Let’s take the example of database migrations. It’s a well-established Kubernetes pattern to run the schema migration as an init container, ensuring the database is up to date before the application starts. The migration job can be considerably more resource-intensive than the serving container it precedes.
If you’ve ever wondered why a node looks more saturated than your app metrics suggest, check if it’s running migration pods. Here’s a typical example:
Init Containers:
  schema-migrate:    ← schema migration, runs once before app starts
    requests: { cpu: 1000m, memory: 512Mi}
Containers:
  api-server:
    requests: { cpu: 40m, memory: 64Mi}
The effective requests are:
- CPU:
MAX(1000m, 40m)= 1000m - Memory:
MAX(512Mi, 64Mi)= 512Mi
The scheduler reserved a full CPU core and 512Mi of memory for this pod, even though the serving container only needs a fraction of that during its entire lifetime. Any monitoring tool that reports per-container requests shows 40m CPU. The effective reservation is 25× that.
The scheduler has to accommodate the init-phase peak, not just the running-phase total — the init container has to actually run somewhere before the app can start.
How Dynatrace computes and surfaces the effective value
Dynatrace stores resource metrics at the container level (dt.kubernetes.container.requests_cpu, dt.kubernetes.container.requests_memory, and their corresponding limit equivalents). App and native sidecar containers keep their own rows. The init-phase peak shows up as a pod-level delta — attributable to the pod, not yet to the individual init container.
For most pods, aggregating across containers gives the correct pod total. But when a simple sum would produce an incorrect effective value, Dynatrace adds a compensating delta data point to the same metric at ingest time.
The delta adjusts the sum without modifying any individual container’s data point. For the migration pod above:
| k8s.container.name | k8s.container.type | CPU (millicores) | Memory (MiB) |
| api-server | app | 40 | 64
|
| (compensating delta) | — | +960 | +448 |
| Pod total (sum) | — | 1000 | 512 |
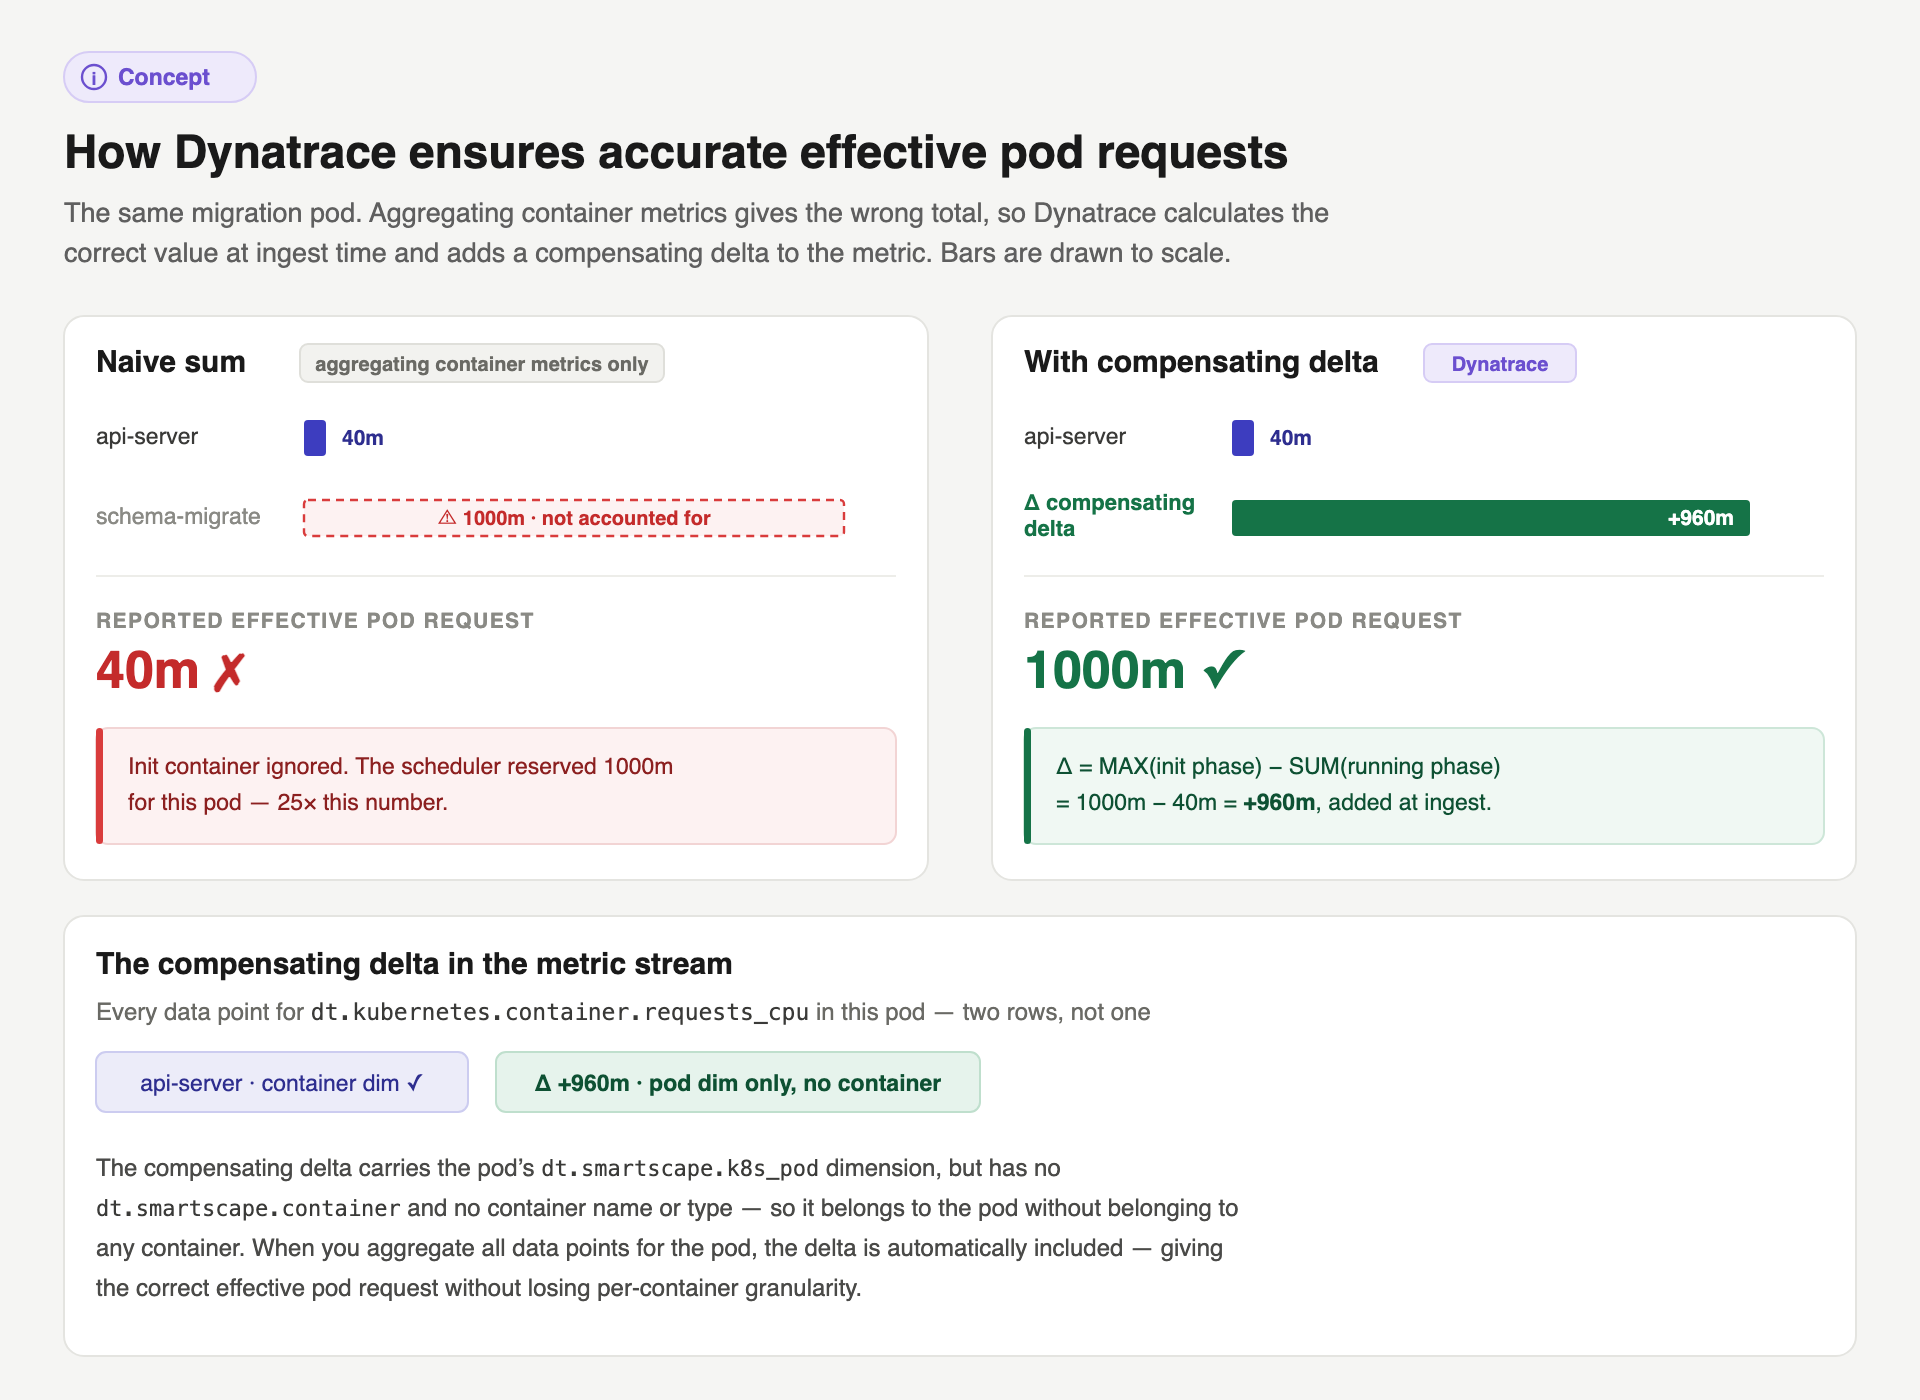
For an SRE or platform architect, this means cluster capacity decisions are based on the number that really matters: the scheduler reservation, not the serving-phase subset. Whether you’re sizing node pools, planning headroom, or deciding when to scale a cluster, you’re working from what Kubernetes actually needs, not an undercount that makes the cluster look roomier than it is.
Seeing it in DQL
Want to check if this is silently affecting any of your workloads right now? Here’s the query:
timeseries {
  cpu = sum(dt.kubernetes.container.requests_cpu),
}, by: { k8s.cluster.name, k8s.workload.name, k8s.pod.name,
         k8s.container.name, k8s.container.type }, from: now()-30m
| filter k8s.cluster.name == "<cluster>" and k8s.workload.name == "<workload>"
| fieldsAdd cpu_millicore = arrayLast(cpu), mem_mib = arrayLast(mem) / 1048576
| fields k8s.pod.name, k8s.container.name, k8s.container.type,
         cpu_millicore, mem_mib
| sort k8s.pod.name asc, k8s.container.name asc
Query one resource at a time. Requesting two metrics in a single timeseries command aligns the series across both and drops the reconciliation row for any pod whose discrepancy affects only one resource.
With the compensating delta in place, you’ll see one row per container plus an extra row with a null container name and type. That null row is the delta. Sum all the rows for a pod to get its correct effective values.
One more twist: pod-level resources
Kubernetes 1.34 graduated PodLevelResources to beta, enabled by default, which lets platform teams set resource requests and limits directly on the pod rather than splitting them across individual containers. It’s a useful tool for multi-container pods where you want to bound total consumption without prescribing the exact per-container split.
spec:
  resources:
    limits:
      cpu: 80m
      memory: 50Mi
  containers:
    - name: app-a
      resources:
        limits:   { cpu: 50m, memory: 30Mi }
        requests: { cpu: 20m, memory: 10Mi }
    - name: app-b
      resources:
        limits:   { cpu: 50m, memory: 30Mi }
        requests: { cpu: 20m, memory: 10Mi }
The container sum here is 100m CPU / 60Mi memory, but the pod-level cap is 80m / 50Mi — that’s the pod’s effective limit, and it’s what the kubelet enforces on the pod cgroup. A tool summing per-container limits reports a ceiling 25% higher than the one actually in force: these two containers can never burn 100m between them. Memory is the sharper case — each container looks safe at 30Mi, but the pod cgroup caps them at 50Mi combined, so both approaching their individual limits gets the pod OOM-killed, with nothing in the per-container view to predict it.
Pod-level requests move in one direction only: Kubernetes rejects a pod-level request below the container sum, so it can raise the scheduler reservation but never lower it.
One subtlety worth knowing: pod-level resources override per resource name and per direction — requests and limits are independent. A pod can set pod-level memory requests while its memory limit still comes from the container-level formula, so one pod can have up to four combinations in play at once.
Dynatrace handles both directions with the same compensating delta: negative when a pod-level cap brings the total down, positive when a pod-level request raises it. Whether Kubernetes is reserving more than your container definitions suggest or enforcing less, what you see in Dynatrace reflects what the cluster actually does, giving platform teams an accurate baseline for every capacity decision.
See the effective value, not just the container sum
Next time you run kubectl describe pod and see 40m, you’ll know what it isn’t telling you. Kubernetes has always computed an effective pod-level value for both requests and limits — effective requests are what your scheduler has used for every placement decision since the first migration pod landed on a node; effective limits are what the kubelet enforces at runtime. Your monitoring just wasn’t tracking either.
With PodLevelResources now beta-by-default in Kubernetes 1.34, every team adopting pod-level resources — for bin-packing efficiency, multi-tenant isolation, or tighter cluster control — is running on a resource model where per-container views can miss the pod-level effective value unless the platform computes it explicitly.
Dynatrace computes the correct number at ingest—for every pod—without configuration.




Looking for answers?
Start a new discussion or ask for help in our Q&A forum.
Go to forum