
MySQL monitoring
App-centric MySQL performance monitoring.
What is MySQL?
MySQL is a popular database (RDBMS) used by many web applications. MySQL is a central component of the LAMP open source web-application software stack (and other AMP stacks). Open source projects that require a full-featured database management system often use MySQL. Applications that use MySQL include: Joomla, WordPress, TYPO3, and Drupal. MySQL is also used in many high-profile, large-scale websites.
Dynatrace monitors MySQL databases across all platforms and analyzes the activity of your database services, providing visibility down to individual MySQL commands.
Easily optimize MySQL performance
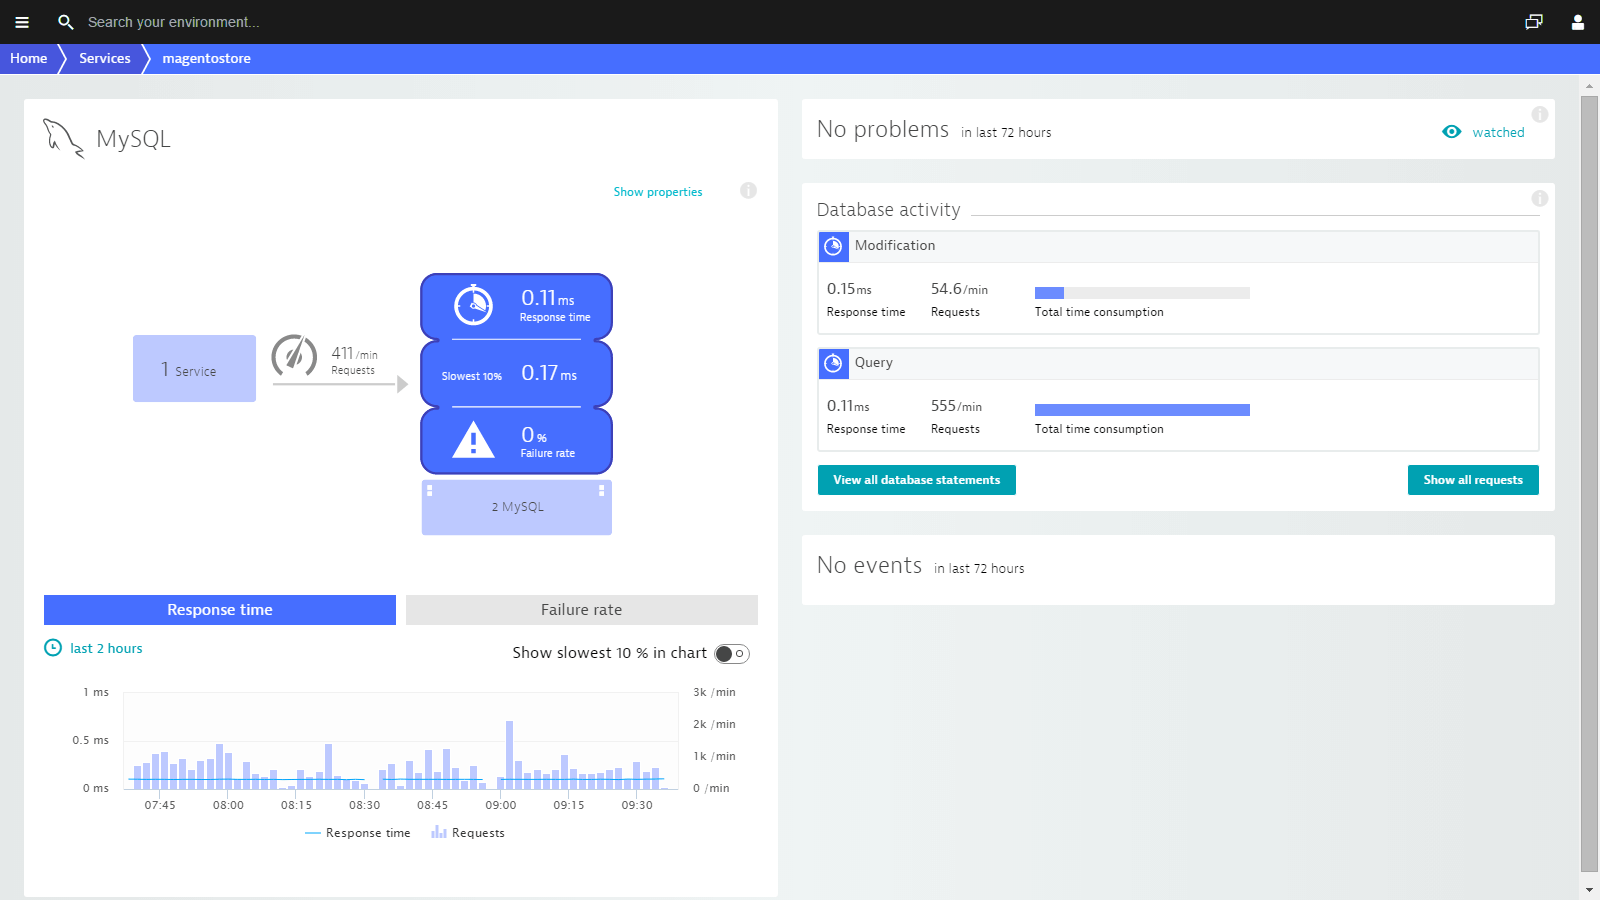
When it comes to analyzing the behavior of MySQL databases, baselining is the approach of choice. By comparing current performance to historical metrics, Dynatrace recognizes when performance is under par. This approach provides you with continuous insights and detailed root-cause analysis when problems occur.
Dynatrace categorizes all activities running on your MySQL instances, providing you with full insight into how your databases are really used. Dynatrace database-service views provide all the metrics you need to set up high-performance database services.
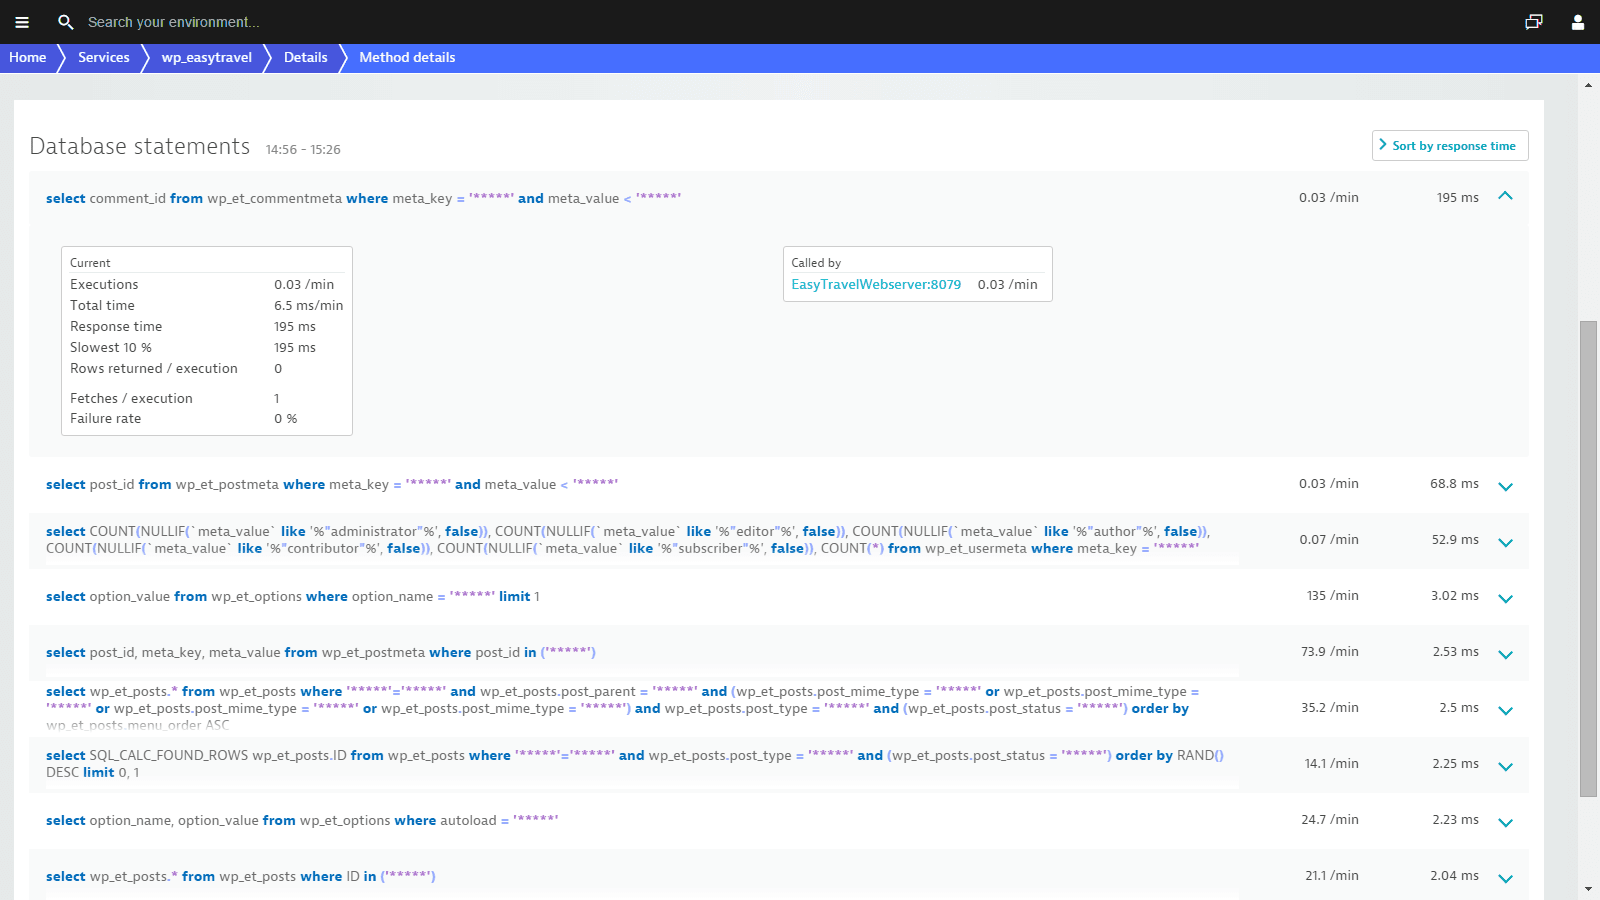
Analyze performance metrics of each MySQL statement
Dynatrace monitors MySQL metrics from your application’s perspective. Because identifying individual non-performing database statements can be time-consuming, Dynatrace automatically identifies expensive database statements (e.g., those that read a lot of data). This approach is ideal for all MySQL database solutions. A complete list of database statements that includes key metrics like response times and numbers of rows is the most valuable information any DevOps team could ask for when optimizing MySQL performance.

We’re intrigued by its capability to work almost out of the box as well as being able to monitor system aspects as well as application performance and user experience.
Start your free Dynatrace trial today!
Get ready to be amazed in 5 minutes our less.


