
Database monitoring
Track and measure your database metrics in real-time to optimize application performance
What is database monitoring?
Database monitoring tracks the database performance and resources to create and maintain a high performing and available application infrastructure. To carry out monitoring, the database system collects information from the database manager, its database, and any connected applications. With this data and metrics, teams are provided with all the information they need to identify and solve any databases issues that impact application performance and are then able to set up high-performing databases.
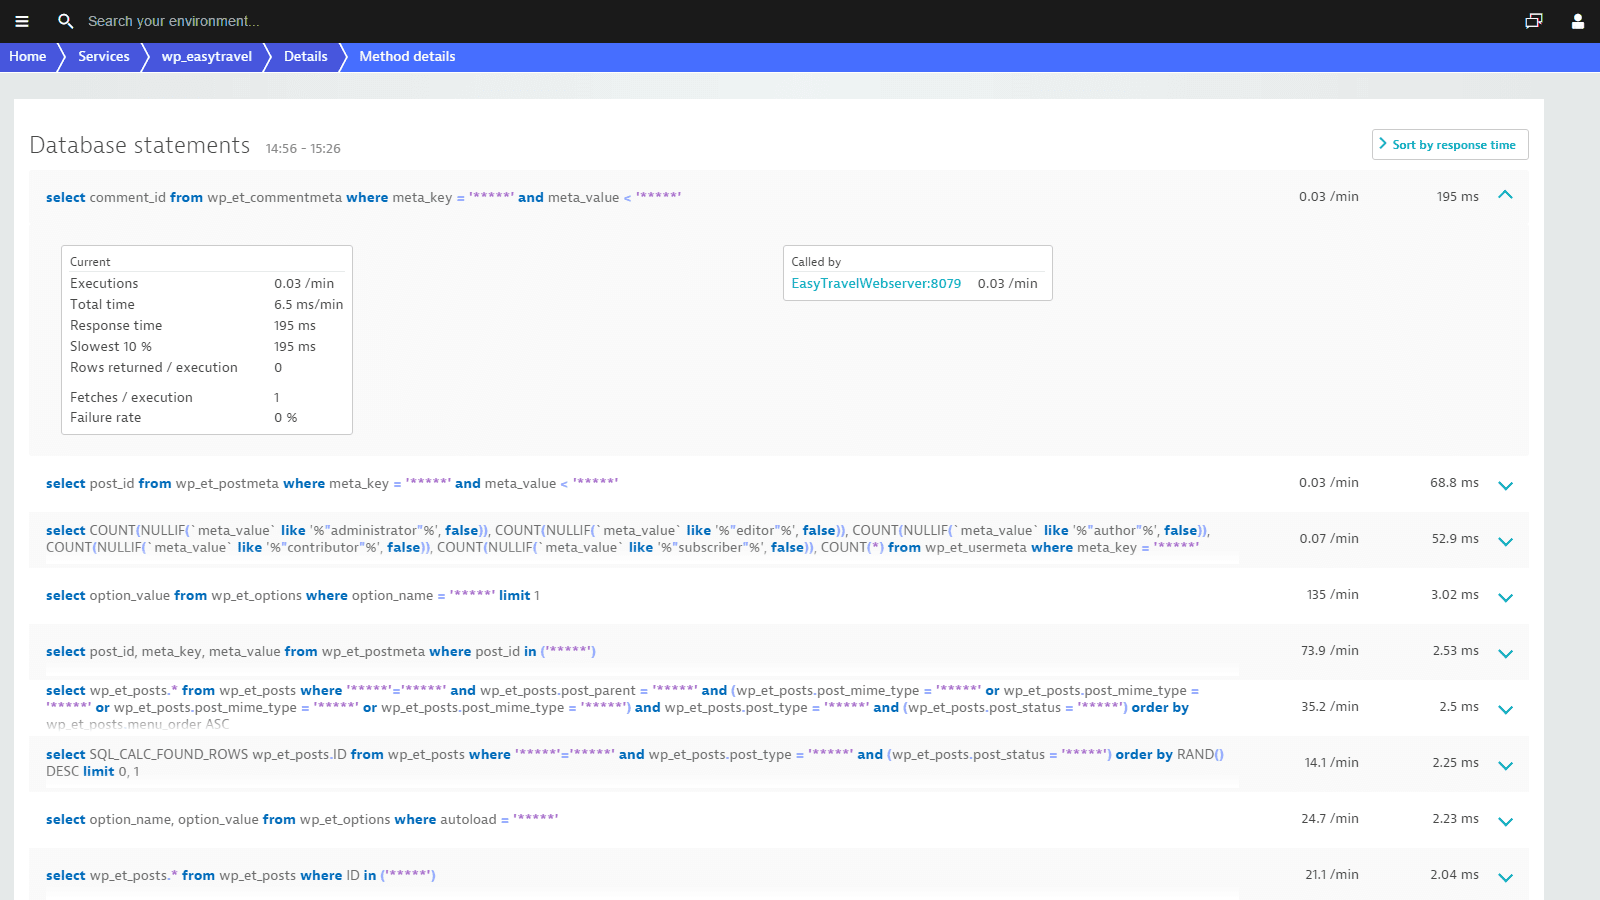
Detailed health metrics for each database statement
Drill down to the SQL-statement level. With Dynatrace database monitoring you can:
- Find expensive statements (i.e., statements that read a lot of data).
- Understand why some statements are slow performers.
- Receive notifications for increased SQL statement costs and execution.
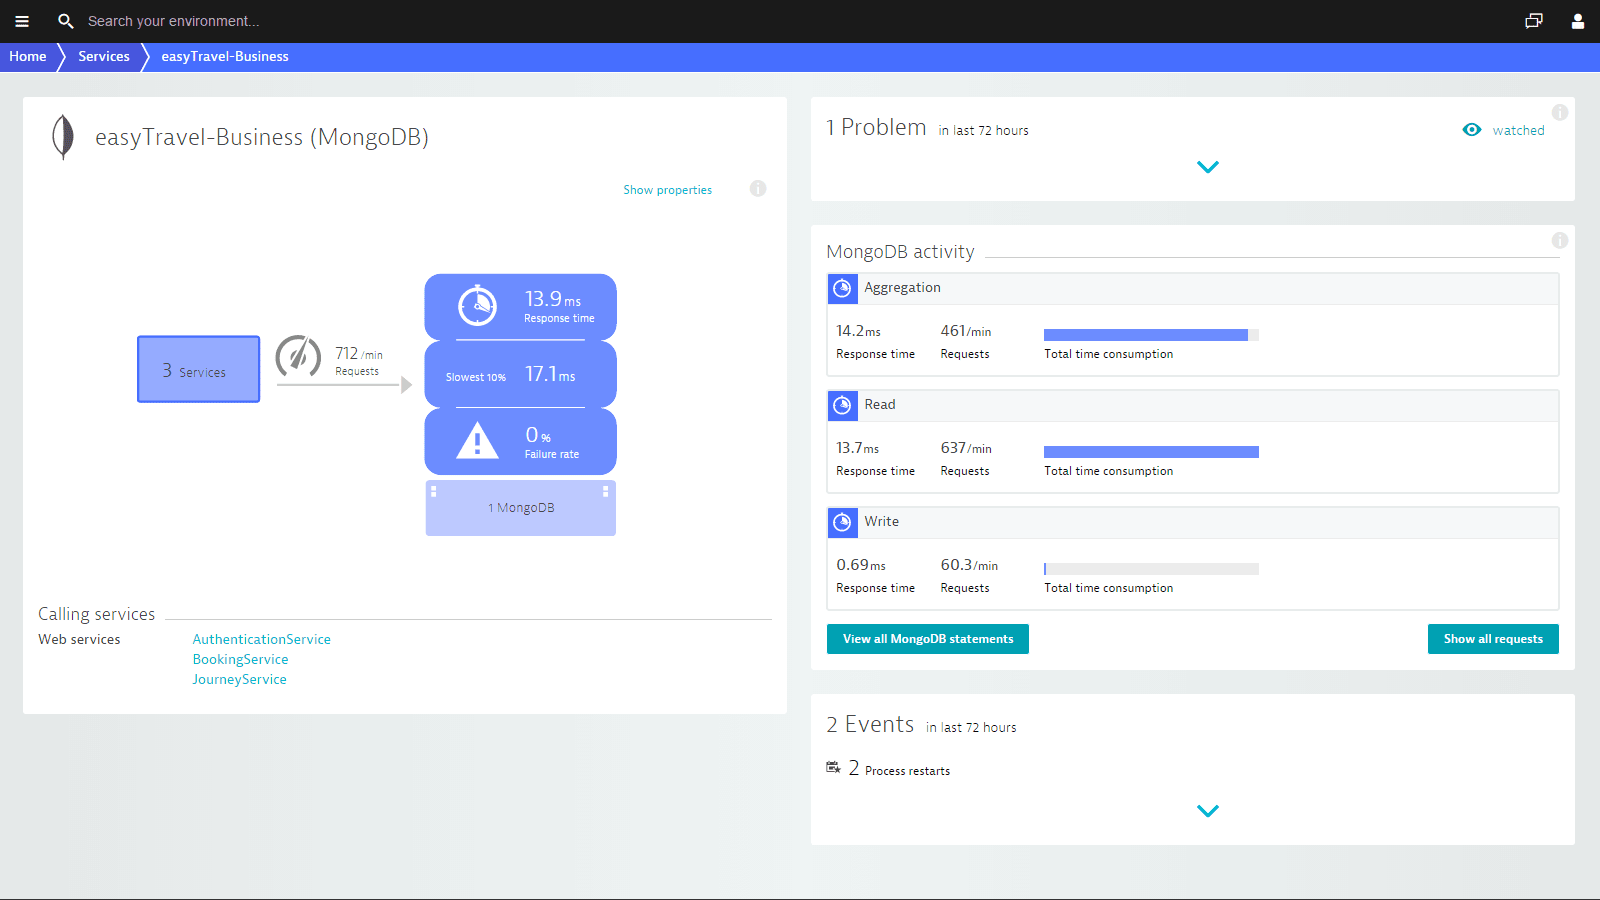
See how every single SQL statement performs
Detailed usage characteristics make configuration easy. Find out the frequency at which each service calls each database. You’ll finally know how services utilize your databases!
Dynatrace categorizes database activities so you have insight into how your databases are used. Helpful infographics and metrics give you all the information you need to set up high-performing databases.
Dynatrace is a G2 Leader in Database Monitoring
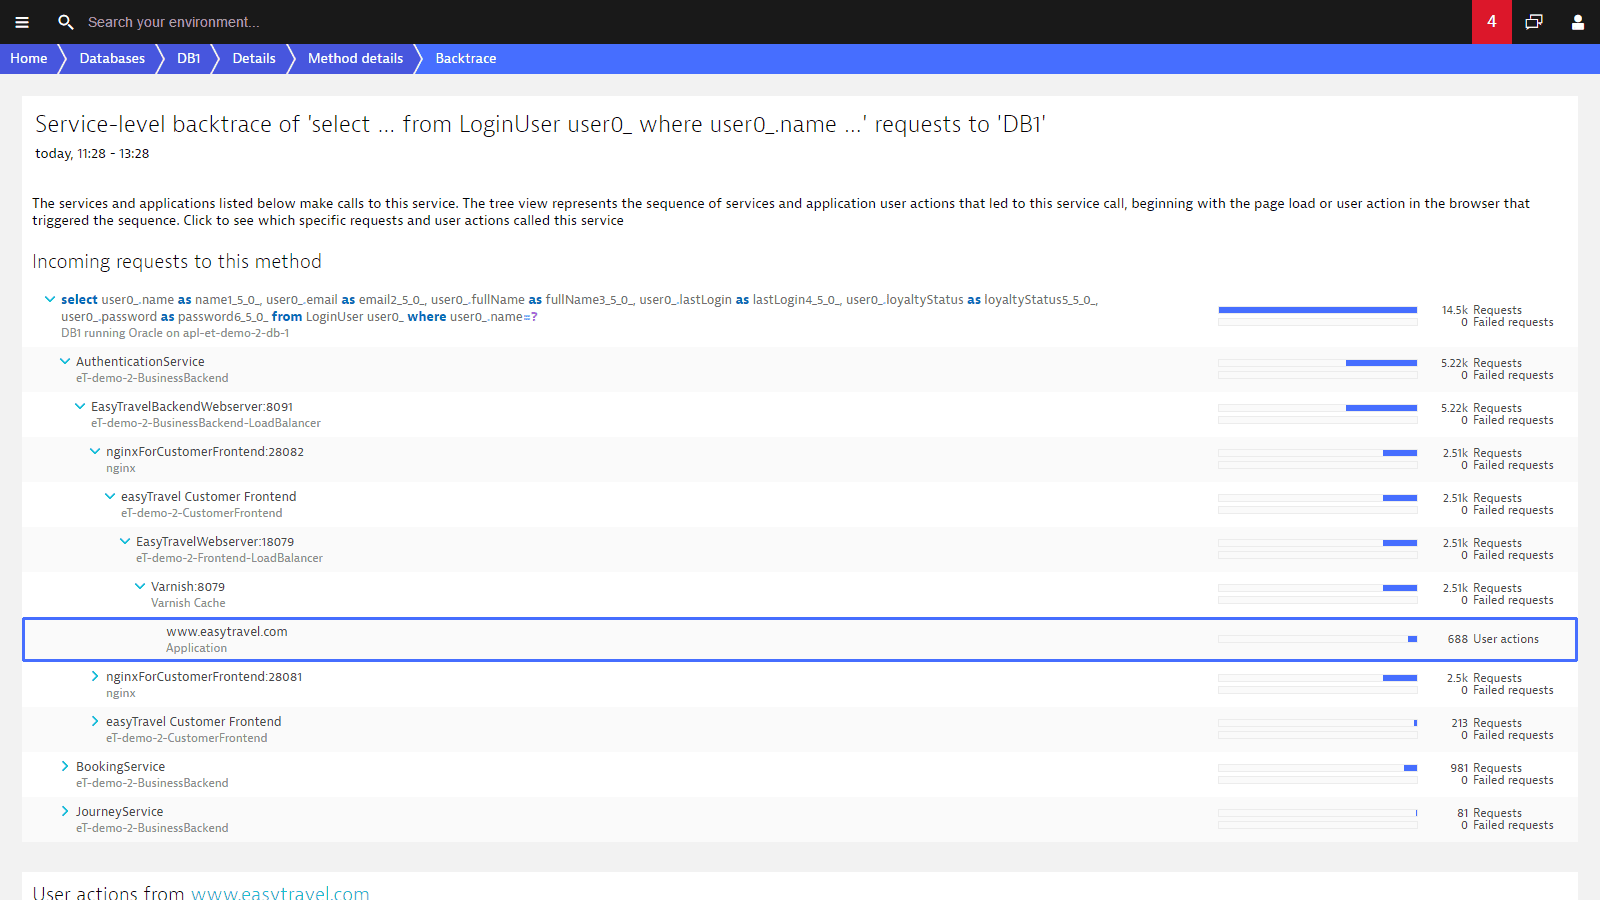
Identify and solve database issues that impact application performance
Find out if it's your code causing problems and learn how to fix database problems without running to your Digital Business Analytics for support. Dynatrace monitors and analyzes the database activity of your services, providing you with observability down to individual SQL and NoSQL statements. With Dynatrace, you see how your application impacts your databases and automatically discover databases using the following technologies:
You don’t have to configure new or obsolete database instances for monitoring because Dynatrace monitors database calls themselves, not database-server processes. You see database load, response times, and failure rates.


Dynatrace shines a torch into the dark corners of an application, so we can see right down into the code and query level. It gives you the evidence you need to be sure of root causes, so we’ve been able to work much more easily with our service providers to resolve issues and get things back on track.
Start your 15 day free Dynatrace trial today!
You’ll be up and running in under 5 minutes:
Sign up, deploy our agent and get unmatched insights out-of-the-box.
A Leader in the 2023 Gartner® Magic Quadrant™ and Ranked #1 in the Critical Capabilities for APM and Observability Reports
See why Gartner positioned us furthest for Completeness of Vision and highest for Ability to Execute in the Magic Quadrant, and ranked us #1 in all Use Cases in the Critical Capabilities Report.


