
Tracciamento distribuito end-to-end su larga scala
Ottieni una visibilità senza precedenti sui sistemi distribuiti grazie all'acquisizione e all'analisi di dati di tracciamento distribuiti da workload cloud native a quelli on-premise.


Trasforma i dati sulle trace in potenti informazioni
Ottimizza le prestazioni delle applicazioni con una visibilità sull'interno stack
- Ottieni un quadro completo mettendo in collegamento tra loro trace, metriche, log e dettagli sulla sicurezza con dati sull'esperienza utente reale.
- Scopri automaticamente istanze dinamiche con supporto per ecosistemi serverless e containerizzati
- Comprendi le relazioni topologiche e le dipendenze per tutti gli ecosistemi (cloud, on-premise, ibridi).
- Completa il tutto con un ecosistema aperto ed estensibile che integra dati aggiuntivi da fonti come OpenTelemetry, Prometheus e molte altre.
Risolvi i problemi con analisi approfondite
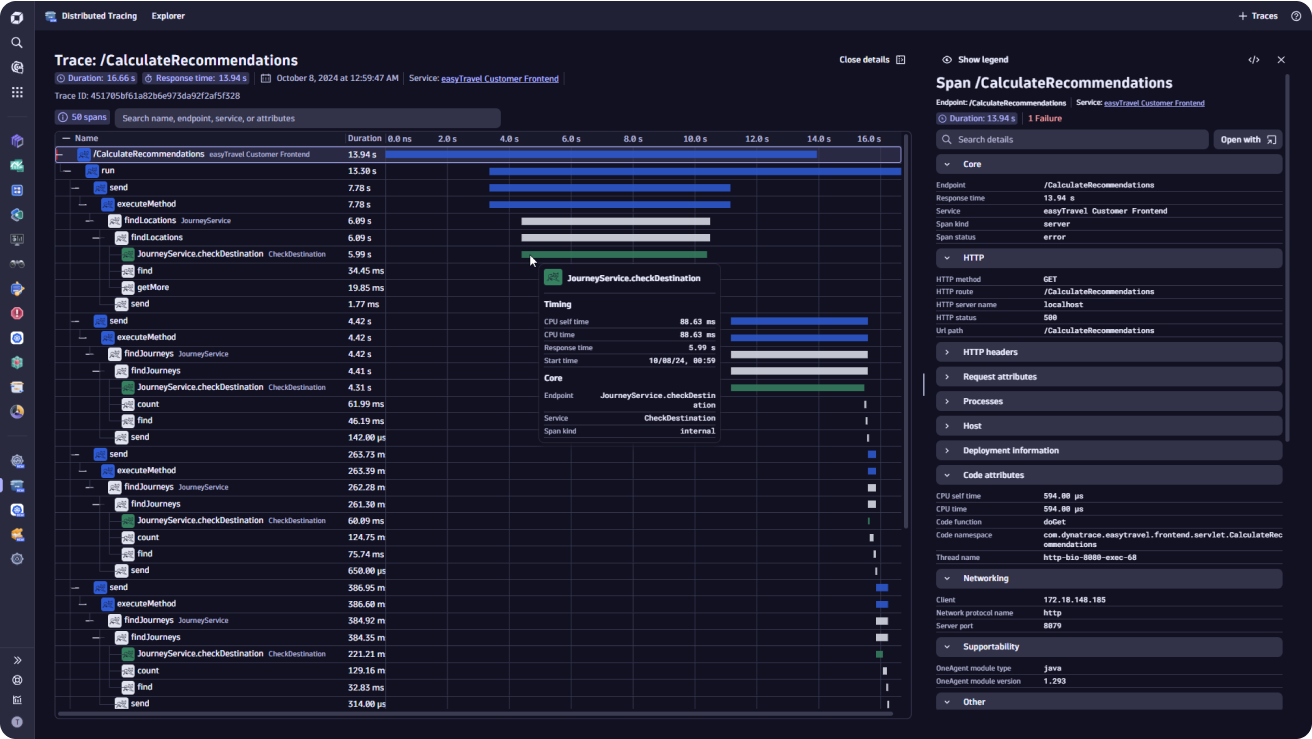
- Analizza in modo dinamico errori ed eccezioni interrogando petabyte di dati di trace in tempo reale.
- Arricchisci i dati delle trace con log, errori e metadati, tra cui attributi OpenTelemetry, con archiviazione fino a 10 anni.
- Metti i dettagli dell'eccezione nel contesto della trace completa per trovare anche l'ago nel pagliaio.
- Raggruppa e filtra facilmente le trace senza modificare il codice o l'implementazione, con attributi Kubernetes inseriti automaticamente nel contesto.
Risolvi più velocemente gli errori e i problemi prestazionali con l'aiuto di Davis AI
- Migliora l'integrità delle applicazioni grazie alla comprensione degli errori e alla determinazione automatica della causa principale.
- Riduci il rumore con una creazione automatica dei valori di riferimento dei problemi per individuare errori e rallentamenti.
- Adotta misure proattive per prevenire problemi futuri usando l'analisi esplorativa e l'IA predittiva per analizzare i dati sulle trace.
- Assegna priorità ai problemi da risolvere con metriche relative all'impatto sul business.
Scopri le incognite sconosciute in modo più rapido
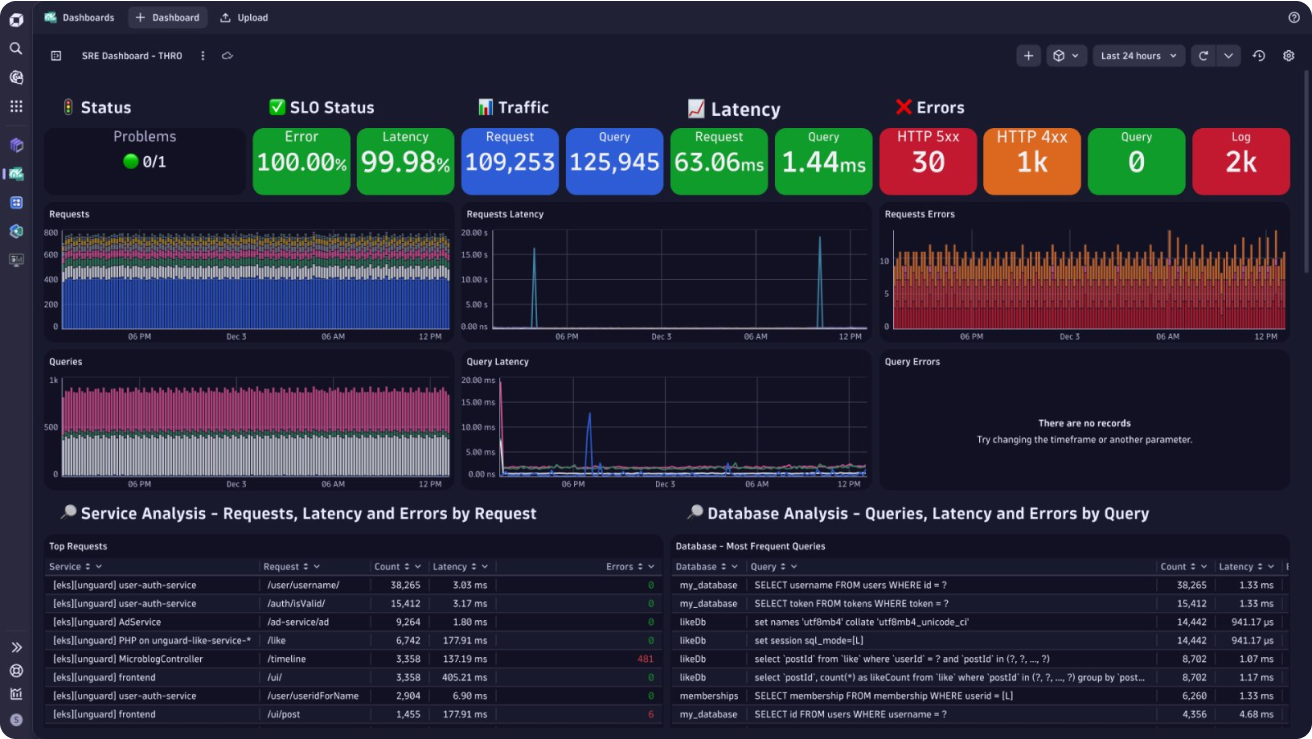
- Combina tutti i segnali di osservabilità, tra cui trace, log, metriche e dati sulla topologia, per creare dashboard e grafici specializzati.
- Massimizza le prestazioni delle applicazioni con l'identificazione immediata dei valori anomali delle prestazioni.
- Esegui workflow automatizzati basati sui dati di tracciamento con AutomationEngine di Dynatrace
- Riduci la curva di apprendimento per l'analisi dei dati sulle trace utilizzando un dizionario semantico standardizzato per OpenTelemetry.
Ecco come eseguiamo il tracciamento distribuito
-
OpenTelemetry
Acquisisci dati di OpenTelemetry, inseriscili in una dashboard e analizzali insieme a metriche, log e diagnostica. Usa un dizionario semantico per semplificare l'onboarding e sviluppare applicazioni affidabili.
-
Grail
Grail®, la tecnologia brevettata di Dynatrace, è un data lakehouse causale che fornisce risposte precise in modo rapido e su larga scala, su una piattaforma di intelligence unificata.
-
OneAgent
Ottieni un tracciamento distribuito end-to-end, analisi e risposte attuabili su larga scala con supporto pronto all'uso per OneAgent®.

Scopri tutti i dettagli
Risorse sul tracciamento distribuito
 BlogApprofondimenti sulle trace: una nuova esperienza per il tracciamento distribuito
Scopri il tracciamento distribuito senza problemi con Dynatrace: filtraggio, visualizzazione e analisi intuitivi per una risoluzione più rapida dei problemi. Performance ClinicTracciamento distribuito con Dynatrace
Scopri come Dynatrace traccia automaticamente le transazioni in ambienti cloud dinamici. POST DEL BLOGL'osservabilità di OpenTelemetry e Dynatrace garantiscono risposte attuabili su larga scala
Massimizza i dati di OpenTelemetry con Dynatrace.


Richiedi una prova gratuita
Scopri come sfruttare l'automazione e l'osservabilità intelligente basata sull'IA. Richiedi subito una prova gratuita della piattaforma Dynatrace.