

OpenTelemetry
Simplify OpenTelemetry complexity and make the most out of your telemetry data with Dynatrace
Dynatrace is committed to Open Source Excellence
Unify your telemetry signals with end to end observability
Maintain control and flexibility by:
- Easily integrating OpenTelemetry signals using OpenPipeline for granular configuration options.
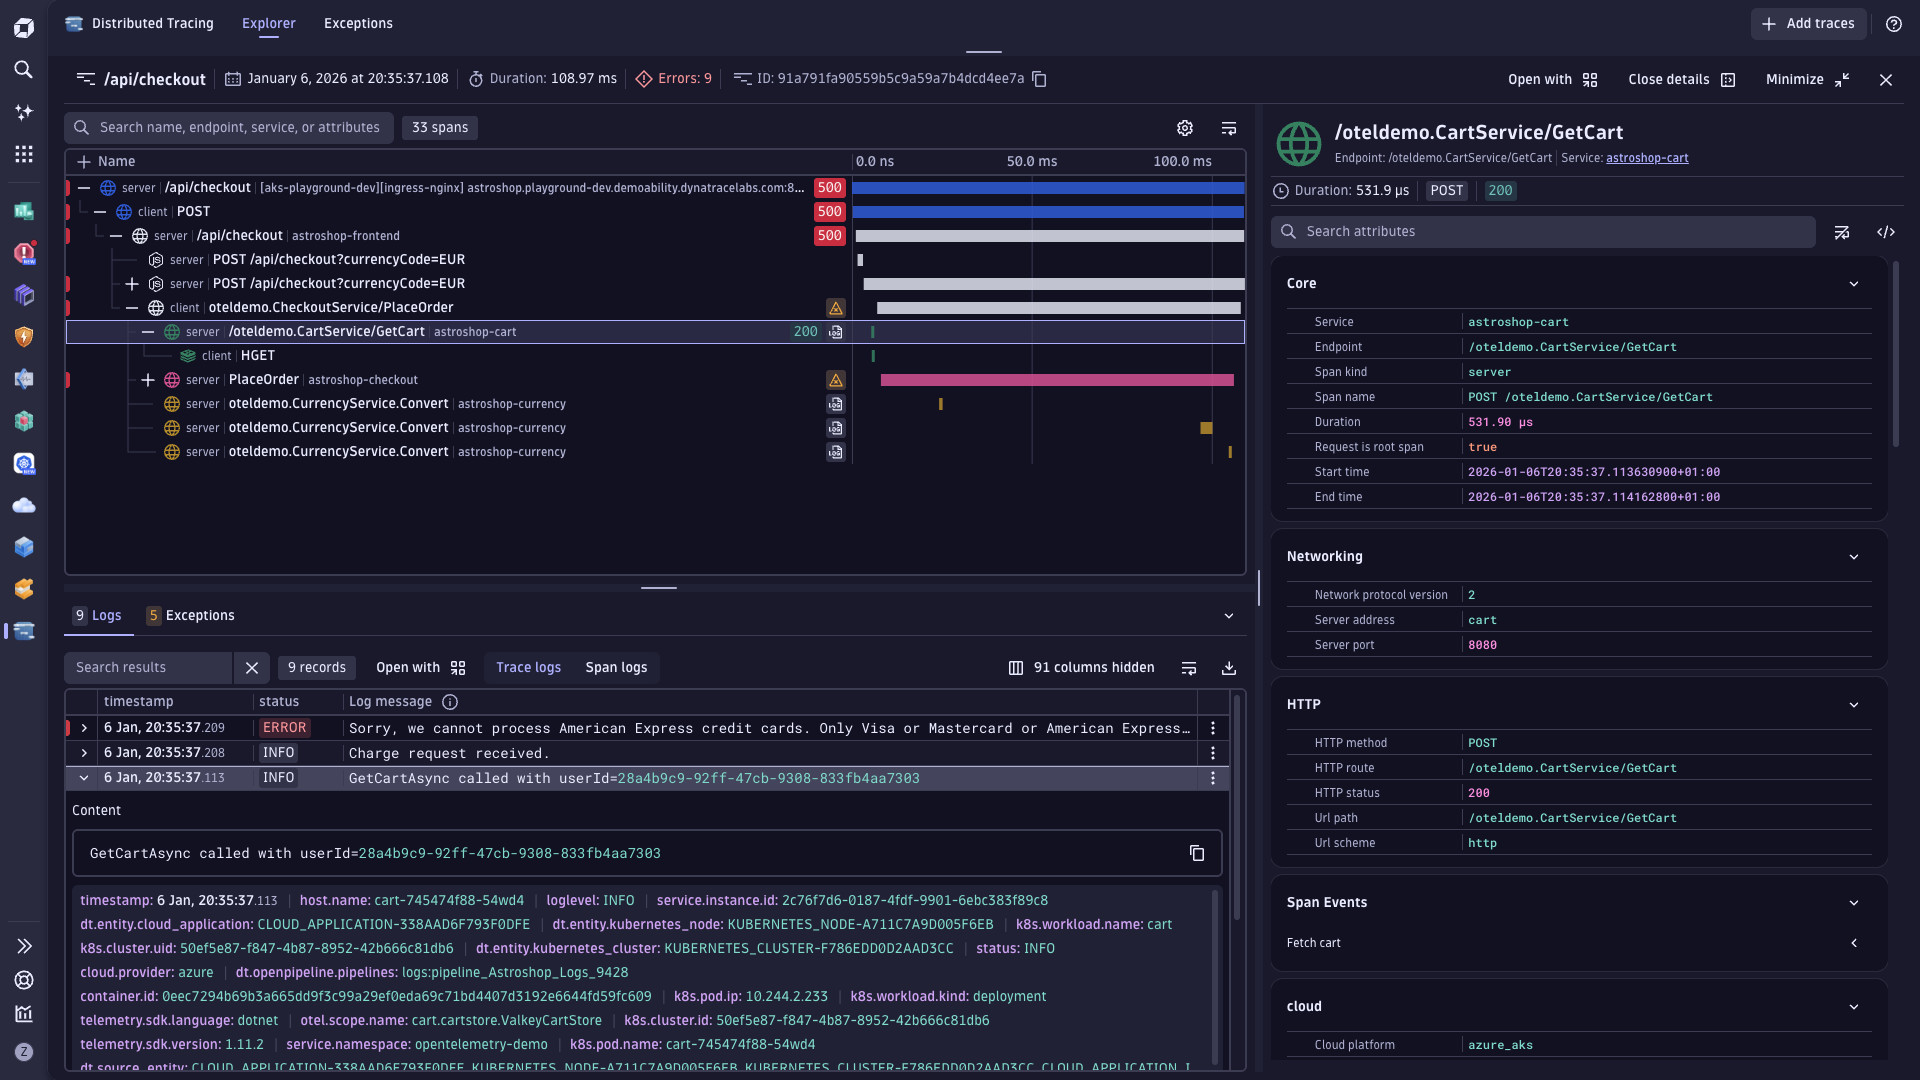
- Get out of the box trace analytics with metrics, logs, and exceptions in context.
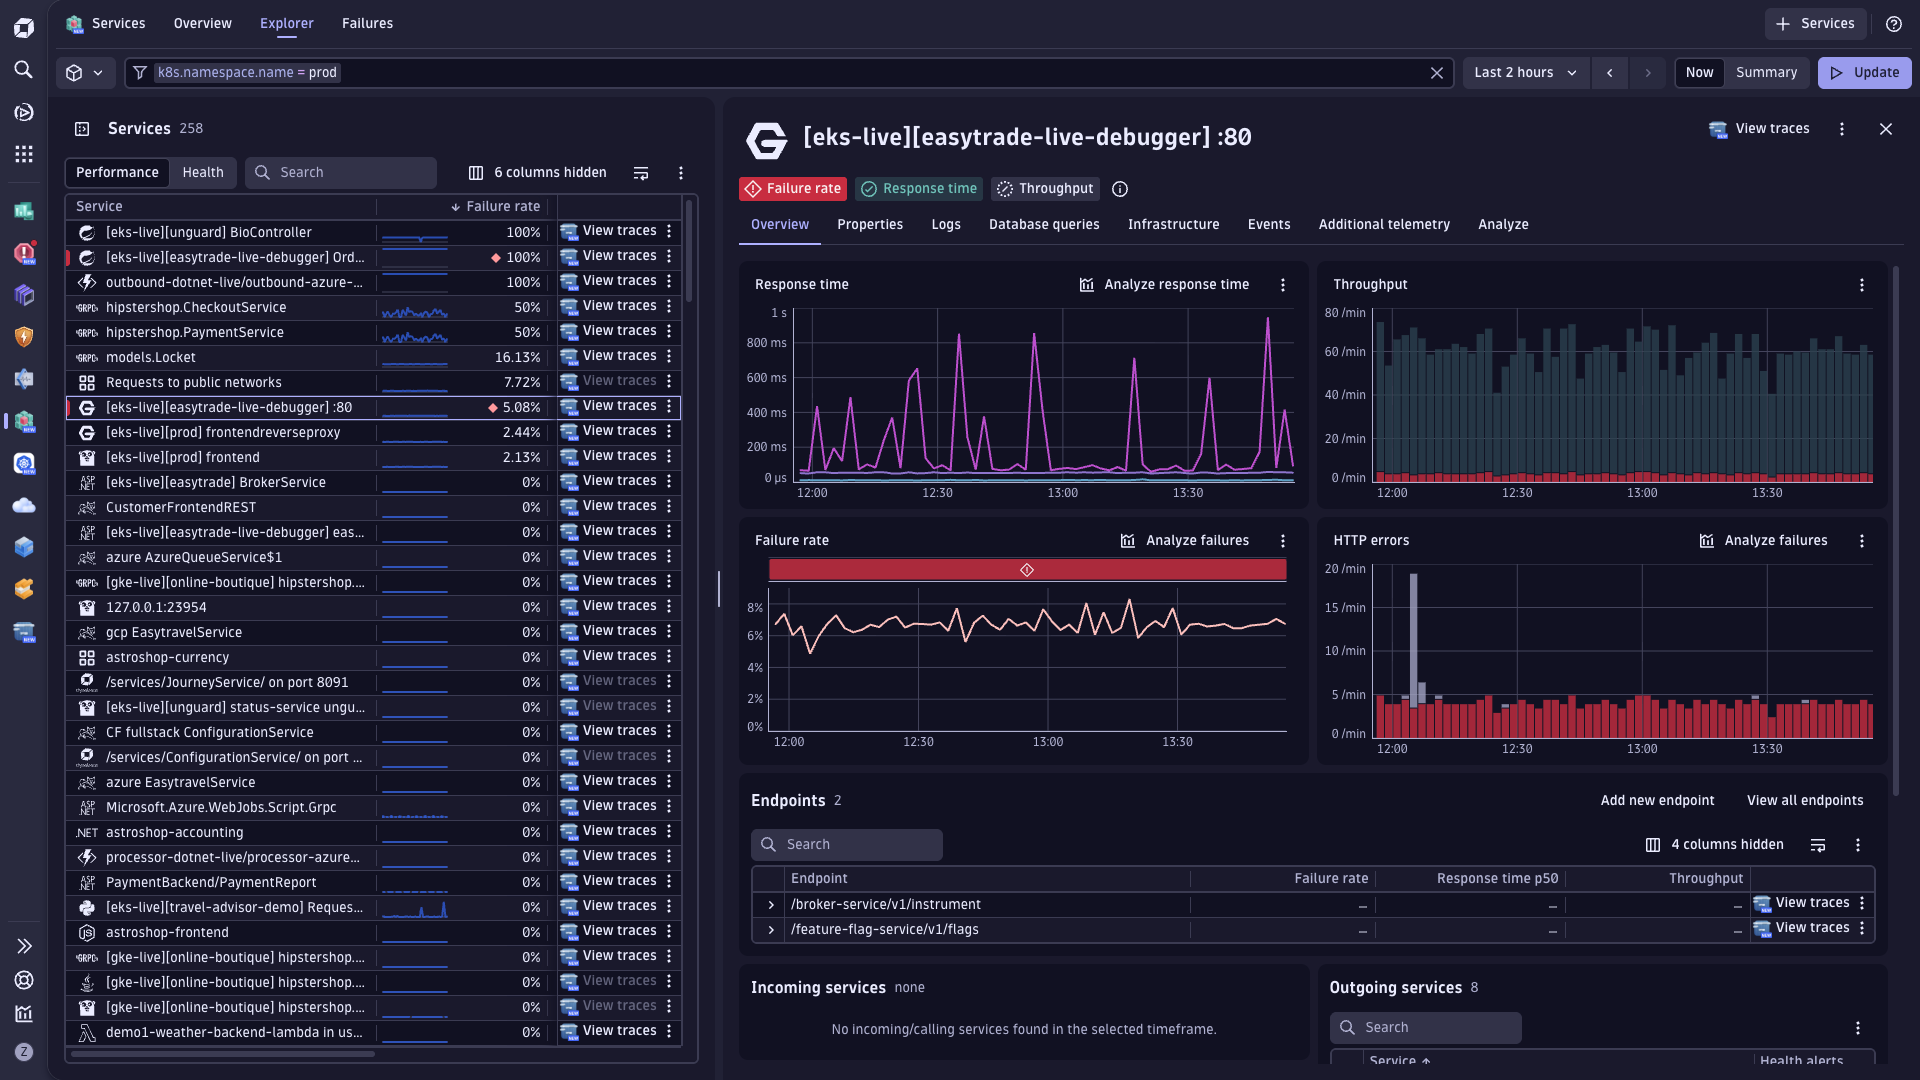
- Streamlining processes, reduce manual intervention, and automatically understand application dependencies.
- Leveraging native support for OpenTelemetry semantic conventions and open-source standardization.
Innovate faster by navigating OpenTelemetry complexities with ease
Spend less time searching for answers and more time developing new ideas by:
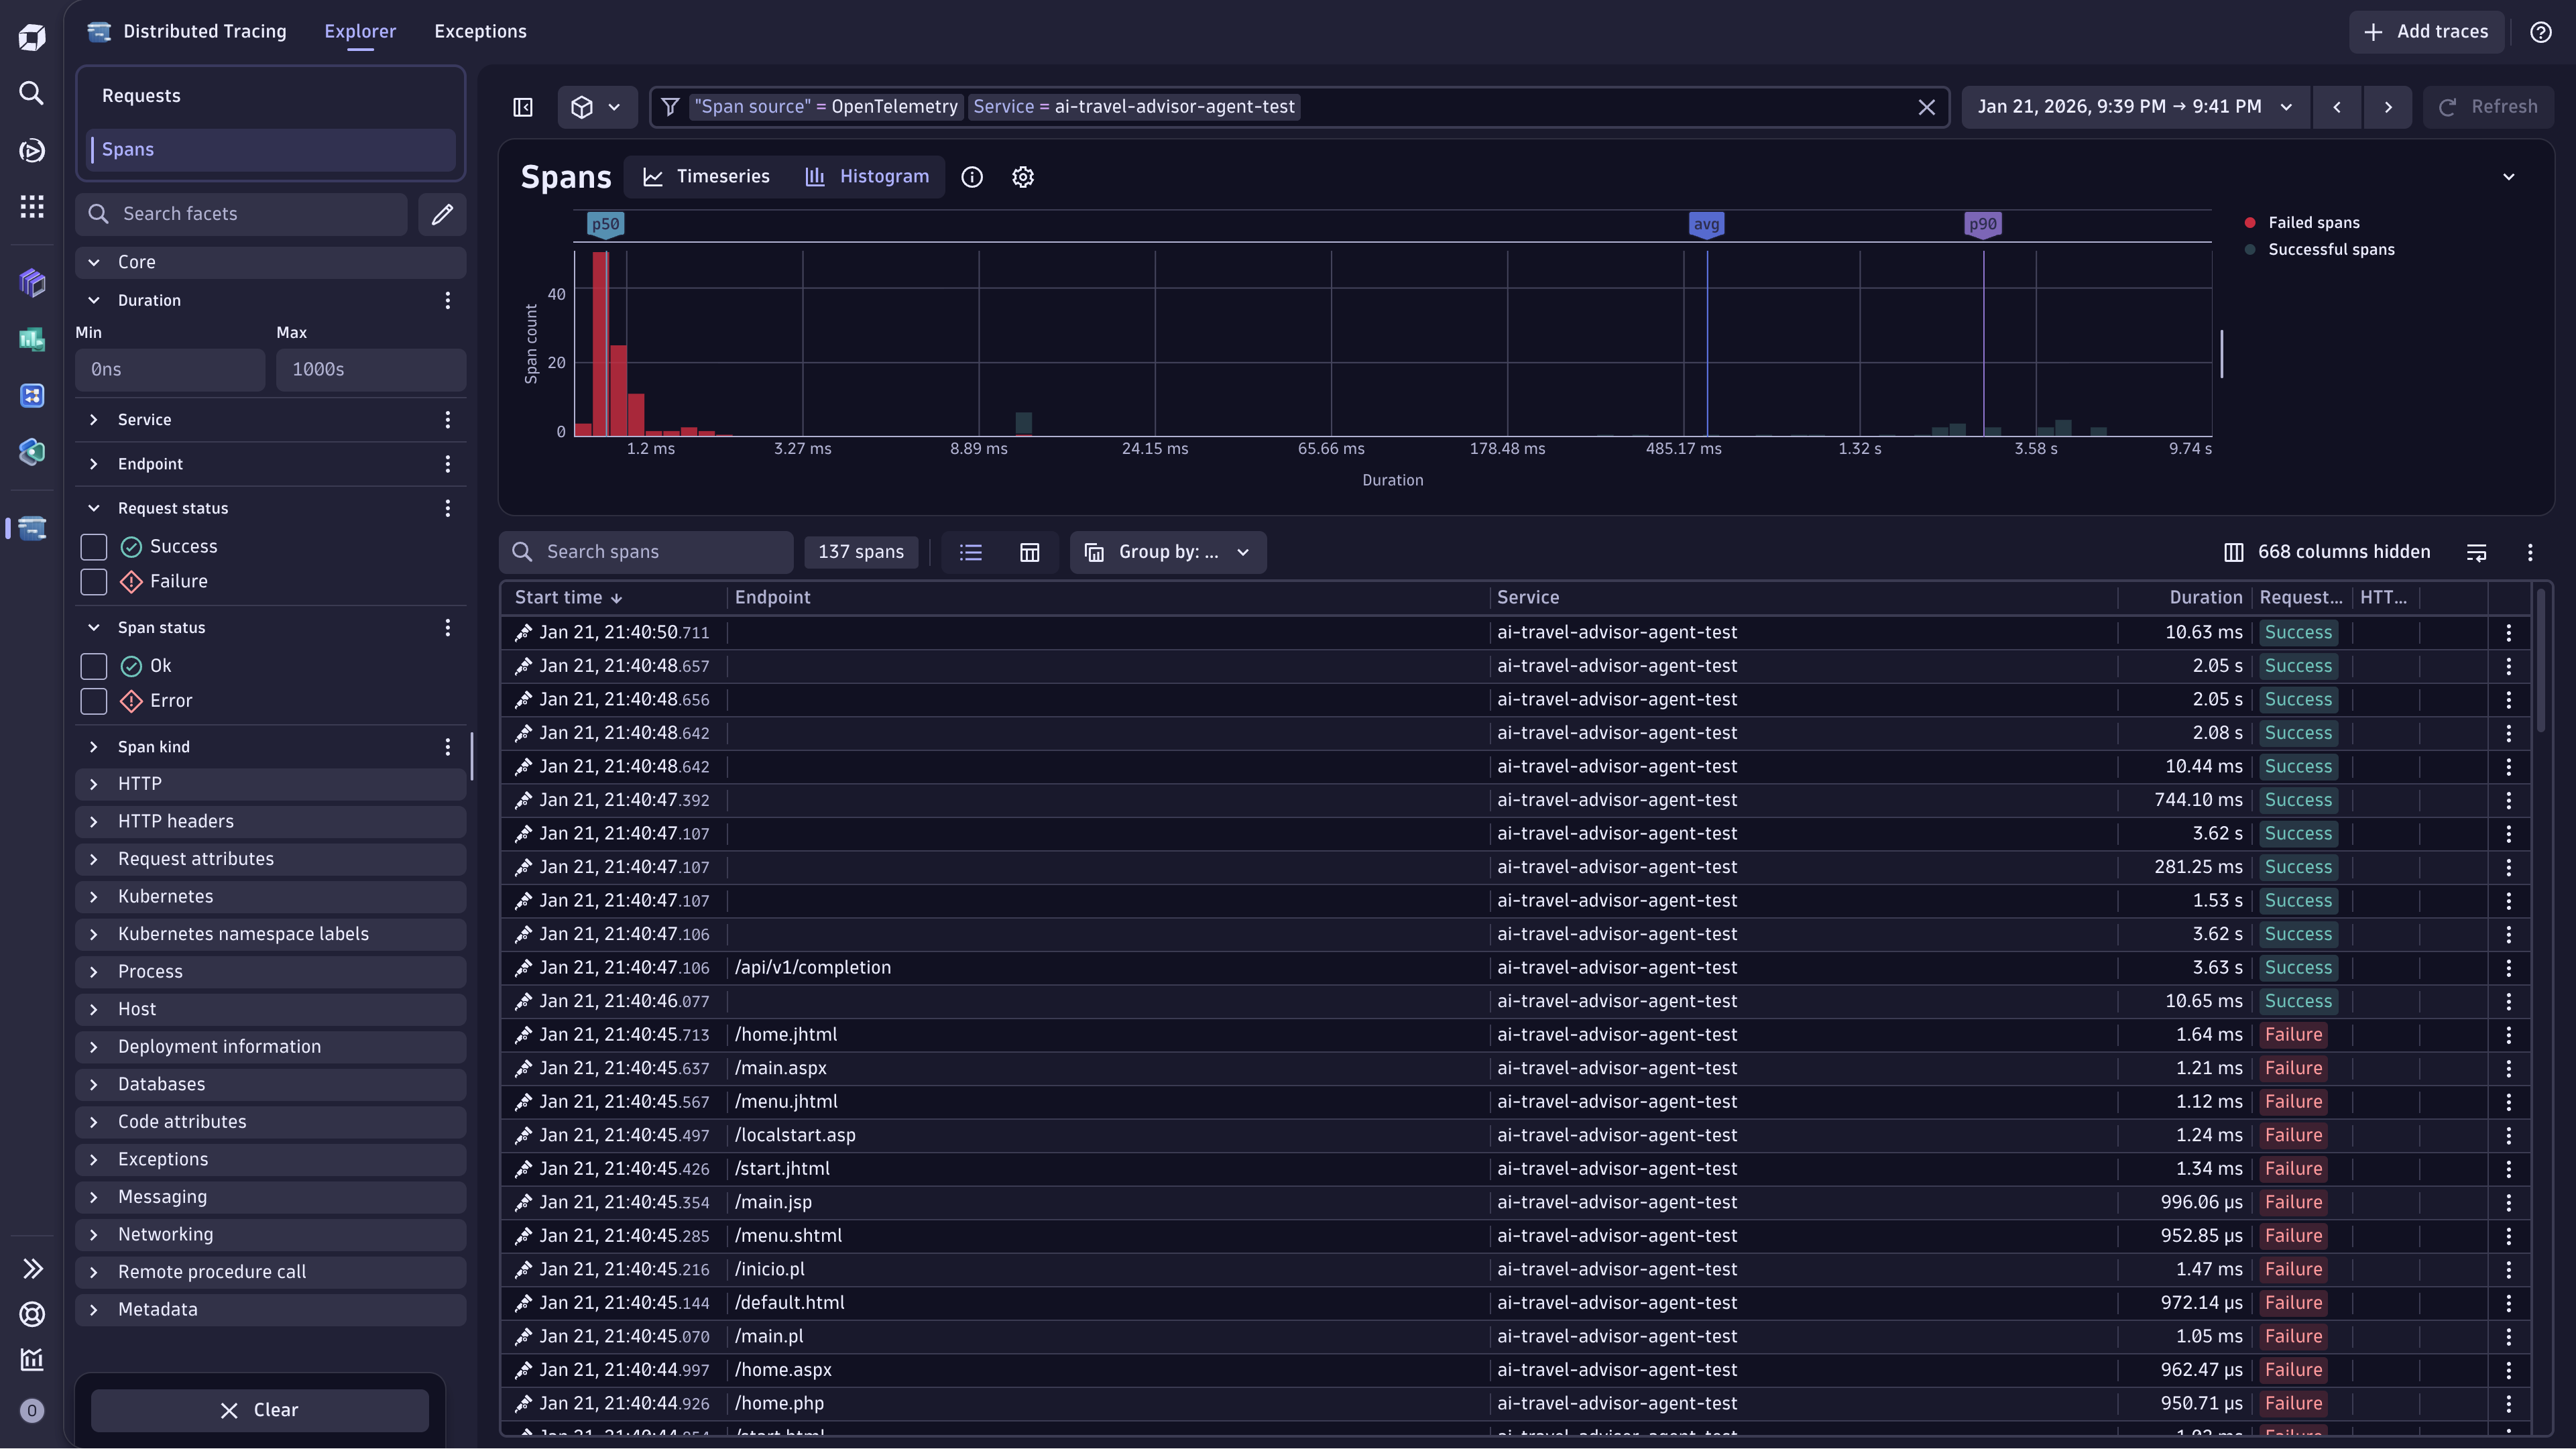
- Getting out-of-the-box contextual trace, logs and metrics analysis with a user-friendly interface.
- Accessing visual, exploratory insights with time-based comparisons to instantly identify regressions and performance patterns.
- Instantly identifying performance outliers and expensive queries to optimize system performance.
- Fostering seamless collaboration between development and operations teams with shared, context-rich insights.
Amplify insights with superior analytics
Get a true 'no boundaries analytics' experience by:
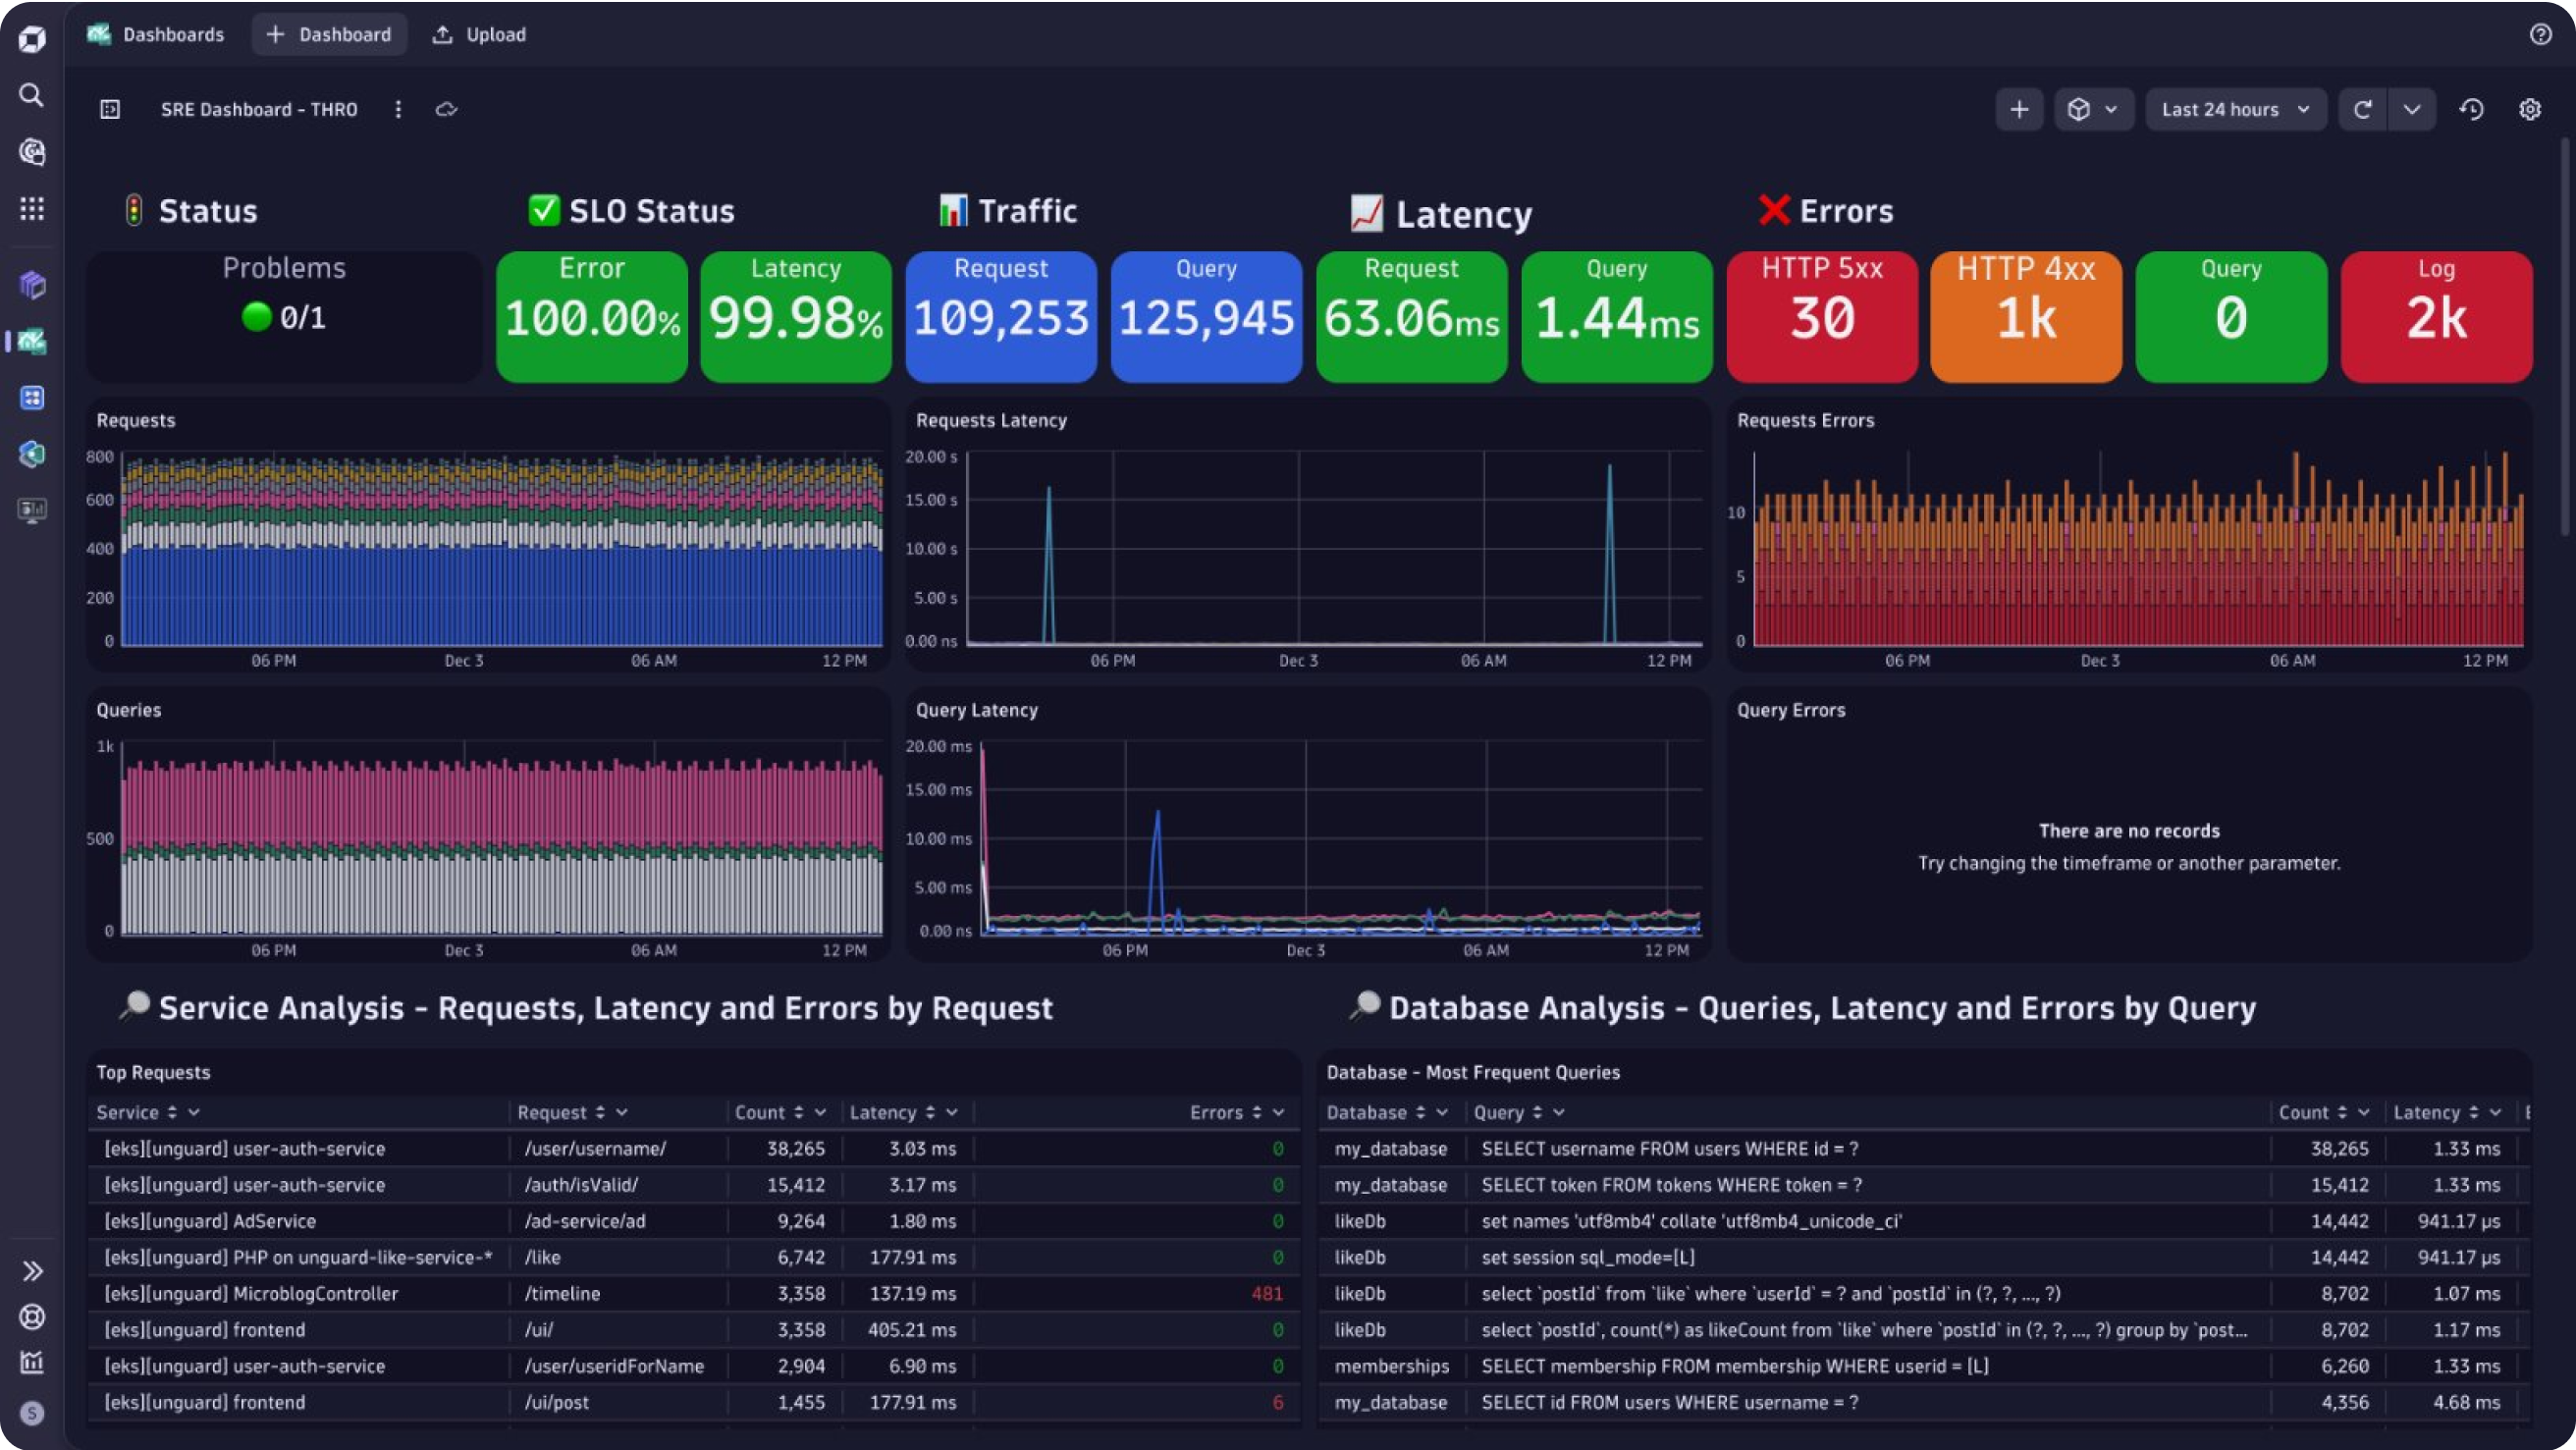
- Diving deep and across multiple observability signals to optimize system performance with Grail.
- Deriving patterns from millions of requests that individual trace inspection would never reveal through mass data analysis.
- Preparing for unplanned cases with on-the-spot analysis and get complete access to your raw data.
- Simplifying onboarding and writing queries with ease using the Dynatrace Semantic Dictionary.
Enterprise-grade OpenTelemetry analytics at scale
Transform your OTel investment into actionable insights:
- Turn massive telemetry volumes into clear, actionable insights that drive faster decisions
- Gain unified visibility across cloud-native environments, reducing risk and operational blind spots
- Govern and scale OpenTelemetry with enterprise controls that optimize cost and performance
- Deliver measurable business outcomes while empowering teams with trusted, scalable analytic
Explore our rich support
Learn how to extend to any language or framework that supports OpenTelemetry,
such as Go, Java, Javascript, PHP, Python, Ruby, and more!
such as Go, Java, Javascript, PHP, Python, Ruby, and more!


Dive into the details
-
Full stack observability
Monitor and analyze your entire stack, with AI-driven context, with a single solution combining logs, metrics and traces.
-
Observability for Developers
Get to the root cause faster with real-time visibility of your code wherever it's running.
-
Read Documentation
Dive into our OpenTelemetry documentation for more details.
-
Visit our Community
Ask questions and get insights from Dynatrace users.
-
Explore our Hub
See how to extend the platform with apps and extensions.
Related resources
 EbookOpenTelemetry and the opportunity for intelligent observability
OpenTelemetry is an open source observability framework for cloud-native software that was created from the merger of the OpenTracing and OpenCensus projects. BlogDEMO: The road to observability with OpenTelemetry: Identifying metrics and traces
A step by step approach to setting up OpenTelemetry and Dynatrace. BlogData in context: How Dynatrace solves the OpenTelemetry analytics challenge
Discover a new era of enterprise-grade observability with OpenTelemetry and Dynatrace. Our latest enhancements unlock powerful possibilities for modern cloud native teams with mass data analysis (MDA) at scale.


