
Verteiltes End-to-End-Tracing in großem Umfang
Verschaffen Sie sich neuartige Einblicke in verteilte Systeme, indem Sie verteilte Tracing-Daten erfassen und analysieren, von Cloud-nativen bis hin zu On-Premise-Workloads.


Gewinnen Sie aus Trace-Daten wertvolle Erkenntnisse
Optimieren Sie die Anwendungs-Performance mit Full-Stack-Sichtbarkeit
- Verschaffen Sie sich ein vollständiges Bild, indem Sie Traces, Metriken, Logs und Sicherheitsdetails mit echten Benutzererfahrungsdaten verknüpfen.
- Erkennen Sie automatisch dynamische Instanzen mit Unterstützung für serverlose und containerisierte Ökosysteme
- Gewinnen Sie ein Verständnis der topologischen Beziehungen und Abhängigkeiten in allen Ökosystemen (Cloud, On-Premise, Hybrid)
- Decken Sie alles mit einem erweiterbaren offenen Ökosystem ab, das zusätzliche Daten aus Quellen wie OpenTelemetry, Prometheus und vielen anderen integriert.
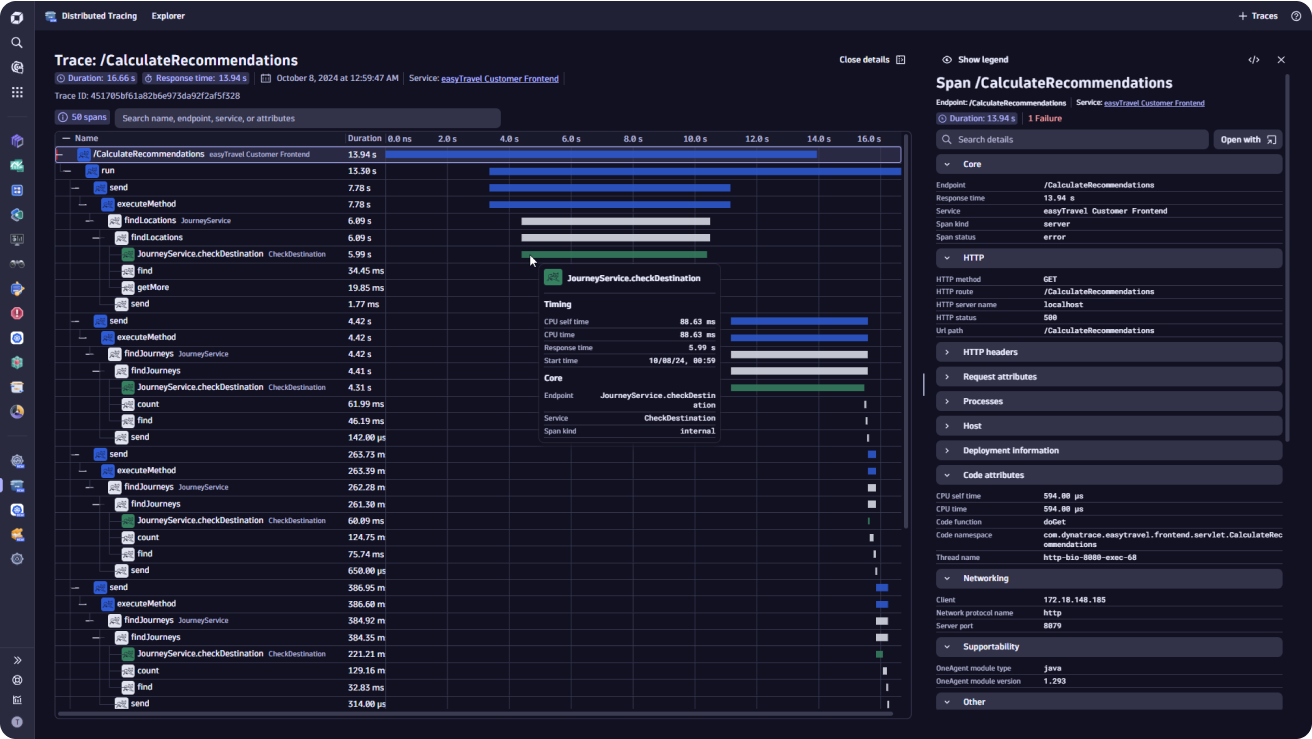
Problembehebung mit tiefgreifender Analyse
- Analysieren Sie Fehler und Sonderfälle dynamisch durch die Echtzeit-Abfrage von Petabytes an Trace-Daten
- Reichern Sie Trace-Daten mit Protokollen, Fehlern und Metadaten einschließlich OpenTelemetry-Attributen an und bewahren Sie diese bis zu zehn Jahre lang auf
- Setzen Sie Ausnahmedetails in den vollständigen Trace-Kontext, um die Nadel im Heuhaufen zu finden
- Gruppieren und filtern Sie mühelos Traces ohne Code- oder Bereitstellungsänderungen mit automatisch im Kontext dargestellten Kubernetes-Attributen
Beheben Sie Fehler und Performance-Probleme schneller mit der Unterstützung von Davis AI
- Verbessern Sie den Zustand der Anwendung, indem Sie ermitteln, was fehlgeschlagen ist, und automatisch die Grundursache bestimmen
- Reduzieren Sie Störgeräusche mit einer automatischen Problem-Baselining-Suche nach Fehlern und Verlangsamungen
- Ergreifen Sie proaktive Maßnahmen, um zukünftige Probleme zu verhindern, indem Sie explorative Analysen und prädiktive KI zur Analyse von Trace-Daten einsetzen
- Priorisieren Sie Problemlösungen anhand von Metriken zur Geschäftsauswirkung
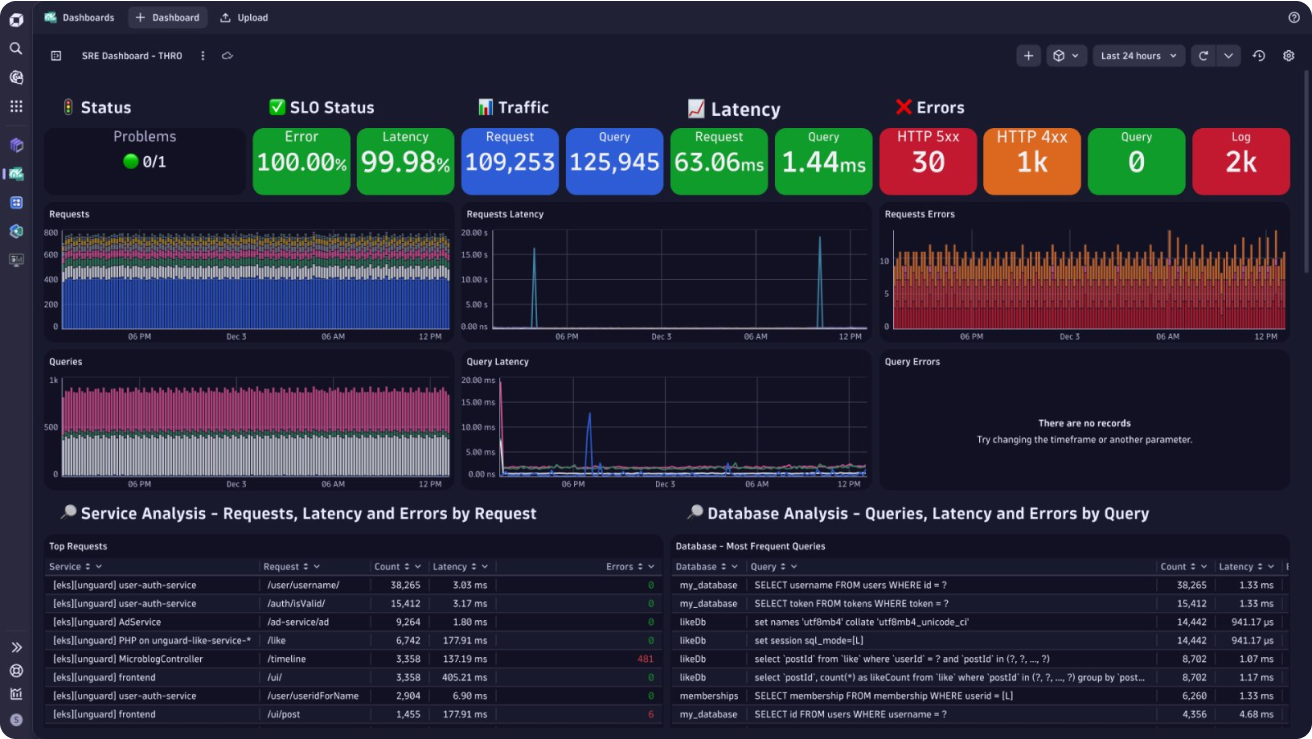
Entdecken Sie schneller „unbekannte Unbekannte“
- Kombinieren Sie alle Observability-Signale, einschließlich Traces, Logs, Metriken und Topologiedaten, um spezielle Dashboards und Diagramme zu erstellen
- Maximieren Sie die Anwendungs-Performance durch sofortige Erkennung von Leistungsausreißern
- Führen Sie automatisierte Workflows auf Grundlage von Trace-Daten mit der AutomationEngine von Dynatrace aus
- Verkürzen Sie die Lernkurve für die Analyse von Trace-Daten durch die Verwendung eines standardisierten semantischen Wörterbuchs für OpenTelemetry
So funktioniert verteiltes Tracing bei uns
-
OpenTelemetry
Lesen Sie OpenTelemetry-Daten ein, erfassen Sie sie in einem Dashboard und analysieren Sie sie neben Metriken, Logs und Diagnosen Nutzen Sie ein semantisches Wörterbuch zum einfachen Onboarding und für solide Anwendungen
-
Grail
Die patentierte Grail® Technologie von Dynatrace ist ein kausales Data Lakehouse, das schnell und in großem Umfang präzise Antworten auf einer einheitlichen Intelligence-Plattform liefert.
-
OneAgent
Profitieren Sie von verteiltem End-to-End-Tracing, Analysen und umsetzbare Antworten in großem Umfang mit sofort nutzbarer Unterstützung für OneAgent®
Stets bestens informiert
Ressourcen für das verteilte Tracing
 BlogMühelose Trace-Einblicke: eine neue Erfahrung für verteiltes Tracing
Entdecken Sie müheloses verteiltes Tracing mit Dynatrace: intuitive Filterung, Visualisierung und Analyse für eine schnellere Problemlösung Performance ClinicVerteiltes Tracing mit Dynatrace
Wie Dynatrace automatisch Transaktionen in dynamischen Cloud-Umgebungen verfolgt. BLOG-BEITRAGOpenTelemetry-Observability und Dynatrace liefern umsetzbare Antworten in großem Umfang
Steigern Sie die Leistungsfähigkeit der OpenTelemetry-Daten mit Dynatrace.


Kostenfreie Testversion anfordern
Sie möchten wissen, was intelligente Observability mit KI und Automatisierung für Sie leisten kann? Holen Sie sich jetzt Ihre kostenfreie Testversion der Dynatrace-Plattform.