
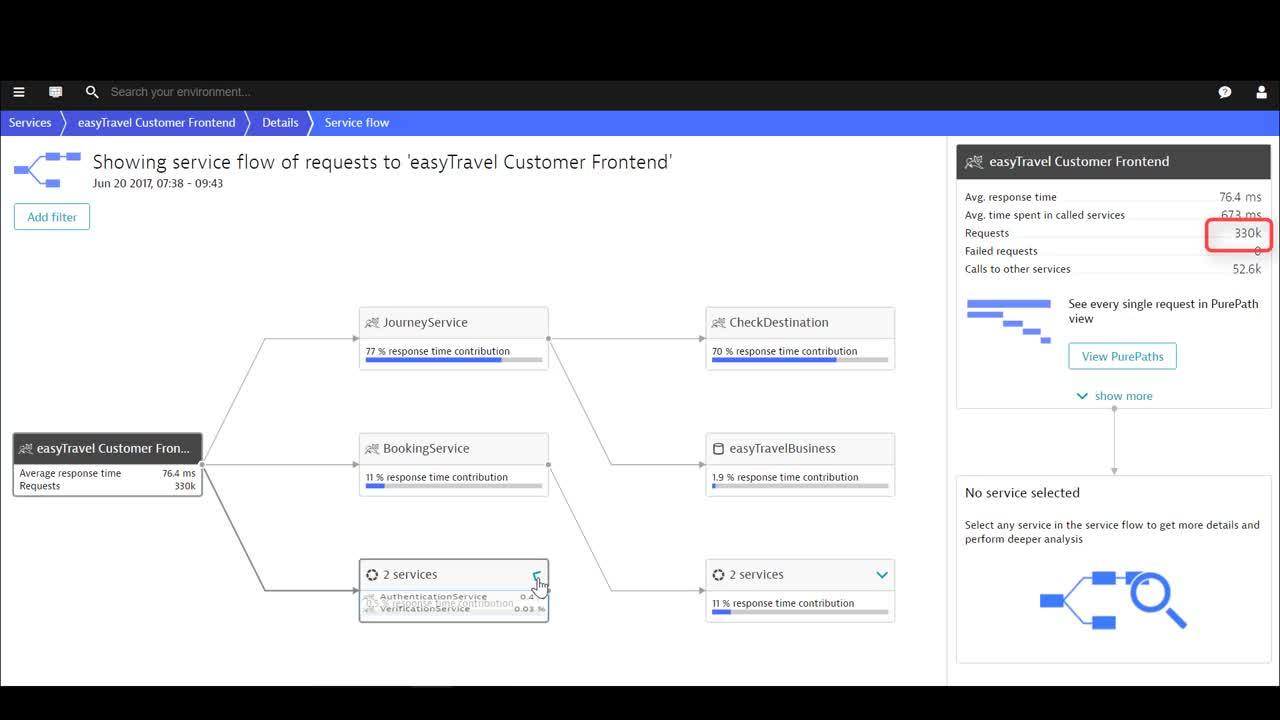
Service flow
Dynatrace shows you how every single individual service request behaves and performs end to end

One-click insight into complex service call sequences end to end
In today's ultra-complex service architectures—where millions of unique requests all behave slightly differently—it's beyond human capabilities to know exactly which services get triggered by a single user action or application, and how those services in turn call other services.
With just a single click, Dynatrace service flow automatically maps out for you individual service requests from end to end—you see the specific sequence of every service called as a result of any single request.
- No more guesswork: Understand exactly which applications and user actions trigger which services, step by step & end to end.
- Complexity simplified: See at a glance which services are dependent on other services.
- 3rd-party insight: Identify how, where, and when 3rd-party services interact with your application-delivery chain.


Understand how performance of individual services impacts customers
Service flow doesn't just show you how individual service requests behave, it tells you how they perform. Dynatrace, with end-to-end full stack observability capabilities, provides metric detail on number of requests, average response time, and—most significant to customers' user experience—how each single service in a specific call sequence contributes to the overall response time.
- Pinpoint bottlenecks along the application service-request call chain.
- Identify and fix chatty service requests.
- Detect issues with 3rd-party services.


PurePath® provides us with objective, rational, intuitive and easy-to-use results. There’s never a question about what happened or why.
Find the needle in a haystack with advanced filters
Analyzing the behavior and performance of individual requests in modern application environments can be like trying to find a needle in a haystack. Our advanced filtering capabilities make it easy to zero in on subsets of requests. Instead of combing through thousands of transactions manually, simply define your criteria and Dynatrace automatically finds the handful of requests that are important to you.
Create complex, multi-faceted call sequence filters to slice and dice the data based on your unique needs—you immediately get refreshed metric details within the context of only that particular subset:
- Requests involved in a specific call sequence
- Requests that exceed a certain response time or CPU time threshold
- Failed requests
- Specific HTTP method and more
Analyze different aspects of problematic call sequences in seconds
Dynatrace lets you look at service flows from multiple angles with just a couple of clicks. Because service flow filters remain consistent across all analysis views, your analysis remains focused on the exact call sequence that you’re interested in as you step through all available analysis.
The PurePath view shows each service call as individual requests—each of which can be analyzed separately.
Service backtrace shows the sequence of service calls from an individual request all the way back up to the browser click that initially triggered the sequence.
Dig deeper into response time analysis for any and all called and calling services.

Learn more about service flow

See for yourself how Dynatrace simplifies complex service architectures!


A Leader in the 2025 Gartner® Magic Quadrant™ for Observability Platforms
Read the complimentary report to see why Gartner positioned us highest for Ability to Execute in the latest Magic Quadrant.
This graphic was published by Gartner, Inc. as part of a larger research document and should be evaluated in the context of the entire document. The Gartner document is available upon request from Dynatrace. Dynatrace was recognized as Compuware from 2010-2014.

