Service backtrace
Automatically analyze service call sequences from back-end performance to front-end impact

Control complex service architectures with ease
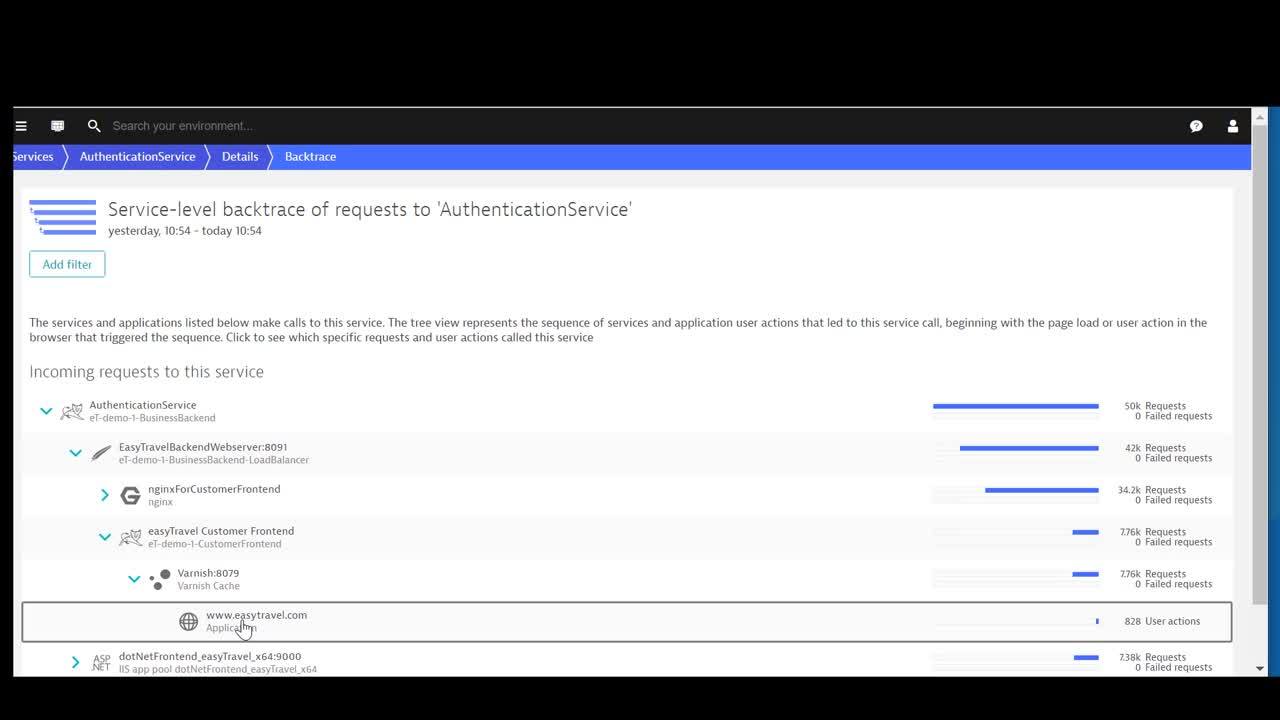
With today's applications comprising complex service call chains, how do you know which click leads to a specific service request? Dynatrace service backtrace shows you not only which services directly call a particular back-end service but also the sequence of preceding service calls leading up to each request—all the way back to the browser click or user action that triggered the sequence in the first place.
- Backtrace any service or service request type—including database statements, 3rd-party services, and HTTP referrers.
- Understand which services are triggered by which applications and user actions.
- See which browser clicks result in specific SQL statements, or which requests write to a specific table.
Analyze the sequence of service calls from the other direction—from an individual application or user action all the way though the entire service call chain—with service flow.


PurePath® provides us with objective, rational, intuitive and easy-to-use results. There’s never a question about what happened or why.
Understand how specific requests or database statements impact customers
Not all service request failures are created equal. Service backtrace lets you know whether (and how) failed requests impact your other services and your customers.
- Identify how and where 3rd-party service failures affect the user experience of your applications.
- See the impact of a slowdown or error with a specific SQL statement.
- Know when an issue isn't affecting customers—so you can focus on problems that matter!


Code-level insights and failure analysis—end to end—at your fingertips
Eliminate the time-consuming struggle of looking for a needle in a haystack. Service backtrace pinpoints where service calls originate in your code. The stacktrace of calls gives you method details within the context of a specific call chain.
Stop hunting down problems and start fixing them. Service backtrace lets you know the reasons for failed requests. With just one click, you understand which requests fail and the Dynatrace artificial intelligence engine determines the underlying root causes and errors.

Try it free


A Leader in the 2025 Gartner® Magic Quadrant™ for Observability Platforms
Read the complimentary report to see why Gartner positioned us highest for Ability to Execute in the latest Magic Quadrant.
This graphic was published by Gartner, Inc. as part of a larger research document and should be evaluated in the context of the entire document. The Gartner document is available upon request from Dynatrace. Dynatrace was recognized as Compuware from 2010-2014.


