Database Monitoring
Accelerate insights with AI-driven database observability. Monitor fleets, prevent issues, and resolve incidents in real time.


Cut through data complexity and noise
Take your database monitoring to the next level with AI-native, proactive observability that gets you unparalleled insights, prevents costly outages, and optimizes performance across your entire dynamic database estate.
Manage database performance
Gain complete visibility and ensure smooth operations by:
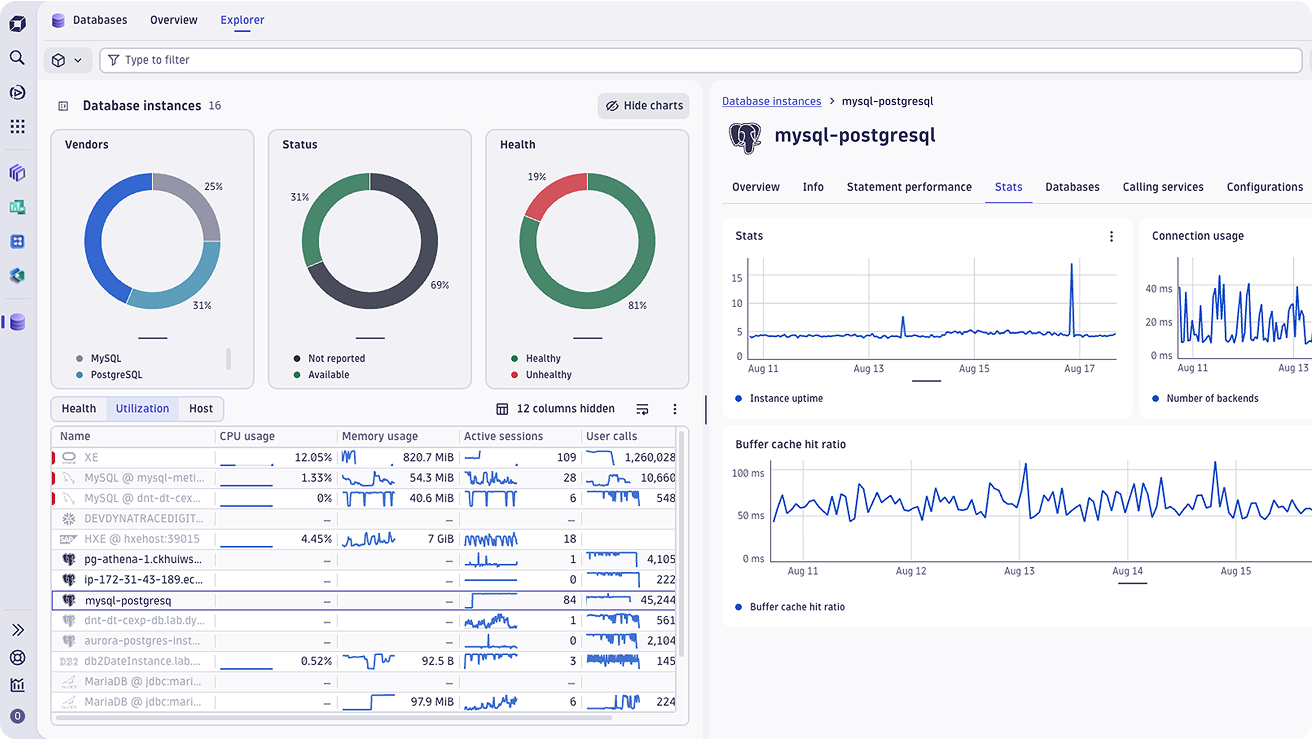
- Gaining deep insights into database operational health by monitoring CPU, memory, I/O, and query times in real-time to ensure optimal performance.
- Pinpointing and resolving resource contention issues such as locks, deadlocks, and blocking sessions that impact database responsiveness.
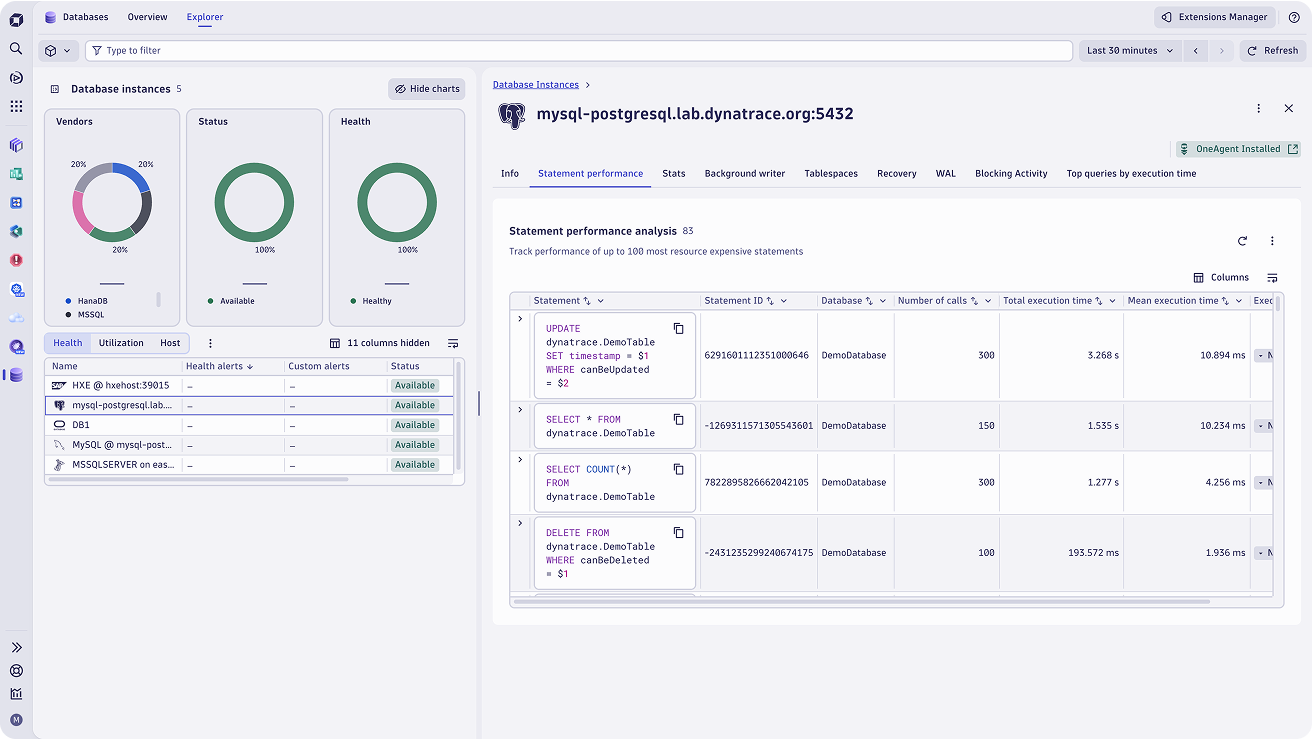
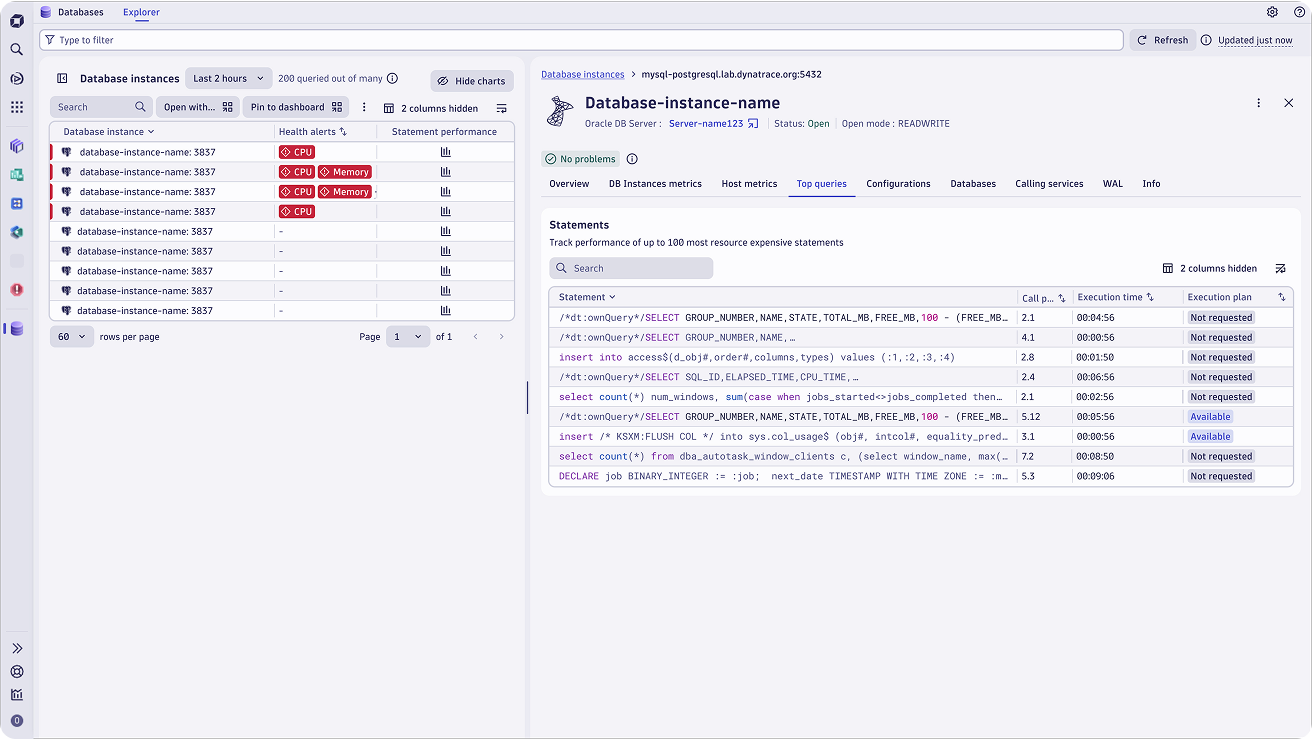
- Identify slow-running queries, inefficient query plans, and resource-intensive statements with detailed query profiling and execution plan visualization.
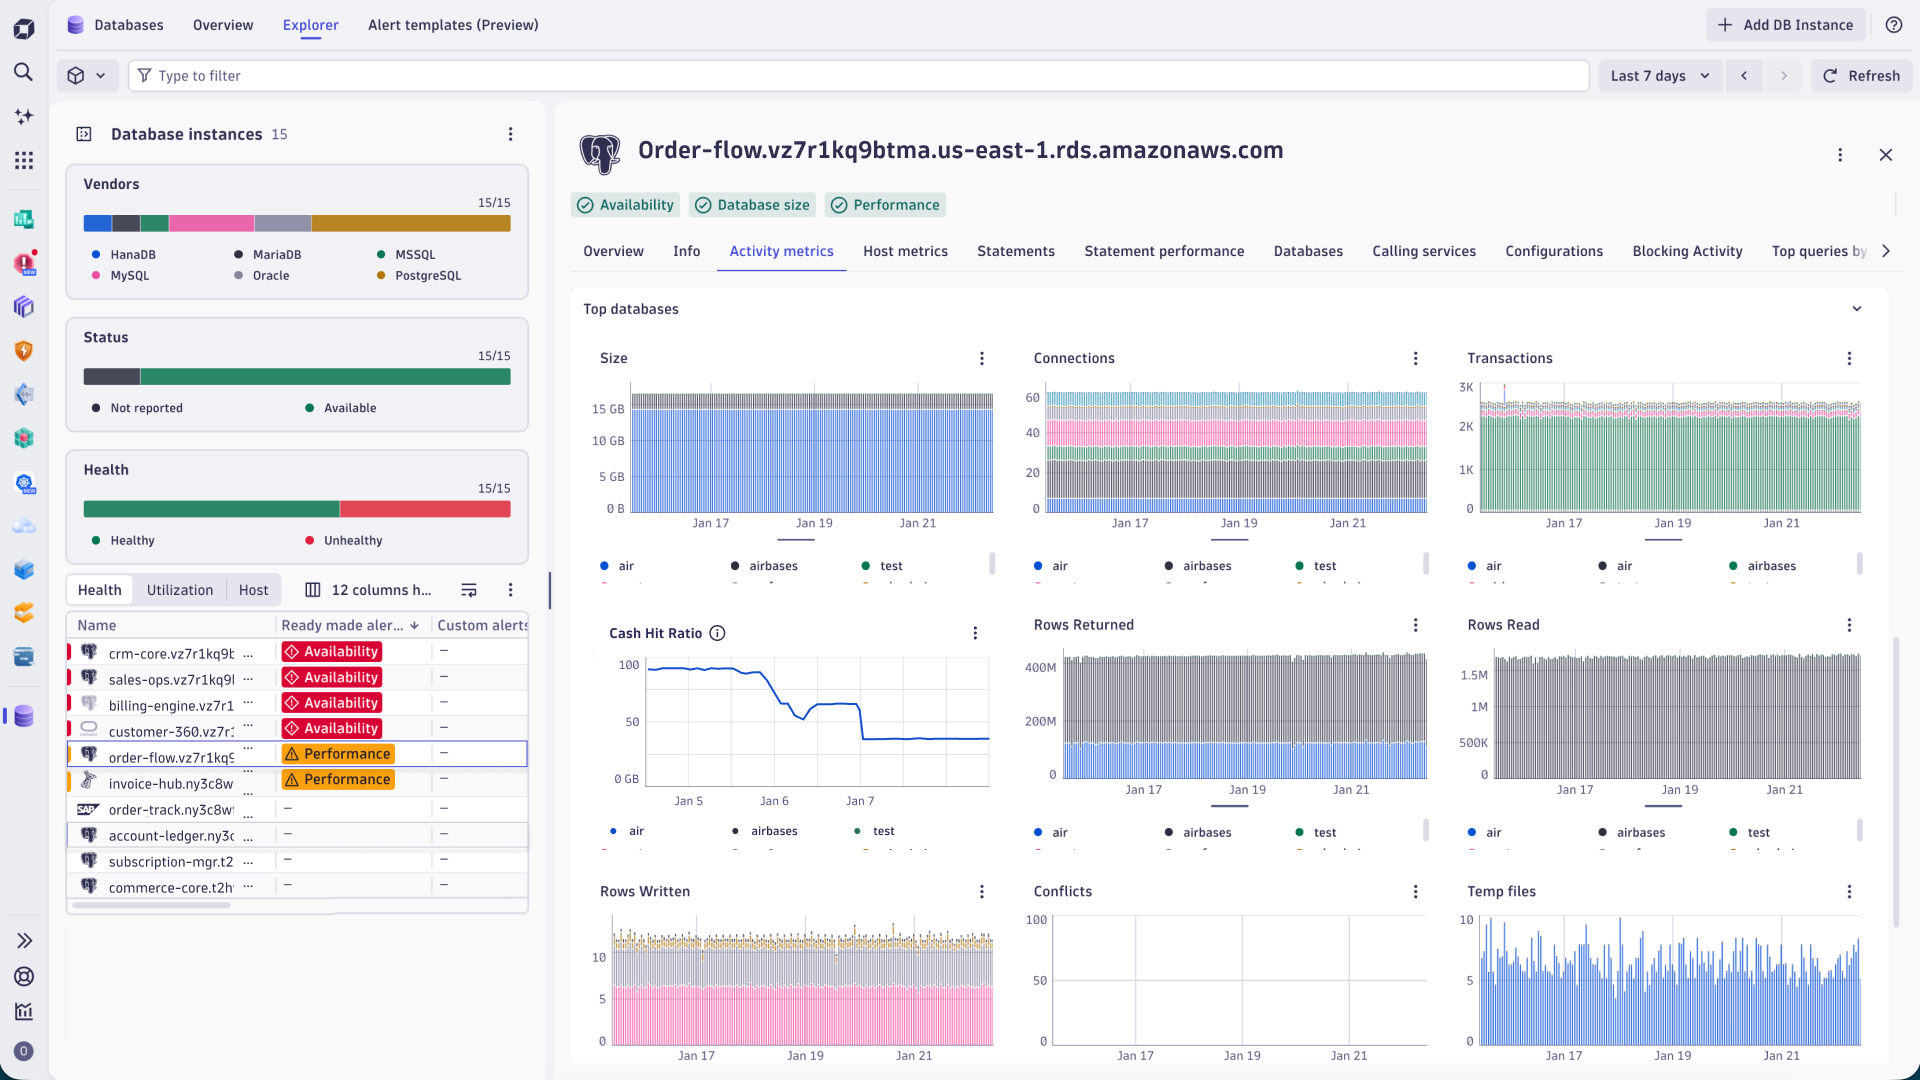
- Understanding your database workload patterns, peak times, and the impact of different applications on overall performance to optimize resource allocation.
Proactively and easily troubleshoot your databases
Move beyond reactive problem-solving to anticipate and address database issues before they escalate by:
- Identifying early warning signs to forecast potential failures or performance degradation.
- Leveraging correlated metrics, logs, and traces to precisely pinpoint the root cause of the issue quickly.
- Quickly move from detection to diagnosis with drill-downs, historical data, and logs in one unified platform.
Deliver seamless customer experiences
Ensure your database performance directly supports fast, reliable, and satisfying digital experiences by:
- Correlating database metrics with application-level performance data to better optimize user experience.
- Tracking SLOs to ensure consistent availability and responsiveness.
- Reducing incidents by preventing database issues before they affect users or disrupt service.
- Ensuring faster feature deployment and innovation with reliable database operations and quick issue resolution.