
Observability for Developers
Find root cause faster with real-time, code-level insight across the SDLC from development through testing and into production
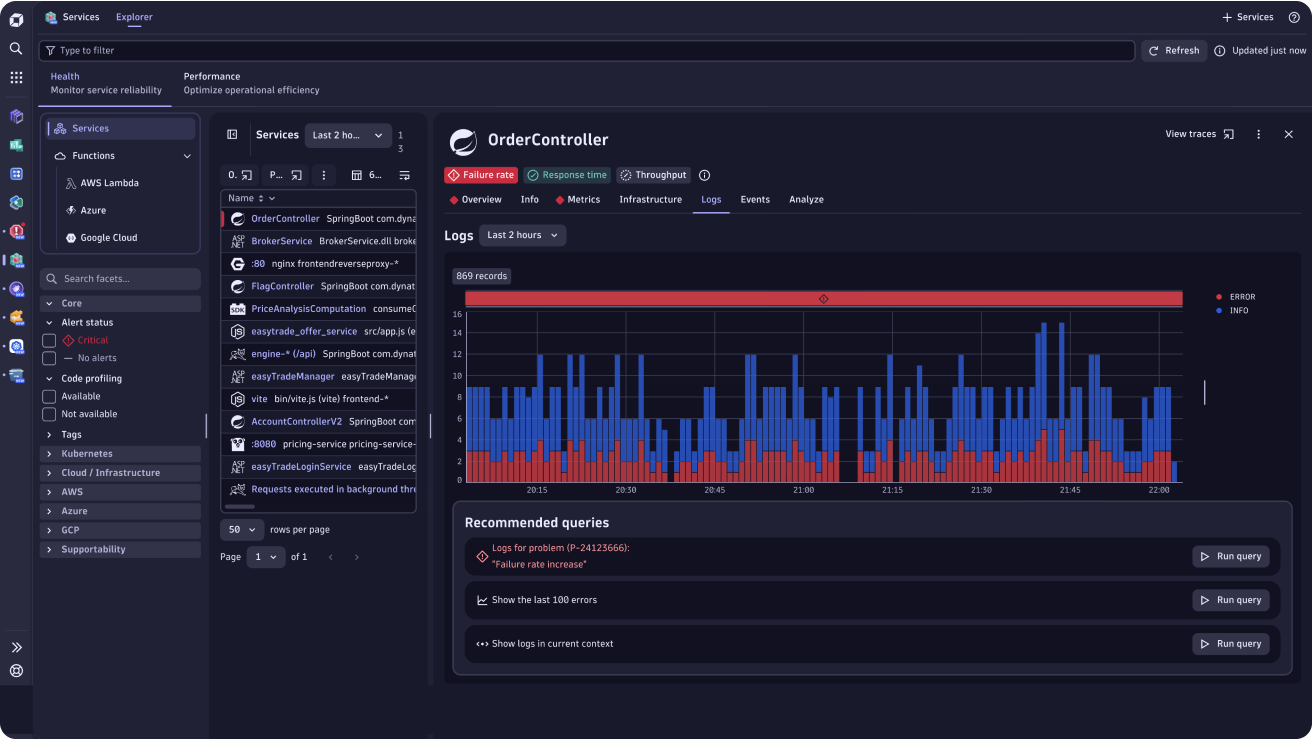
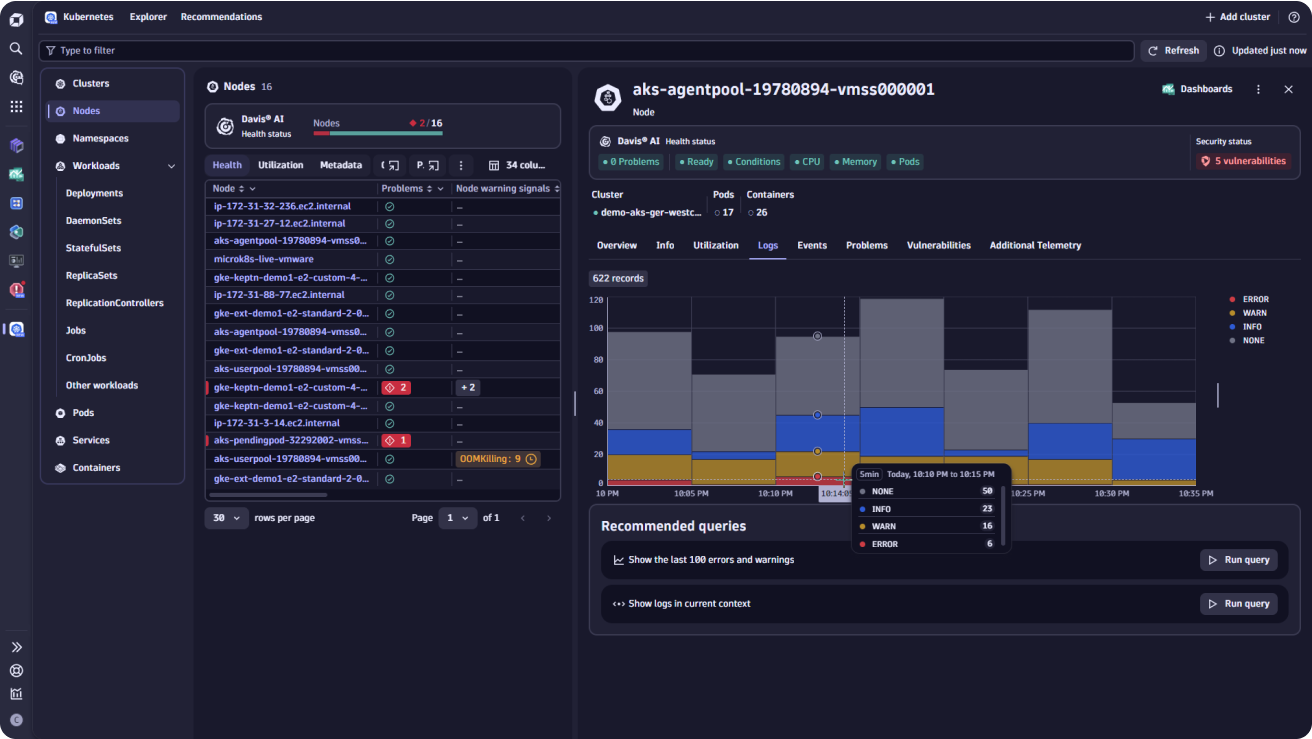
Accelerate troubleshooting with scalable, context-rich log analytics
Search, filter, and visualize logs in context from applications and infrastructure including cloud services, Kubernetes, and hosts.
- Automatically correlate logs, traces, metrics, and events with Dynatrace Intelligence
- Granular record and field level permissions for best-in-class security and compliance Ingest, process, and analyze at any scale at a fraction of the cost
- Ingest, process, and analyze at any scale at a fraction of the cost
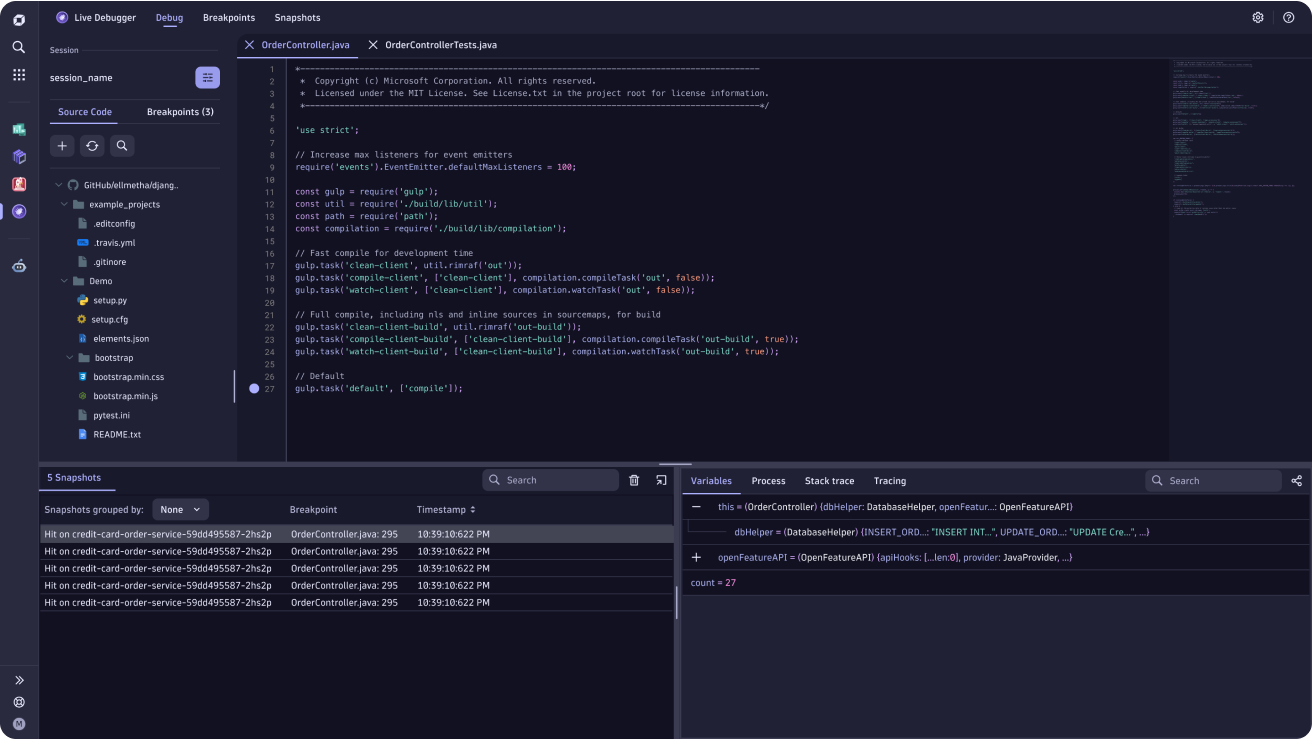
Debug in real-time safely with Live Debugger
- Instantly capture full-stack debug data from any line of code directly from both your IDE or a web-based interface
Access real-time application state to resolve the unknowns in development, through testing, and into production
- Easily debug your cloud-native and AI-native applications, including open source and third party
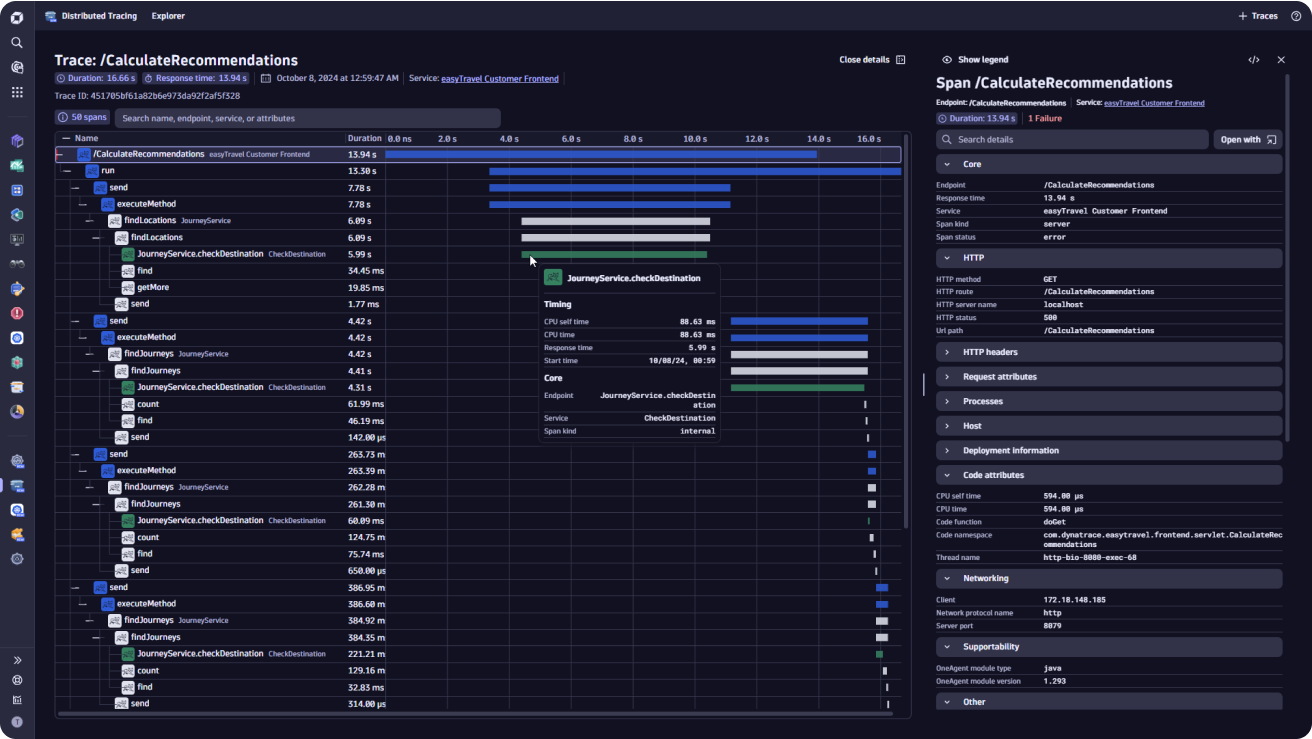
- Get a holistic view of your application with integrated snapshots, logs, and traces
Customize and extend observability across your software development workflows
Query and analyze all observability data including logs, metrics, and traces with topology to answer complex development and delivery questions
Turn real-time signals into actionable feedback with precise alerts and built-in root cause analysis powered by Dynatrace Intelligence
Continuously observe code, services, and runtime dependencies without manual instrumentation, from dev through production
Apply observability-driven release control to validate changes, gate rollouts, and reduce risk
Build automated workflows to integrate directly into IDEs, MCP Servers, pipelines, tools, and issue trackers
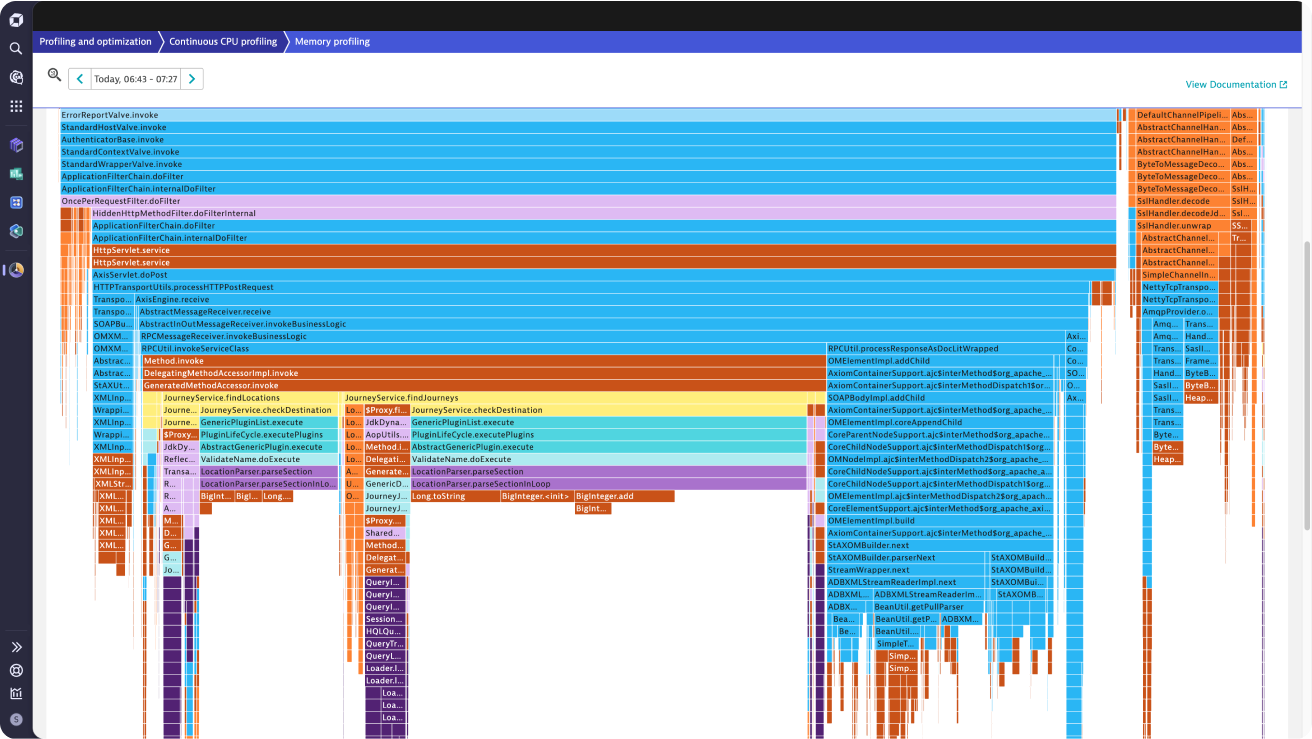
Analyze performance across all workloads with minimal overhead
Enable Always-on profiling across development, test, and production environments
- Granular memory allocations and continuous memory profiling
- Dynamic measuring of code execution time
- Continuous thread analysis for optimizing scalability
- Memory dumps that trigger remotely for in-depth analysis
Supercharge AI-assisted delivery with Dynatrace Intelligence
Deliver real-time, code-level observability into developer tools and IDEs to validate changes before, during, and after release
Equip AI agents with correlated runtime insight across environments to guide progressive rollouts while reducing noise and cognitive load
Enable faster, safer delivery decisions by enriching AI workflows with unified logs, traces, metrics, execution context, and feature-level signals
Seamlessly integrate with any workflow and tech stack


Developer stories

“Dynatrace has been revolutionary for Photobox, as our teams are now able to do work that previously would have taken hours in just minutes.”
Improved performance
Identify and resolve issues up to 80% faster
Better peak sales
Reduce service impacting critical incidents by 60%
"When the system went live, it felt like we had a thousand log analysts helping us understand where to focus efforts to improve our services.”
Optimized experiences
Digital incidents and outage times reduced by 50%
Better outcomes
AI insights reveal how UX impacts conversions

Get a free trial
