

A hands-on guide to Dynatrace Smartscape on Grail for SREs — impact radius, ownership, and incident scope in three DQL queries.
Dynatrace Smartscape on Grail models your entire Kubernetes environment as a typed, traversable graph — a foundation for both reactive incident response and the preventive, autonomous operations workflows that follow. This blog covers what you can do with it right now on your next on-call shift.
We’ll start with how to use Smartscape on Grail during an active incident in Part 1, then, in Part 2, we’ll explore how to use the same topology data to reduce the risk of incidents occurring in first place. You’ll walk away with a collection of queries you can use in your own work.
PART 1 — Follow the red: From alert to resolution
It’s 2 am. PagerDuty fires. A node is unhealthy — maybe it went NotReady, maybe you’re about to drain it for a maintenance window. Either way, you need to answer three questions before you touch anything:
- What breaks if this node goes away?
- Who do I wake up?
- What do I put in the incident ticket?
If your current process involves kubectl get pods -o wide, cross-referencing with kubectl get svc, opening the classic Dynatrace UI in a third tab, and silently hoping the entity relationships haven’t drifted since someone last touched the namespace config, you’re not alone. That workflow works, but fortunately it’s getting easier.
The problem isn’t the number of tabs. It’s that the answers to those three questions are scattered across systems that don’t share a data model. Kubernetes knows about pods and nodes. Your observability tool knows about services. Your Confluence page (if it exists; if it’s current) knows about team ownership. Stitching them together at 2am, under pressure, is where mistakes happen, the wrong thing gets restarted, and where incident timelines may increase significantly.
That’s a data model problem at heart, complicated workflows are just a symptom.
Dynatrace Smartscape on Grail gives you the shared data model those tools are missing: every Kubernetes entity in a single typed graph, queryable in seconds. Here’s what that looks like in practice.
What changed with Smartscape on Grail
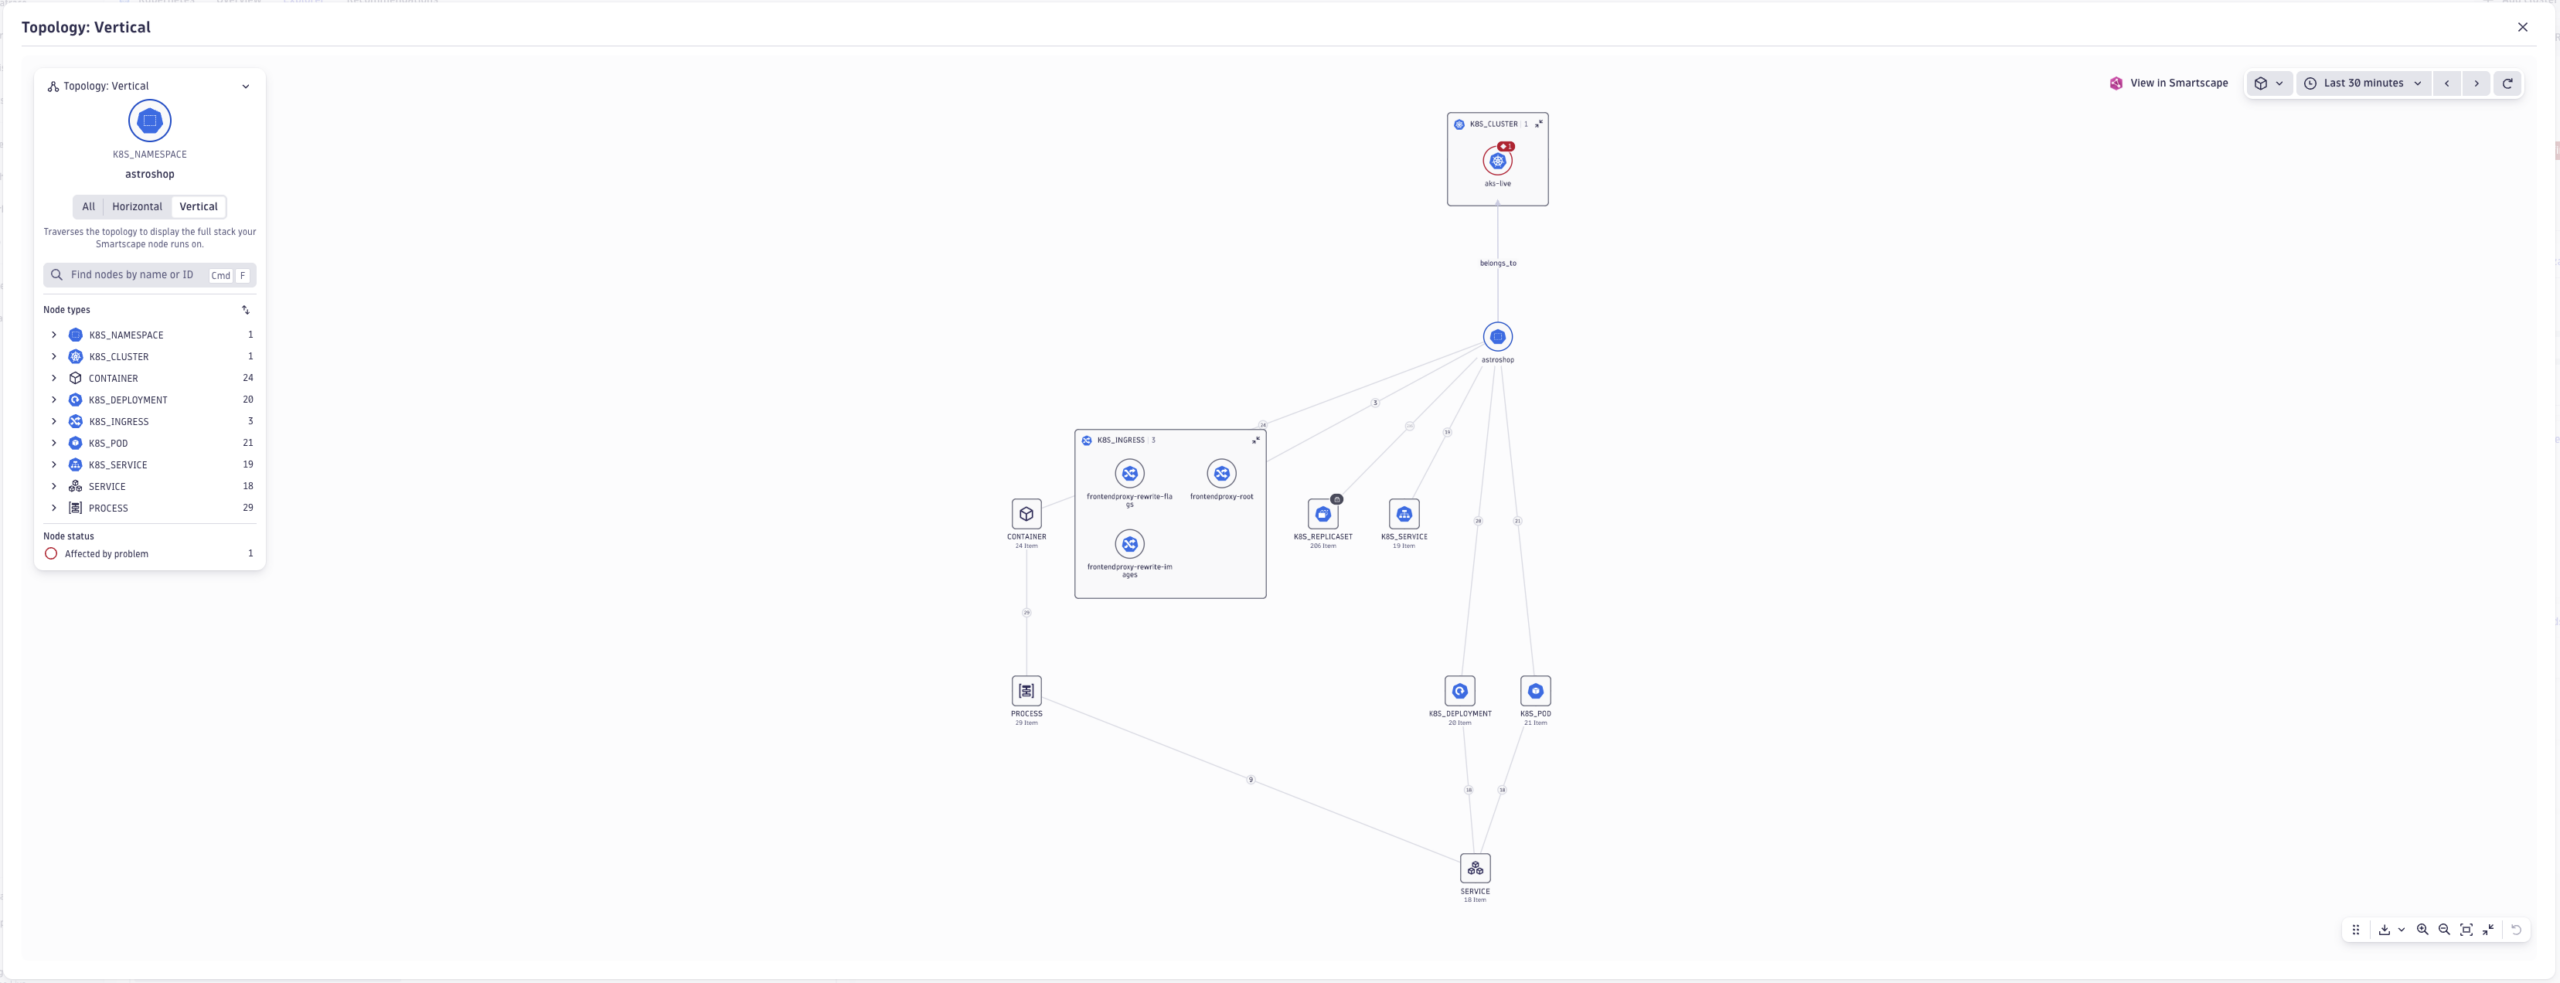
Smartscape on Grail stores every Kubernetes entity — cluster, node, namespace, workload, pod, service, secret — as a node in a typed graph. Relationships between them are first-class edges with explicit semantics:
| Edge | Meaning |
`runs_on` |
Pod is scheduled on this node |
`routes_to` |
Service routes traffic to this workload |
`belongs_to` |
Namespace membership |
`is_part_of` |
Controller hierarchy (pod → ReplicaSet → Deployment) |
`uses` |
Config/storage dependency (pod → Secret, ConfigMap) |
You query this graph using the smartscapeNodes Dynatrace Querly Language (DQL) command — start from any node type, filter by name or property, then traverse across edges. Multi-hop. At scale. In one query, not five.
Query 1 — Blast radius: Which services are at risk?
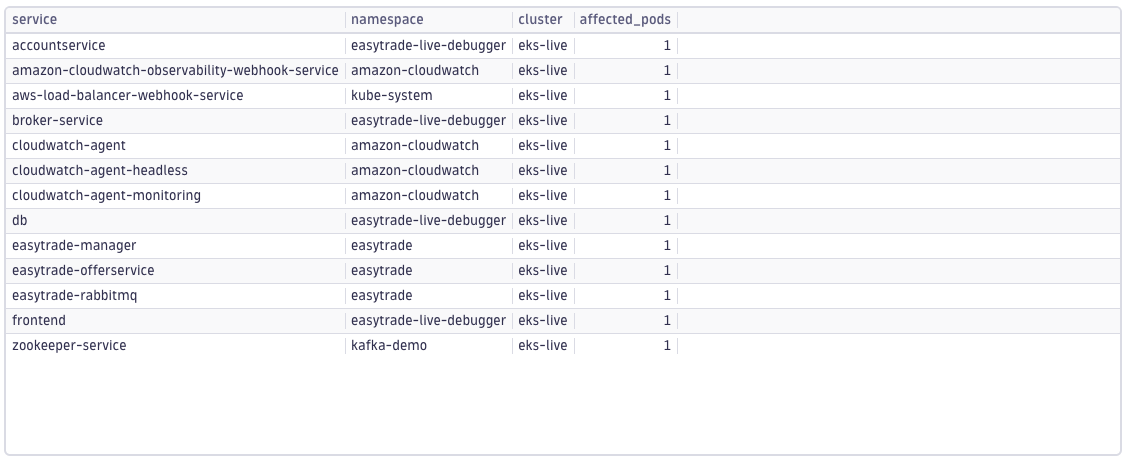
This query walks two hops through the topology — Node → Pods running on it → Services routing to those pods — to surface every service that could be affected if that node goes down.
smartscapeNodes "*"
| filter type == "K8S_NODE"
| filter name == "<your-node-name>"
| traverse runs_on, K8S_POD, direction: backward,
    fieldsKeep: {name, `k8s.namespace.name`, `k8s.cluster.name`}
| traverse routes_to, K8S_SERVICE, direction: backward,
    fieldsKeep: {name}
| fieldsAdd pod_name = dt.traverse.history[1][name]
| summarize affected_pods = countDistinctExact(pod_name),
    by: {service = name, namespace = `k8s.namespace.name`, cluster = `k8s.cluster.name`}
| sort affected_pods desc
Output: every Kubernetes service that will lose pod capacity if this node goes away, ranked by how many pods they’re losing. The direction: backward on runs_on means you’re traversing against the edge direction — pods run on nodes, so you traverse backward from node to pods. Same for routes_to: services route to pods, so backward gives you the services for a given pod.
Before Smartscape on Grail, there was no queryable node to service path. You had to infer it manually, namespace by namespace. That path now takes one query. Run it before you drain.
If the output shows a handful of internal pods routing to non-critical services, you can proceed quietly. If it shows customer-facing services losing half their pods, you wake people up. Either way, you know before you touch anything.
Query 2 — Who do I page?
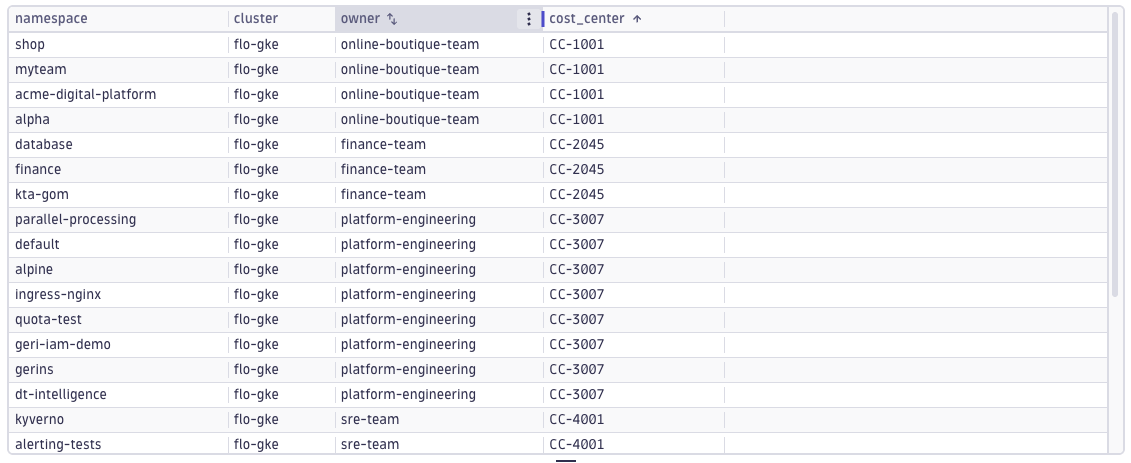
Your team annotates namespaces with owner and dt.cost.costcenter. Smartscape surfaces these as first-class fields. One query returns the team and cost center for every namespace in the cluster — no Confluence skimming, no institutional memory required.
smartscapeNodes "*"
| filter type == "K8S_NAMESPACE"
| fields namespace   = name,
         cluster     = `k8s.cluster.name`,
         owner       =  tags[owner],
         cost_center = `dt.cost.costcenter`
| sort cluster asc, namespace asc
Cross this with the affected namespaces from Query 1 to get your page list. If owner is empty across the board, that’s a signal too: your namespace annotation coverage is a gap worth closing before the next incident.
Query 3 — What’s the incident scope?
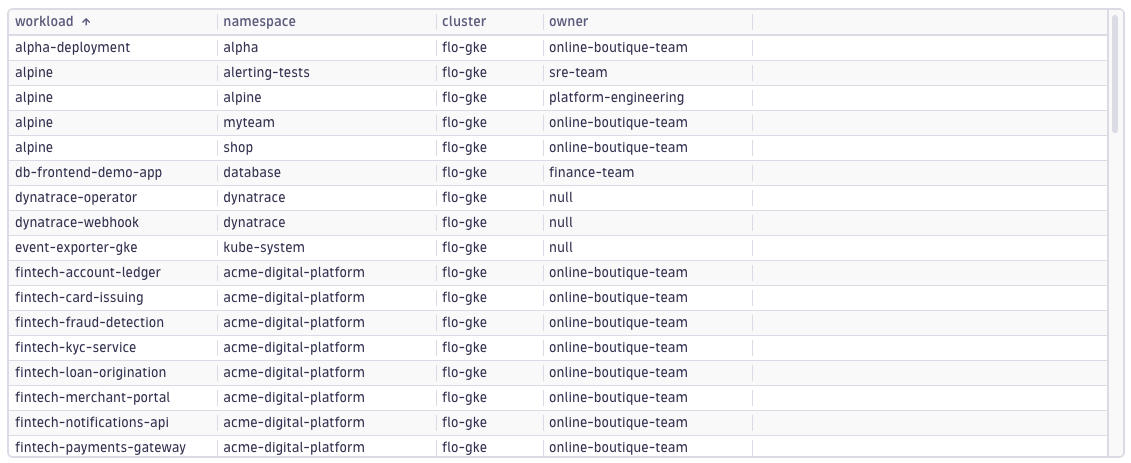
Dynatrace Intelligence fired a Problem on a cluster. You need the structured context for the incident ticket: every workload across every namespace in the affected cluster. Filter to the namespace(s) Dynatrace Intelligence flagged to narrow it further.
smartscapeNodes "*"
| filter type == "K8S_DEPLOYMENT"
| filter `k8s.cluster.name` == "<affected-cluster>"
| fields workload  = name,
         namespace = `k8s.namespace.name`,
         cluster   = `k8s.cluster.name`,
         owner     = tags[owner]
| sort namespace asc, workload asc
This gives you the complete workload inventory for the incident ticket with ownership inline. Paste it into the ticket, assign the right teams, and close the loop.
The payoff
Three queries can provide a consolidated view of relevant topology data in minutes (depending on environment and query performance). Manually assembled, the same information would take a practiced SRE 15–20 minutes across kubectl, a browser UI, a spreadsheet, and a Slack message to the right person. At 2am, those extra minutes can mean the difference between a contained issue and a wider outage.
Less manual correlation can help teams reduce resolution time and coordination overhead in many scenarios.
PART 2 — The queries you run before something breaks
Incident response is just one use case. The graph is useful every day — before you rotate a secret, before you resize a cluster, when you need to know what changed overnight, or when your CMDB team asks why their automation keeps going stale. Detailed below are the rest of Smartscape on Grail’s capabilities, grouped by what you’re trying to accomplish.
Preparing for a change
Secret rotation blast radius
Secret rotation is one of those tasks that feels low-risk—until it isn’t. When a Secret is used by pods across multiple teams, rotating it without a dependency check can break workloads owned by people who weren’t part of the change review.
Before you rotate, run this to see which pods and services depend on the Secret, ranked by potential blast radius:
smartscapeNodes "*"
| filter type == "K8S_SECRET"
| traverse uses, K8S_POD, direction: backward,
    fieldsKeep: {name, `k8s.namespace.name`, `k8s.cluster.name`}
| fieldsAdd pod_name = name
| traverse routes_to, K8S_SERVICE, direction: backward,
    fieldsKeep: {name}
| fieldsAdd service_name = dt.traverse.history[1][name]
| summarize
    dependent_pods    = countDistinctExact(pod_name),
    affected_services = countDistinctExact(service_name),
    by: {secret = dt.traverse.history[0][name], cluster = `k8s.cluster.name`}
| sort dependent_pods desc
Run this before the change window, not during it.
Single points of failure
Pod count per deployment sounds like a mundane metric — until you drain a node and realize that it was the only one running three different critical services. This query finds every deployment with only one running pod across your clusters. Run it before any planned maintenance or resize. Better yet, run it as a weekly habit, regardless of any special action.
smartscapeNodes "*"
| filter type == "K8S_DEPLOYMENT"
| traverse is_part_of, K8S_POD, direction: backward,
    fieldsKeep: {name, `k8s.namespace.name`, `k8s.cluster.name`}
| summarize pod_count = count(),
    by: {deployment = dt.traverse.history[0][name],
         namespace  = `k8s.namespace.name`,
         cluster    = `k8s.cluster.name`}
| filter pod_count == 1
| sort cluster asc, namespace asc
If the list is short, you’re in good shape. If it’s long, you have your sprint backlog — and a conversation to have with your teams about replica counts before the next maintenance window, not during it. Fixing a single-replica deployment takes minutes. But if you only discover it mid-drain, you could be in for a stressful day.
Know what’s running
Full cluster inventory
See object counts per type per cluster by running this “state of the cluster right now” query. It can be useful after an incident, before a resize, or as a daily sanity check.
smartscapeNodes "*"
| filter type == "K8S_NODE"
    OR type == "K8S_NAMESPACE"
    OR type == "K8S_DEPLOYMENT"
    OR type == "K8S_POD"
| summarize count = count(), by: {cluster = `k8s.cluster.name`, type}
| sort cluster asc, type asc
The full YAML spec of any Kubernetes object is also stored and queryable — labels, annotations, resource requests, image versions —all without a separate API call.
Here’s a YAML parsing example: Kubernetes doesn’t enforce CPU limits by default. Pods without one can consume all available CPU on a node — the textbook noisy-neighbor scenario. This query surfaces every pod across your clusters alongside its CPU limit, or the absence of one. Nulls at the top are the ones to talk to your teams about.
smartscapeNodes "*"
| filter type == "K8S_POD"
| parse k8s.object, "JSON:k8s.object"
| fieldsAdd cpu_limit = k8s.object[spec][containers][0][resources][limits][cpu]
| fields pod       = name,
         cluster   = `k8s.cluster.name`,
         namespace = `k8s.namespace.name`,
         cpu_limit
| sort cpu_limit asc, cluster asc, namespace asc
Track drift
Topology drift — what has changed since yesterday?
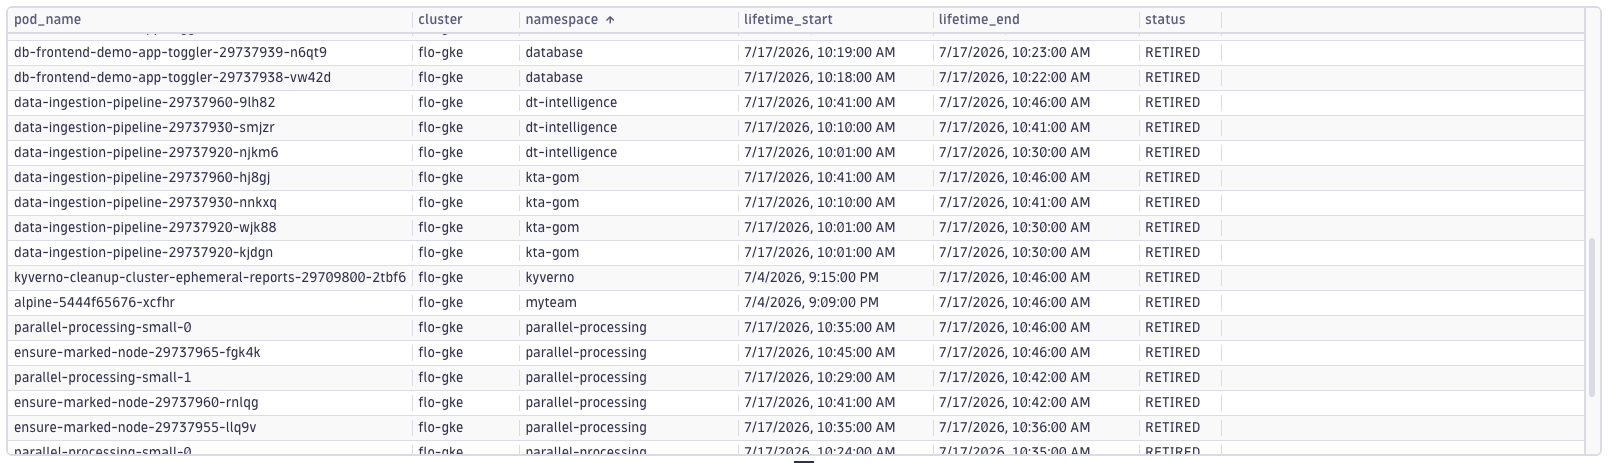
Metrics tell you something went wrong. Topology drift tells you what changed before the metrics moved. Every entity in Smartscape carries a lifetime field: a timeframe encoding when it first appeared and when it last reported. Use it to surface pods that retired recently — outside of expected deploy windows, or without a matching rollout.
smartscapeNodes "*"
| filter type == "K8S_POD"
| fieldsAdd lifetime_start = lifetime[start]
| fieldsAdd lifetime_end   = lifetime[end]
| fieldsAdd status = if(lifetime_end > now()-5m, "ACTIVE", else: "RETIRED")
| filter status == "RETIRED" AND lifetime_end > now()-1d
| fields pod_name  = name,
         cluster   = `k8s.cluster.name`,
         namespace = `k8s.namespace.name`,
         lifetime_start,
         lifetime_end ,
         status
| sort lifetime_end desc
This is especially useful in clusters with active CI pipelines, where the noise floor of expected churn makes anomalies easy to miss.
Connect your toolchain
CMDB and configuration management
Keeping a CMDB current in a dynamic Kubernetes environment is a problem most teams quietly give up on. Pods come and go. Services get renamed. Namespaces get restructured after a reorg. By the time anyone updates the record, it’s already wrong — and everyone knows it.
The reason CMDB automation usually fails on Kubernetes is the same reason the 2am queries in Part 1 used to fail: a lack of a shared data model. Smartscape gives you one. Smartscape’s graph relationships can be translated into the relationship types a CMDB already understands—for example, runs_on can indicate where a pod is hosted, and uses can show that one object depends on another.
The lifetime field tells your automation exactly when to create, update, or retire a CI record. Whether you’re feeding ServiceNow, an internal CMDB, or a homegrown asset tracker, the graph provides a consistent and centralized data model.
In practice, this means you can:
- See what’s affected before you act, without stitching together kubectl output by hand.
- Use namespace annotations to identify ownership instead of relying on stale docs.
- Check common pre-change risks, like Secrets with broad dependency chains or deployments with only one running pod.
- Feed the same topology data into CMDB or asset-management workflows, so records stay closer to what’s actually running.
What’s next
Every query in this post represents a question that used to require four tools and institutional knowledge. Now it’s a single DQL statement against a graph that already knows your entire cluster topology. That shift — from manual correlation to queryable structure — is what makes the next step possible.
What’s coming next is already in motion: tighter Smartscape references in alerts and problems, standardized drilldowns across observability domains, and expanded K8s troubleshooting workflow built on the same graph. Further out, the topology data that helps you answer “what breaks?” today can support future automated remediation workflows.
Try it yourself
All of the queries above run in Dynatrace Notebooks. If you have a Dynatrace environment with Kubernetes monitoring enabled, open a Notebook, paste any query, and swap in your own node name or cluster. The Smartscape on Grail documentation covers the full entity type reference and edge semantics.


Looking for answers?
Start a new discussion or ask for help in our Q&A forum.
Go to forum