
Dynatrace OneAgent is a tremendously powerful tool for automatically collecting all important technology metrics and transactions within your environment. There are however certain situations where it’s not possible to install OneAgent directly on hosts (for example, 3rd party cloud platforms such as CloudDBs) or hardware appliances, such as routers, firewalls or data powers. Additionally, you may sometimes want to automatically send important metrics to custom network devices in your environment. In the latest Dynatrace release, we’ve enhanced our Dynatrace REST API to allow you to define custom monitored network devices and send custom metrics directly to custom network devices.
Register custom devices in Smartscape
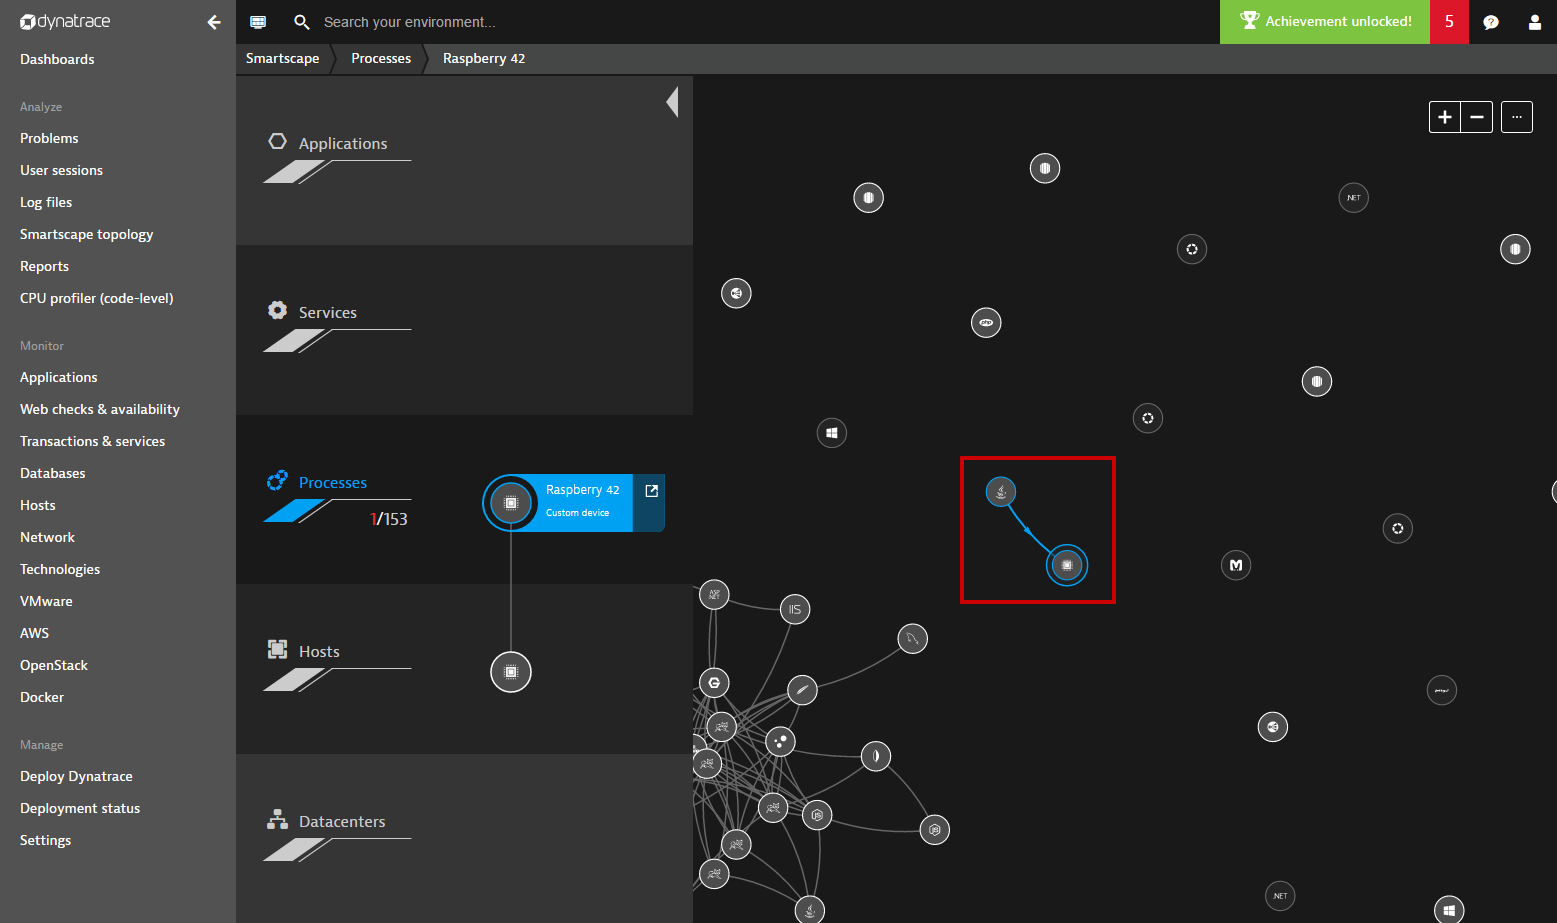
Dynatrace intelligent problem detection depends on a well-structured topological model of your monitored environment. This topological model is updated in real time by installations of OneAgent that you deploy in your environment. By letting Dynatrace know about the IP addresses and ports of any custom network devices, Dynatrace Artificial intelligence can automatically map and position your custom device within our Smartscape topology (see Smartscape example below).
Register custom metrics
The Dynatrace API enables you to register new custom metrics by sending HTTP PUT requests to the timeseries REST endpoint, as shown in the example below:
https://.live.dynatrace.com/api/v1/timeseries/custom:raspberry.cpu.temperature/?Api-Token=
{
"displayName" : "CPU temperature",
"unit" : "Count",
"dimensions": [
"cpu"
],
"types": [
"Raspberry"
]
}
The payload contains the display name, unit, and dimension key of the new metric. It’s important that the defined metric type be identical to the component type you’re sending the metric to. For example, if you define a custom entity of type Raspberry, you must also register all custom metrics for type Raspberry.
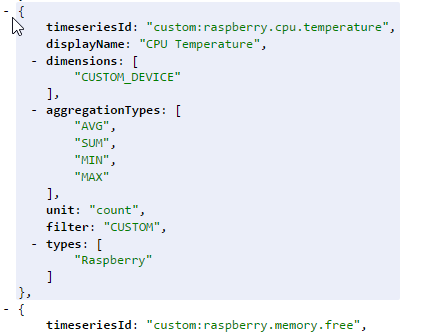
To confirm that a metric has been successfully registered, open the timeseries endpoint in your browser. Here you’ll see all the registered and exported timeseries metrics in your environment (see example below).
Send data points to a custom device
Once you’ve successfully registered a new metric in your environment, you can begin sending the data points to a custom defined network device.
You don’t need to register new custom devices, just use a unique ID within the URL and start sending meta information about the device and its metrics in regular intervals. It’s not necessary to send the meta info about a device with each data update. Dynatrace keeps all device info until updated info is received. You should send the device info in regular intervals, such as once per day in order to make sure that the network device always shows the most actual information.
Custom metric and network device example
Here is an example of how to create and update a new custom network device along with the metric registered in the example above:
HTTP POST
https://{id}.live.dynatrace.com/api/v1/entity/infrastructure/custom/raspberry42?Api-Token=
with payload:
{
"displayName" : "Raspberry 42",
"ipAddresses" : ["192.168.100.117"],
"listenPorts" : [8080, 8090],
"type" : "Raspberry",
"favicon" : "http://assets.dynatrace.com/global/icons/cpu_processor.png",
"tags": ["user defined tag", "tag2"],
"properties" : { “prop1” : “propvalue” },
"series" : [
{ "timeseriesId" : "custom:test.firewall.droppedconnections",
"dimensions" : { "nic" : "ethernetcard1" },
"dataPoints" : [ [ <timestamp> , <value> ] ]
}
}
]
}
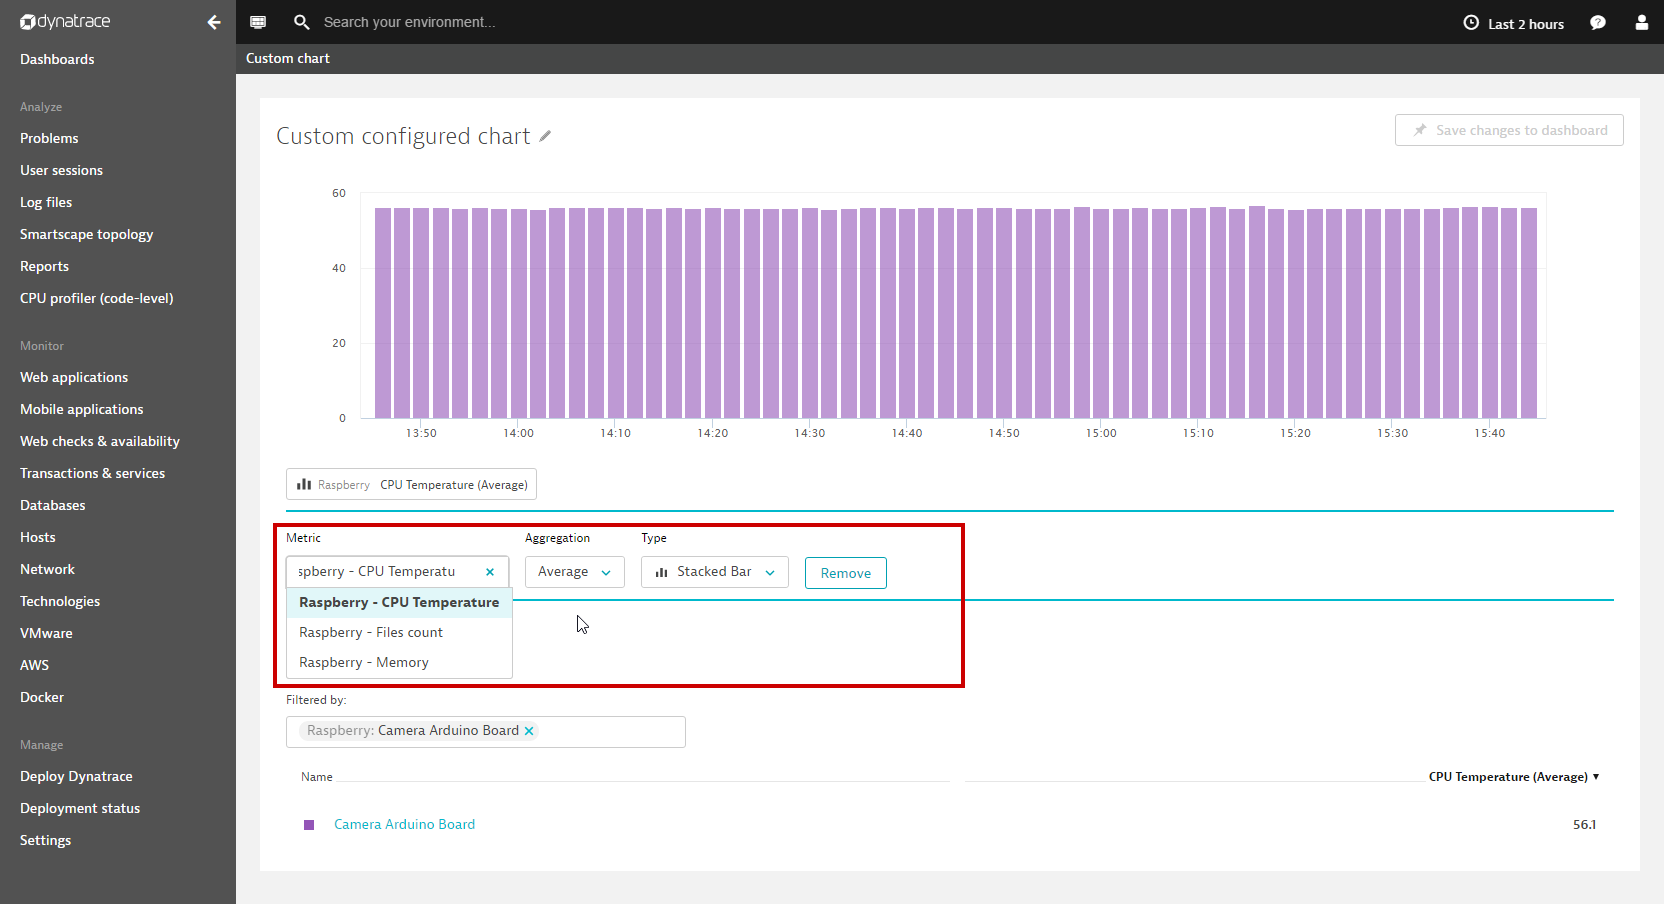
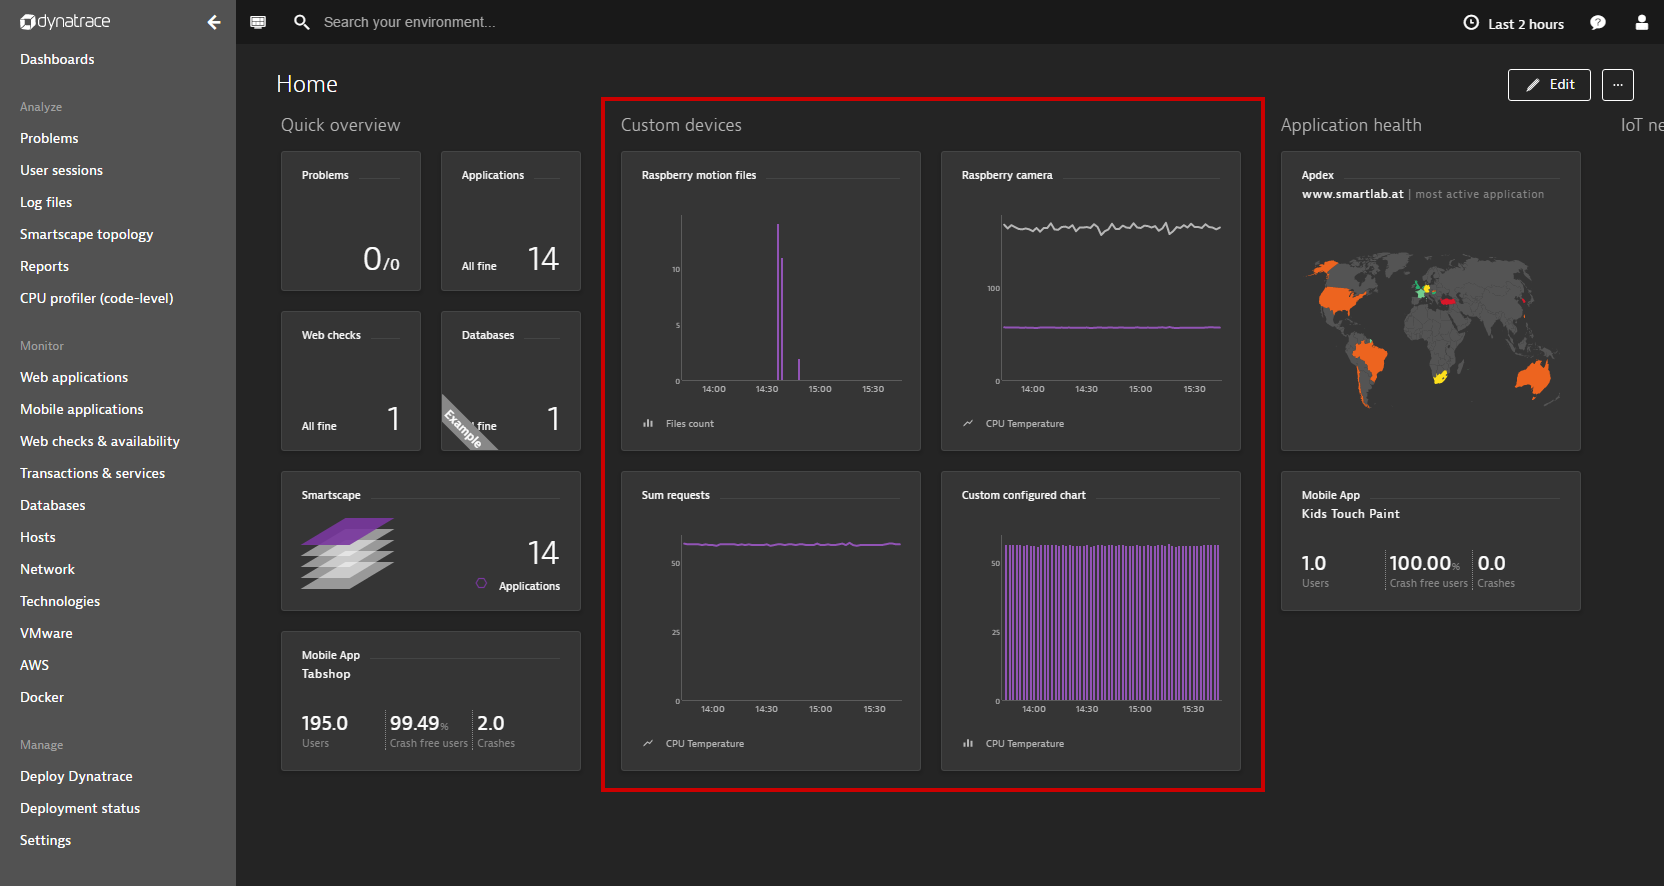
Custom metrics for dashboard tiles
Once you’ve started sending a metric to a custom device, you’ll find the metric available along with any other custom metrics that you’ve defined. Custom metrics can be used to construct custom charts and network-device specific dashboard tiles. For full details, see Can I use filtering to create more sophisticated dashboard charts?
Display in Smartscape
Custom metrics appear automatically in Smartscape on the host and process levels (see below). By providing information about a device’s network IP addresses and port numbers, Dynatrace listens to incoming communication from the device. Dynatrace topology discovery then attempts to automatically discover communication relations with other OneAgent monitored hosts and processes.

Click on a custom network device entry in Smartscape to view a generic entity page that displays all metrics you’ve sent to this custom device, along with any device properties and user tags that were sent via the Dynatrace API.
Ready to get started?
To begin creating your own custom devices and sending metrics into Dynatrace, please see the custom network device and metrics API documentation.
You can also find simple Python examples on Github to help you get started.


Looking for answers?
Start a new discussion or ask for help in our Q&A forum.
Go to forum