

Today, the world is using LLM applications like never before, from the chatbots, assistants, and AI agents you type a question into and get an answer back from. Behind that simple back-and-forth, LLM applications do much of their work out of view, from retrieving context and calling models to generating responses. Spans make those steps visible, not just in AI applications, but across any sort of distributed system.
The previous post in this series introduced that traceable structure using OpenTelemetry. Traces show the path of a request across a distributed system, while spans capture the individual operations that make up that path. Today we’re diving deeper into spans.
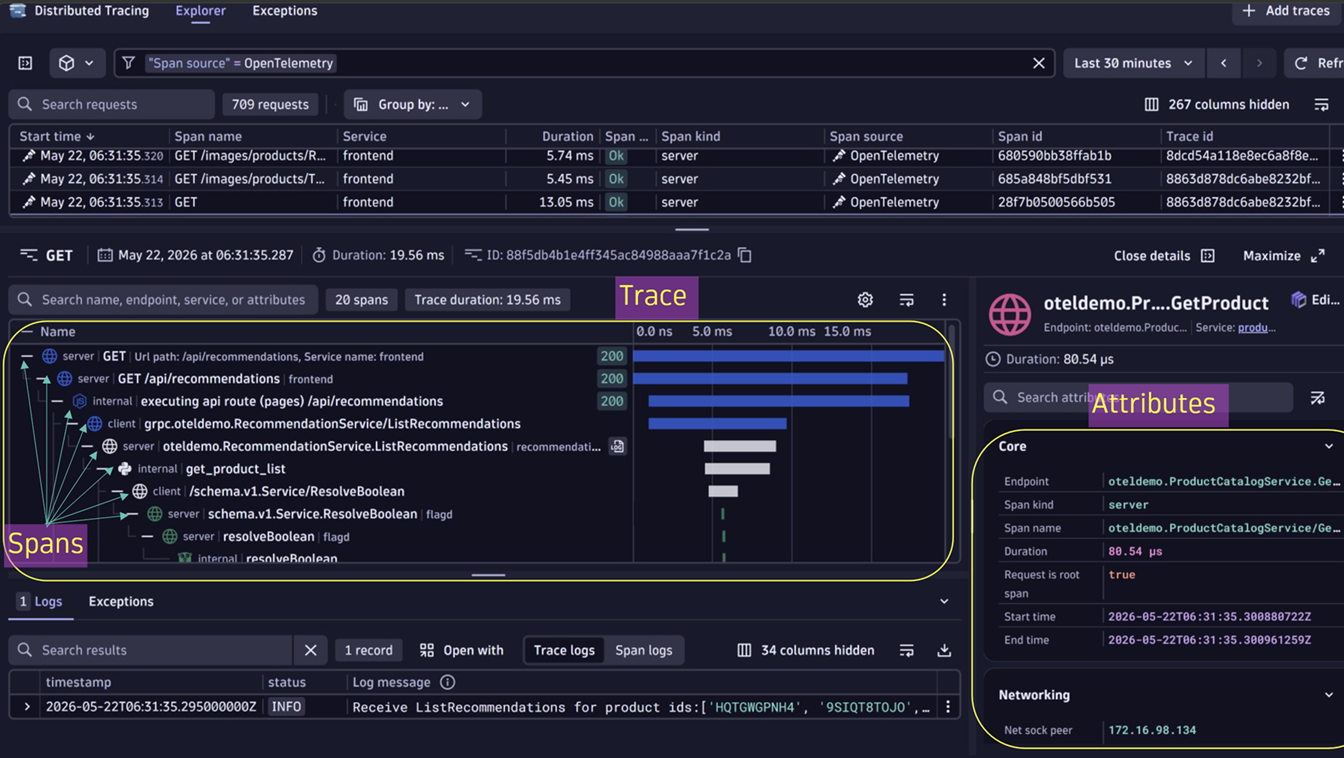
If you look closely at a span, you’ll notice it contains a variety of parameters and attributes. They may seem complex at first, but each serves a specific purpose. In this blog, we’ll break down the anatomy of an OpenTelemetry span so you understand what every field means and why it matters.
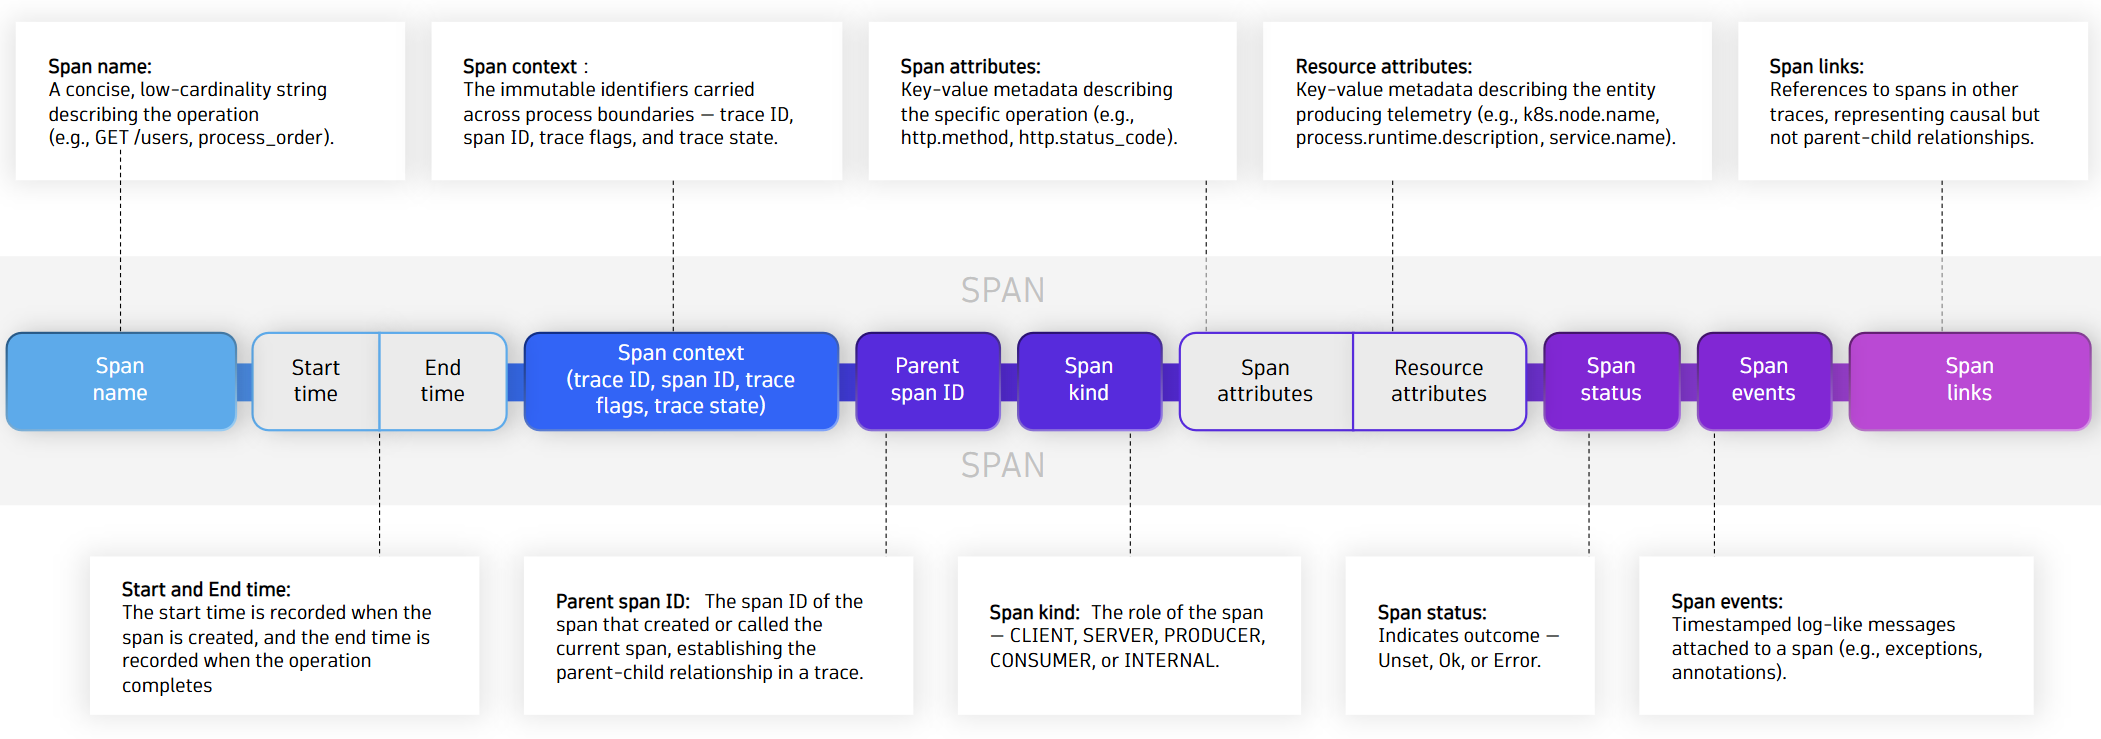
What’s in a span? The building blocks
Every span is a structured record. Whether it’s tracking a single HTTP call, a database query, or a prompt sent to an LLM, a span always carries the same core anatomy. Think of it like a DNA molecule: the same bases, but arranged differently each time to describe something unique. These are:
- Span Context
- Span Name
- Span Kind
- Timespan and Duration
- Span Status
- Attributes
- Span Events
- Span Links
- Resource
- Instrumentation Scope
Let’s walk through each component with real-world examples, using two contexts you’ll encounter constantly in modern systems: classic HTTP microservice calls and LLM-powered AI applications.

1. Span context – The identity card
Span context is the immutable identity of a span, propagated across every service boundary. It has four fields:
| Field | Size | Purpose |
| trace_id | 128-bit (16 bytes hex) | Unique ID for the entire trace, shared by all spans in the same request chain |
| span_id | 64-bit (8 bytes hex) | Unique ID for this span |
| trace_flags | 1 byte | Sampling bitmask; bit 1 set means this trace is being sampled and exported |
| trace_state | Key-value string | Vendor-specific propagation metadata (e.g. Dynatrace dt= routing header)
|
// Span context as it appears in the OTel console exporter
{
  "context": {
    "trace_id":   "0x4bf92f3577b34da6a3ce929d0e0e4736",
    "span_id":    "0x00f067aa0ba902b7",
    "trace_state": "[]"
  },
  "parent_id": "0x9c8d7e6f5a4b3c2d"   // null for a root span
}
2. Span name – The human-readable label
The span name is a short, low-cardinality string describing the operation. It’s the first thing you read in a trace waterfall view. A good span name is generic enough to group similar operations, but specific enough to be meaningful.
Note: Span names should describe the operation class, not the specific instance. Use GET /users/{id} not GET /users/12345. High-cardinality values (IDs, emails) belong in Attributes, not the span name.
Good span names
| Convention | Span Name Example | Reason |
| HTTP | GET /api/v1/users/{user_id} |
Low-cardinality; groups all user fetches |
| HTTP | POST /api/v1/orders |
Describes the operation class, not a specific order |
| GenAI | chat gpt-4o |
OTel GenAI convention: {operation} {model} |
| GenAI | embeddings text-embedding-3-small |
Consistent naming across all embedding calls |
| GenAI | execute_tool search_knowledge_base |
Tool name as operation for agent function calls
|
Span names to avoid
| Convention | Span Name Example | Reason |
| HTTP: avoid | GET /api/v1/users/8f3a21bc |
ID in span name breaks trace grouping |
| HTTP | Query at 2024-05-22 14:30:00 |
Timestamp makes every span unique; unqueryable |
3. Span kind – The role in the system
Span kind defines the role this span plays in the distributed system. It tells observability tools how to interpret the span’s relationships and timing – especially important for correctly drawing service maps and calculating latency breakdowns.
| SpanKind | Call Direction | Communication Style | Use Case Examples |
| CLIENT | Outgoing | Request/Response | HTTP call, DB query, external API |
| SERVER | Incoming | Request/Response | Web handler, API server, GRPC server |
| PRODUCER | Outgoing | Deferred Execution | Kafka publish, job enqueue |
| CONSUMER | Incoming | Deferred Execution | Kafka consume, background job |
| INTERNAL | Local | N/A | Business logic, internal compute |
HTTP example
// Service A — API Gateway (receives the inbound request)
{
  "name": "POST /api/v1/chat",
  "kind": "SpanKind.SERVER"
}

// Service A → Service B (outbound call it makes)
{
  "name": "POST /context-service/retrieve",
  "kind": "SpanKind.CLIENT"
}

// Service B — Context Retrieval Service (receives Service A's call)
{
  "name": "POST /context-service/retrieve",
  "kind": "SpanKind.SERVER"
}
GenAI example
// Agent orchestrator — the enclosing workflow span
{
  "name": "invoke_agent research_assistant",
  "kind": "SpanKind.INTERNAL"
}

// Agent → OpenAI Embeddings API (outbound call to embed the user query)
{
  "name": "embeddings text-embedding-3-small",
  "kind": "SpanKind.CLIENT"
}

// Agent → OpenAI Chat API (outbound LLM call)
{
  "name": "chat gpt-4o",
  "kind": "SpanKind.CLIENT"
}

// Agent runs a locally-defined tool it selected during the loop
{
  "name": "execute_tool search_knowledge_base",
  "kind": "SpanKind.INTERNAL"
}
4. Timestamps and duration – When did it start and end?
Every span records a start timestamp and an end timestamp. These are nanosecond-precision Unix epoch values. The difference gives you the span duration, the single most actionable number in performance observability.
Timing accuracy matters more than you’d think. Clock skew between hosts can cause child spans to appear to start before their parent. Modern OTel SDKs use monotonic clocks where possible to avoid this.
Example
{
  "start_time": "2024-05-22T14:30:00.000Z",
  "end_time":   "2024-05-22T14:30:00.245Z"
  // duration = 245 ms — the latency of this HTTP request
}
5. Span status – Did it succeed?
Span status tells you whether the operation succeeded or failed. There are three values:
| Status | Meaning | Set automatically? | JSON output |
| UNSET | Default status: no outcome was explicitly recorded. This does not by itself mean the operation succeeded. | Yes | {"status_code": "UNSET"} |
| ERROR | Operation failed: exception, timeout, or 5xx response. | Yes (on exception) | {"status_code": "ERROR",
|
| OK | Developer explicitly declared success. Use this when a 404 is intentional. | No (manual only) | {"status_code": "OK"} |
Note: UNSET does not mean OK. It means no outcome was explicitly recorded, so observability platforms like Dynatrace infer health from other signals such as HTTP status codes and exceptions.
6. Attributes – The rich context layer
Attribute values can be strings, booleans, integers, floats, or arrays of those types. The OpenTelemetry community maintains Semantic Conventions, a standardized attribute name, like http.request.method or gen_ai.model, so that data from different libraries and vendors is consistent and queryable.
HTTP semantic convention attributes
"attributes": {
  "http.request.method":       "POST",
  "http.route":                "/api/v1/orders",
  "url.scheme":                "https",
  "url.path":                  "/api/v1/orders",
  "server.address":            "api.shop.example.com",
  "server.port":               443,
  "http.response.status_code": 201,
  "http.request.body.size":    1024,
  "network.protocol.version":  "1.1",
  "client.address":            "203.0.113.42",

  // Custom business attributes
  "order.id":                  "ORD-88291",
  "order.total_usd":           149.99,
  "order.item_count":          3,
  "customer.tier":             "premium"
}
LLM observability (GenAI) semantic convention attributes
The OpenTelemetry GenAI working group has defined standard attributes for tracking LLM interactions. These are what modern AI observability platforms like Dynatrace use to build their LLM dashboards:
"attributes": {
  "gen_ai.provider.name":        "openai",
  "gen_ai.operation.name":       "chat",
  "gen_ai.request.model":        "gpt-4o",
  "gen_ai.request.temperature":  0.7,
  "gen_ai.request.max_tokens":   2048,
  "gen_ai.request.top_p":        0.95,
  "gen_ai.response.model":       "gpt-4o-2024-05-13",
  "gen_ai.response.finish_reasons": ["stop"],
  "gen_ai.usage.input_tokens":   843,
  "gen_ai.usage.output_tokens":  217,

  // RAG pipeline
  "gen_ai.data_source.id":        "knowledge-base-prod"
}
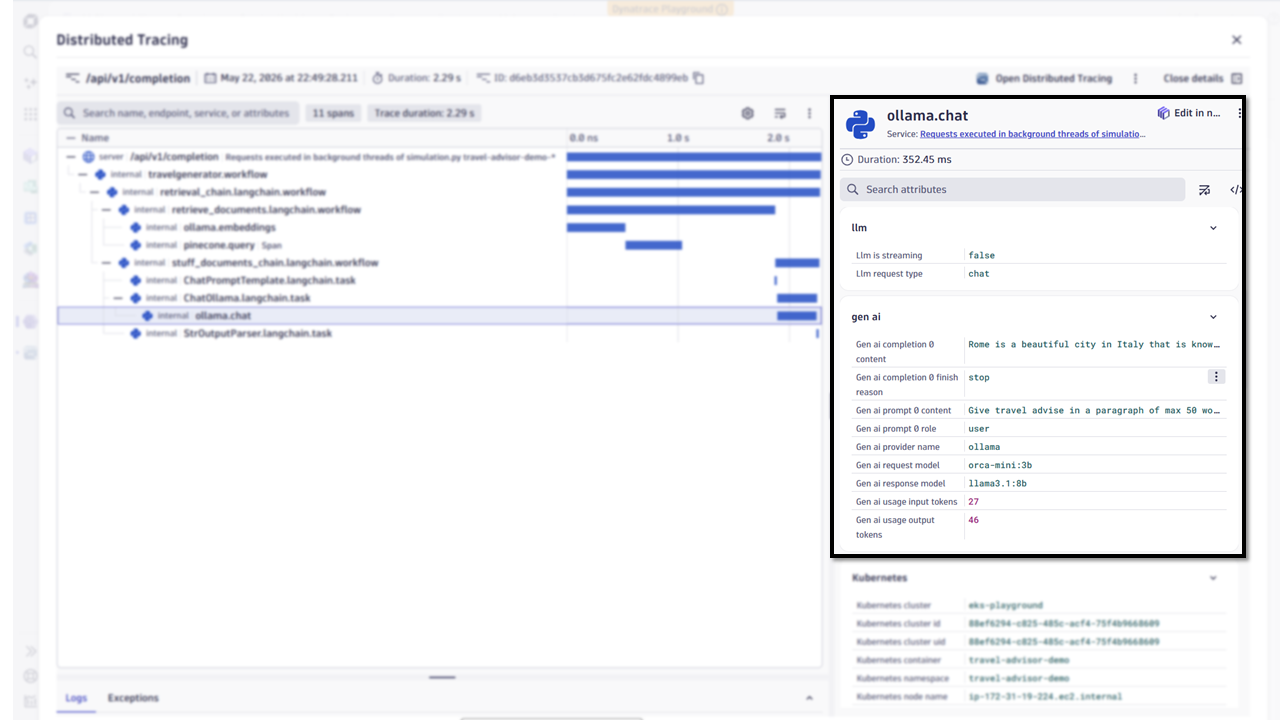
Cost tip: Token-count attributes can support request-level cost estimation when accurate token data and applicable model pricing are available. You can aggregate available telemetry in Dynatrace Notebooks to analyze AI-cost drivers by dimensions such as user, feature, or tenant, where those dimensions are captured.
7. Span events – Timestamped moments within a span
Span events are timestamped log-like records attached to a span. Unlike attributes, which describe the whole operation, events describe something that happened at a specific point in time during the span’s execution.
Events have three fields: a name, a timestamp, and an optional set of attributes. They are ideal for recording exceptions, retries, cache hits/misses, or any discrete moment you’d otherwise log separately.
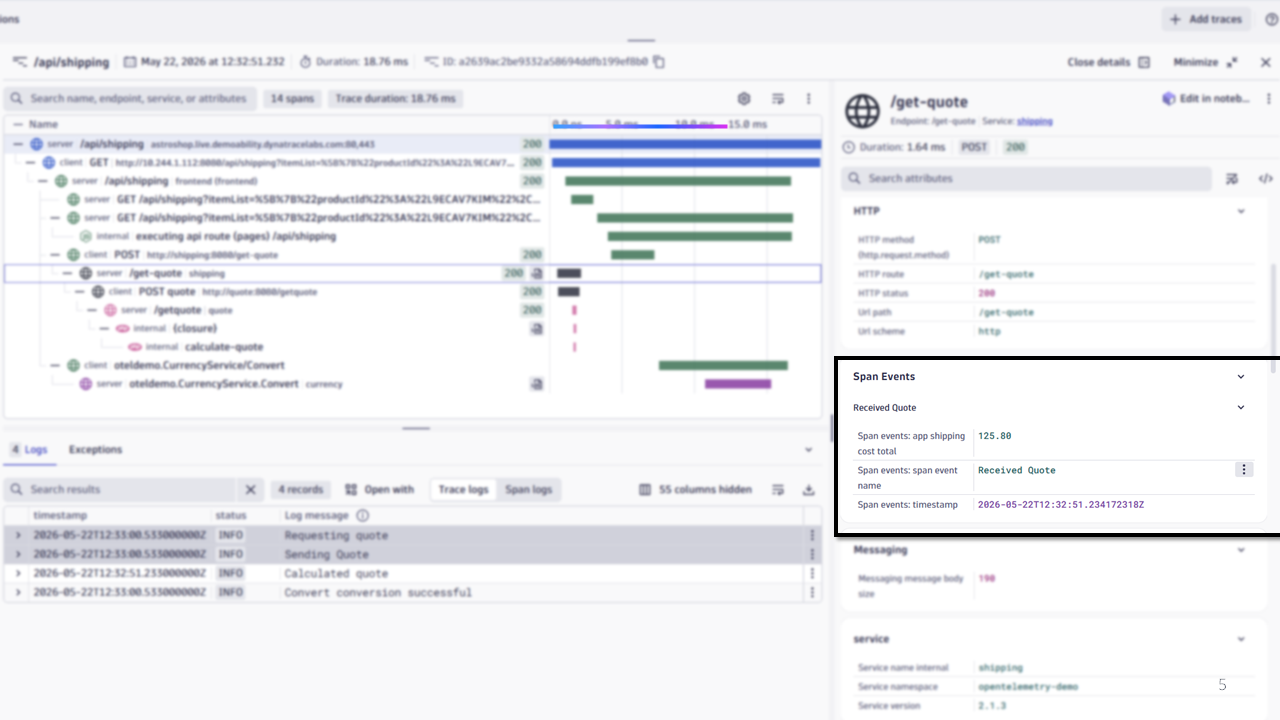
Span events for capturing exceptions: The OTel spec defines a standard exception event name (exception) with reserved attributes. Most SDK auto-instrumentations record this automatically when an unhandled exception is caught. This is almost always recorded with the timestamp when the exception was caught under the span event:
 "events": [
  {
    "name":      "exception",
    "timestamp": "2024-05-22T14:30:00.198Z",
    "attributes": {
      "exception.type":       "java.net.SocketTimeoutException",
      "exception.message":    "Read timed out after 5000ms",
      "exception.stacktrace": "java.net.SocketTimeoutException: Read timed out\n  at sun.net.www...",
      "exception.escaped":    true
    }
  }
]
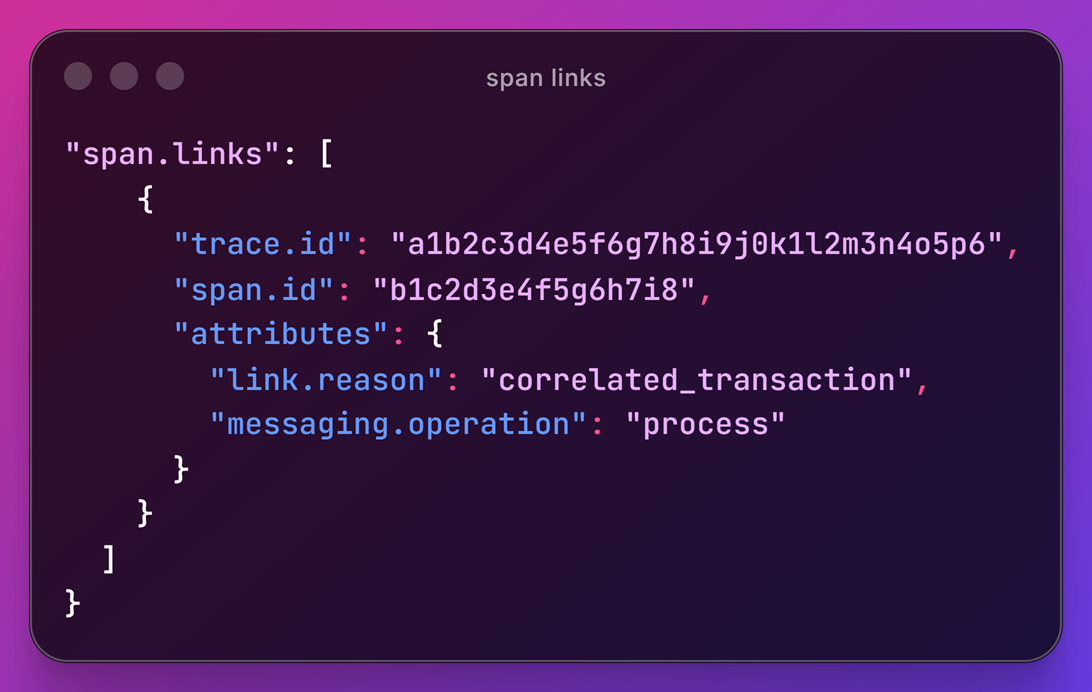
8. Span links – Connecting spans across traces
Span links let you connect a span to spans in other traces. Unlike the parent-child relationship, which is a single chain, links represent many-to-many causal relationships between spans in different trace trees.
The canonical use case is batch processing: a batch job that processes 100 messages from a queue creates one trace, but each message originated from a different upstream trace. Links let you tie them together without merging all 100 traces into one.
HTTP span name example – Fan-out batch processing
{
  "name": "batch.process_order_events",
  "kind": "SpanKind.CONSUMER",
  "links": [
    {
      "context": {
        "trace_id": "0x4bf92f3577b34da6a3ce929d0e0e4736",
        "span_id":  "0x00f067aa0ba902b7"
      },
      "attributes": { "link.type": "message_origin" }   // origin: order service
    },
    {
      "context": {
        "trace_id": "0x7d4e9c8f2a1b3c4d5e6f7a8b9c0d1e2f",
        "span_id":  "0xa1b2c3d4e5f60718"
      },
      "attributes": { "link.type": "message_origin" }   // origin: payment service
    }
  ]
}
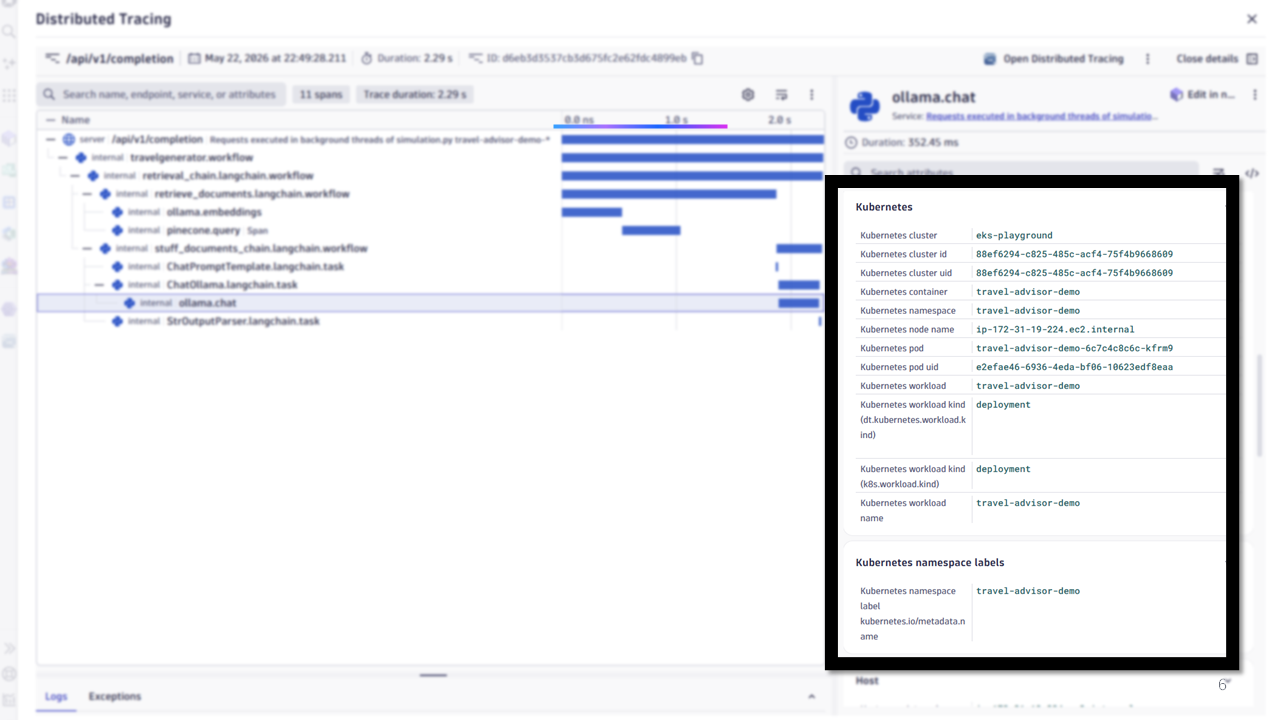
9. Resource – Where did this span come from?
Resource attributes describe the entity that produced the span, for example the infrastructure and application identity of the instrumented service. Unlike span attributes, which describe one operation, resource attributes are the same for every span emitted by a given process.
Resources let you answer: which service, which version, running on which host or container, in which cloud environment? This is the foundation for service maps, deployment tracking, and infrastructure correlation.
HTTP microservice span name example
"resource": {
  "attributes": {
    "service.name":           "order-service",
    "service.version":        "2.4.1",
    "service.namespace":      "ecommerce-platform",
    "service.instance.id":    "pod-order-svc-7d8f9b-xkzq2",
    "deployment.environment": "production",
    "k8s.cluster.name":       "prod-us-east-1",
    "k8s.namespace.name":     "ecommerce",
    "k8s.pod.name":           "order-svc-7d8f9b-xkzq2",
    "cloud.provider":         "aws",
    "cloud.region":           "us-east-1",
    "telemetry.sdk.name":     "opentelemetry",
    "telemetry.sdk.language": "java",
    "telemetry.sdk.version":  "1.38.0"
  }
}
LLM application span name example
"resource": {
  "attributes": {
    "service.name":           "ai-customer-assistant",
    "service.version":        "1.7.0",
    "service.namespace":      "ai-products",
    "deployment.environment": "production",

    // Serverless (AWS Lambda)
    "faas.name":              "ai-assistant-handler",
    "faas.version":           "$LATEST",
    "cloud.provider":         "aws",
    "cloud.region":           "eu-west-1",
    "telemetry.sdk.name":     "opentelemetry",
    "telemetry.sdk.language": "python",
    "telemetry.sdk.version":  "1.25.0"
  }
}
10. Instrumentation scope – Who created this span?
Instrumentation scope (formerly called Instrumentation library) identifies the specific library or component that generated the span. It has a name and an optional version and schema URL.
This matters when you have multiple instrumentation libraries active in the same service. Such as, a web framework auto-instrumentation and a manual GenAI instrumentation. The scope tells you which one produced each span, so you can filter, route, and debug instrumentation issues precisely.
HTTP example
// Auto-instrumented by the OTel Java HTTP server library
{
  "instrumentation_scope": {
    "name":       "io.opentelemetry.spring-webmvc-6.0",
    "version":    "2.4.0-alpha",
    "schema_url": "https://opentelemetry.io/schemas/1.26.0"
  }
}

// A manually created child span
{
  "instrumentation_scope": {
    "name":    "com.mycompany.order-service",
    "version": "2.4.1"
  }
}
Putting it all together – A full LLM RAG span
Here’s a complete LLM RAG span as it appears in real OTel console exporter output, with every field you’ve read about in one place:
{
  "name": "chat gpt-4o",
  "context": {
    "trace_id":   "0x9c8d7e6f5a4b3c2d1e0f9a8b7c6d5e4f",
    "span_id":    "0xb2c3d4e5f6071829",
    "trace_state": "[]"
  },
  "kind":      "SpanKind.CLIENT",
  "parent_id": "0xa0b1c2d3e4f50617",
  "start_time": "2024-05-22T14:30:00.102Z",
  "end_time":   "2024-05-22T14:30:03.710Z",
  "status": { "status_code": "UNSET" },
  "attributes": {
    "gen_ai.system":                  "openai",
    "gen_ai.operation.name":          "chat",
    "gen_ai.request.model":           "gpt-4o",
    "gen_ai.request.temperature":     0.7,
    "gen_ai.request.max_tokens":      1024,
    "gen_ai.response.model":          "gpt-4o-2024-05-13",
    "gen_ai.response.finish_reasons": ["stop"],
    "gen_ai.usage.input_tokens":      1243,
    "gen_ai.usage.output_tokens":     318,
    "gen_ai.usage.total_tokens":      1561,
    "server.address":                 "api.openai.com",
    "http.response.status_code":      200
  },
  "events": [
    {
      "name": "gen_ai.content.prompt",
      "timestamp": "2024-05-22T14:30:00.102Z",
      "attributes": {
        "gen_ai.prompt": "You are a helpful assistant. Context: [...] User: Explain OTel spans"
      }
    },
    {
      "name": "gen_ai.first_token",
      "timestamp": "2024-05-22T14:30:00.689Z",
      "attributes": { "gen_ai.token.index": 0 }  // TTFT = 587 ms
    },
    {
      "name": "gen_ai.content.completion",
      "timestamp": "2024-05-22T14:30:03.710Z",
      "attributes": {
        "gen_ai.completion":    "OpenTelemetry spans are the fundamental unit of work...",
        "gen_ai.finish_reason": "stop"
      }
    }
  ],
  "links": [],
  "resource": {
    "attributes": {
      "service.name":            "ai-customer-assistant",
      "service.version":         "1.7.0",
      "deployment.environment":  "production",
      "telemetry.sdk.language":  "python",
      "telemetry.sdk.name":      "opentelemetry",
      "telemetry.sdk.version":   "1.25.0"
    }
  },
  "instrumentation_scope": {
    "name":    "opentelemetry.instrumentation.openai",
    "version": "0.28.4"
  }
}
Wrapping up
Distributed traces and spans can appear overwhelming at first glance. With a clear understanding of span anatomy, however, each attribute earns its place and every field has a precise meaning and a defined purpose.
You can now use spans to spot performance issues, catch exceptions, and extract real insights from distributed traces in your environment. In the next post in this series, we’ll look at how the OTel Collector receives, processes, and exports this data, and the pipeline decisions that determine what actually lands in your observability backend.

Looking for answers?
Start a new discussion or ask for help in our Q&A forum.
Go to forum