
In our ongoing effort to make it easier for you to identify potential performance improvements in your environment and to build faster web experiences, we’ve added a new metric called Transfer size to our application analysis views. We’ve also improved the usability of the waterfall Analysis page.
If you haven’t done so already, be sure to read our earlier posts that detail other recent waterfall improvements and the user-action findings that are provided in waterfall analysis view.
Transfer size
Waterfall analysis view now enables you to analyze the transfer size of user actions. The total transfer size of each user action is listed as an additional finding at the top of the page (see example below).
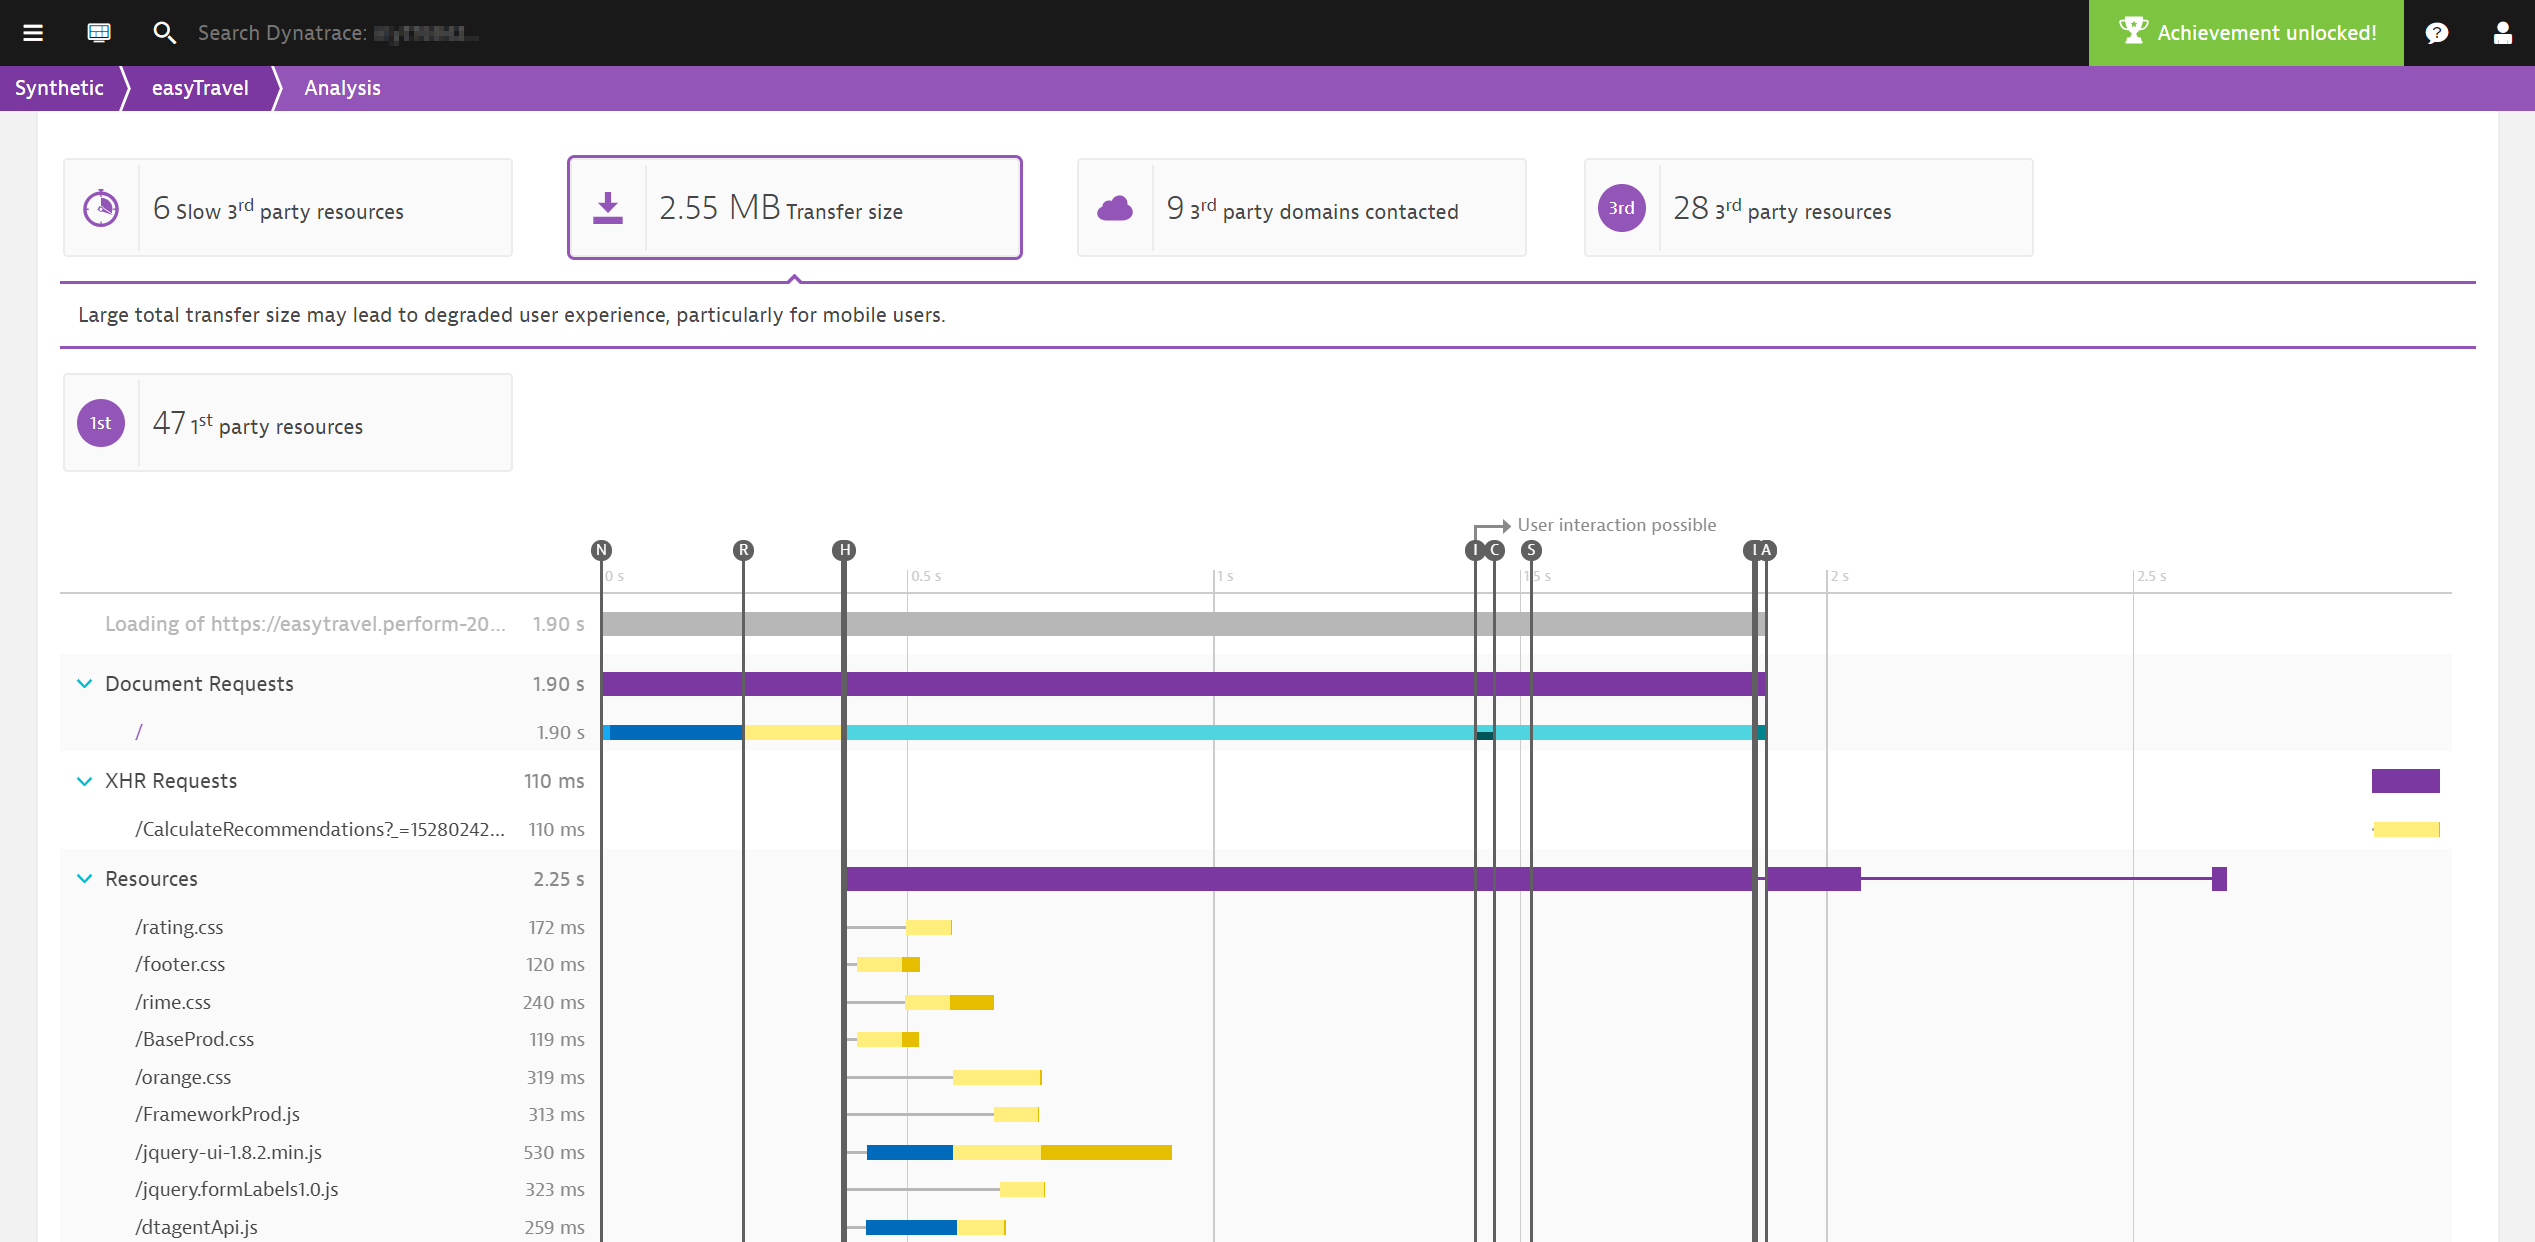
Understand transfer sizes
Large transfer sizes don’t automatically lead to poor performance. For example, a page load action might result in a transfer size of over 10MB while the corresponding Visually complete metric comes in at less than 1 second. This is certainly a fast load time. However, user experience involves more than fast-loading pages. Imagine that this user is visiting your application on a mobile device with a limited data plan. This user may be in for an unpleasant surprise when they check the amount of free data they have remaining in their data plan.
Tim Kadlec has built an informative page that shows how much sites cost from a data-usage perspective worldwide. You may be surprised by what you learn about the transfer sizes of the user actions in your application.
The transfer size finding is available for both RUM & Synthetic monitoring. It’s however currently not available in the aggregated waterfall as not all browsers support the Navigation Timing Level 2 specification.
Waterfall analysis enhancements
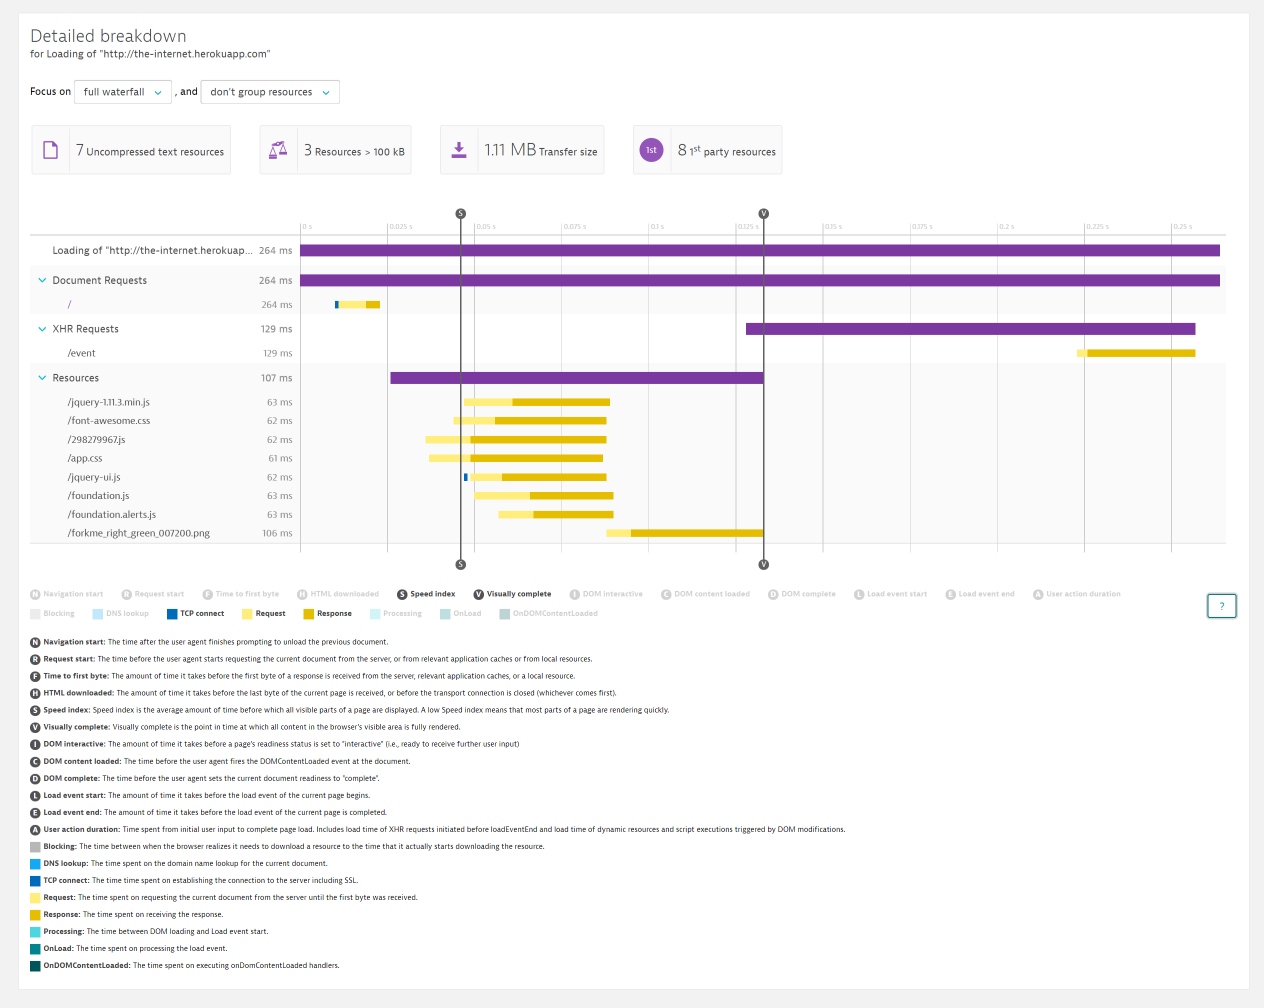
We’ve also made smaller improvements to Waterfall analysis view:
- You can now toggle event markers and request phases to focus on what’s most important for your analysis.
- Additional legend items and short explanations for all request phases are now included.
- Holding your cursor over a legend item now results in a highlight of the corresponding event marker.
- The blocking phase is now visualized as a smaller gray line.
Having the ability to toggle markers and phases can be very helpful in the course of waterfall analysis. Dynatrace even remembers your settings so you don’t have to toggle them on/off each time.
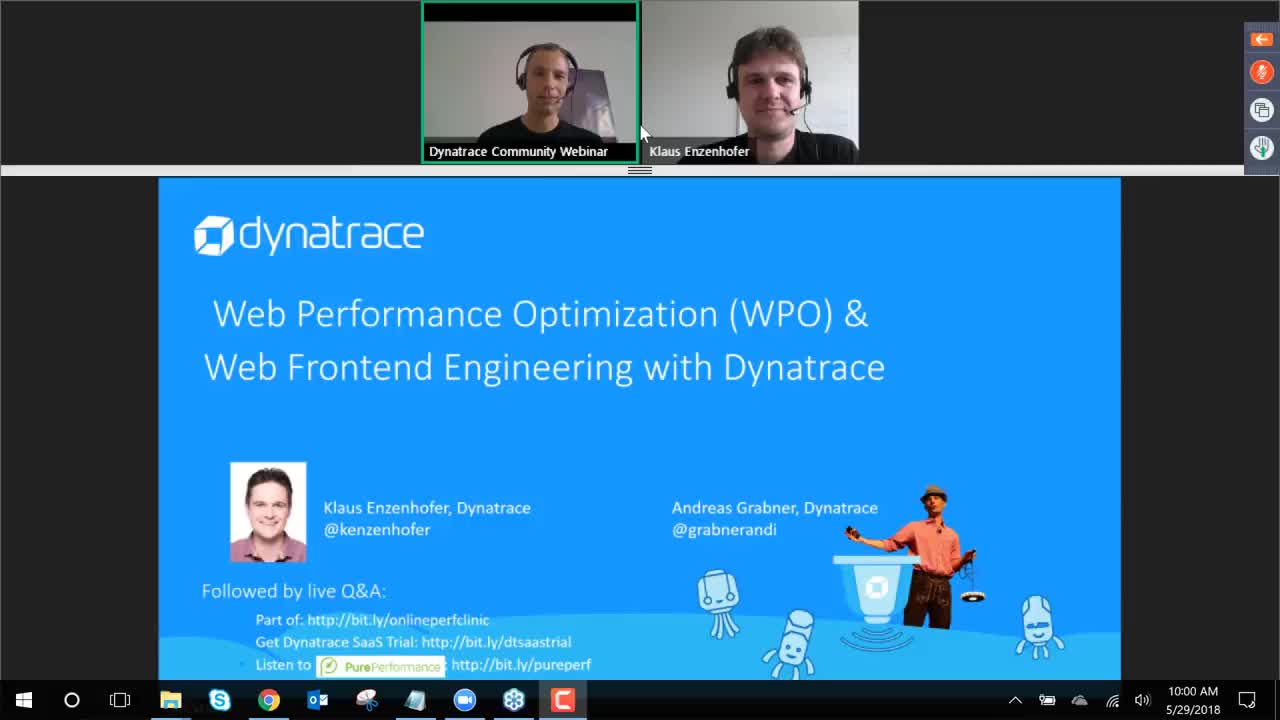
Video demonstration
Curious to see how these new enhancements look in action? Have a look at the latest Performance Clinic video below:


Looking for answers?
Start a new discussion or ask for help in our Q&A forum.
Go to forum