
Dynatrace Davis® AI automatically analyzes abnormal situations within your IT infrastructure, identifies their impact and root cause, and covers many observability use cases out of the box. Davis also provides the flexibility to adapt to domain-specific requirements using the newly released configuration settings, "metric events." These allow you to observe any metric, choose the best monitoring strategy for that metric, and create event triggers for detected anomalies.
Configure anomaly detection based on your business needs
Davis is the causational AI from Dynatrace that processes billions of events and dependencies and constantly analyzes your IT infrastructure. Davis detects any abnormal situation, analyzes the root cause, and, when justified, creates a problem. This is all done automatically with no required configuration.
But as every business works differently, there is often a need to customize Davis, so that it fits your domain-specific use cases and detects relevant and business-critical anomalies, such as those outlined in the following examples:
- Detect anomalies within your custom data streams
- Modify the time-series data you want to observe.
- Reduce the noise and false alerts faced by your SRE team
- Handle dynamic time-series data that can’t be handled effectively with a static threshold
- Customize monitoring for a specific area of your IT infrastructure
Dynatrace metric events offer the flexibility needed to customize your anomaly detection configuration. Metric events give you the power to transform and combine one or more metrics and choose one of the built-in monitoring strategies so that entities can be evaluated independently.
Identify abnormal situations
Before demonstrating how to configure metric events using the newly adapted web UI, let’s briefly revisit how anomalies are detected within time-series data.
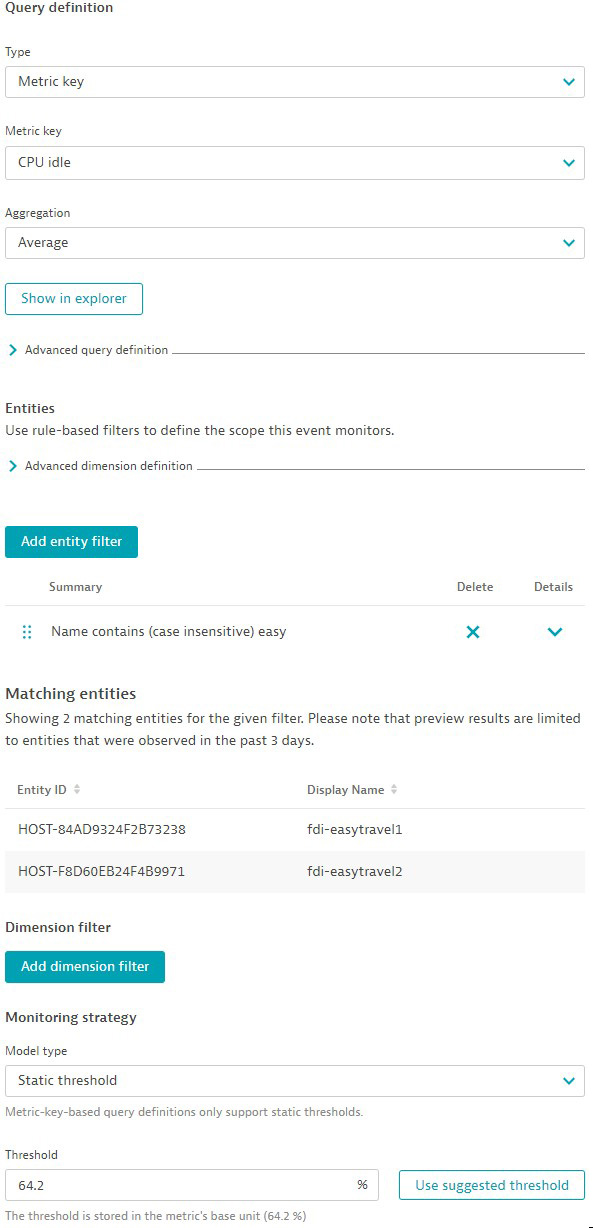
There are two stages where data is analyzed. Firstly, an anomaly detector known as a metric key analyzes the incoming raw data ingest. With a pre-defined static threshold, you can monitor all metric dimensions within one configuration and, for example, create an alert if the static threshold of 20,000 CPUs is exceeded. It’s a significant advantage to have no limitations on metric dimensions when using this detector on incoming raw data, where there’s no possibility of time-rollups or space aggregations.
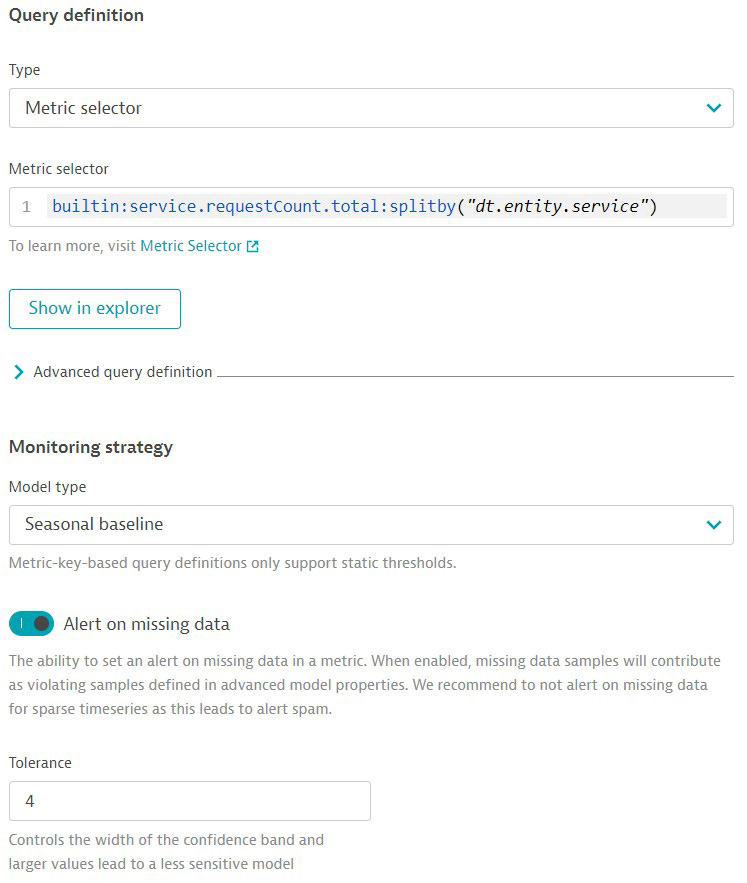
With the second anomaly detector—the metric selector, which occurs after data ingest—you have the full power of metric expressions to read and analyze historical data. This allows you to use monitoring strategies such as auto-adaptive thresholds or seasonal baselines.
Let’s configure anomaly detection on a metric
Now that you understand the benefits of the two anomaly detectors let’s take a closer look at a metric we want to monitor. If you’re going to measure a saturation metric (like memory usage or disk Input/Output rates), we recommend using the query type metric key. With this approach, you benefit from having no limitations and the flexibility to filter by entity or dimension. If you want Dynatrace to suggest an appropriate threshold, select Use suggested threshold. Dynatrace will calculate a suggested threshold based on the last seven days of historical data.
If your use case requires that you aggregate data or use simple arithmetic operations on a metric, then we recommend the query type metric selector. This is a powerful instrument with which you can read historical data and use many transformations such as rollup, time shift, or filter. In addition, you can use smart monitoring strategies, like auto-adaptive thresholds or seasonal baselines. Another benefit of this anomaly detector is the ability to alert on missing data. However, be aware that some limitations apply due to potential query complexity.
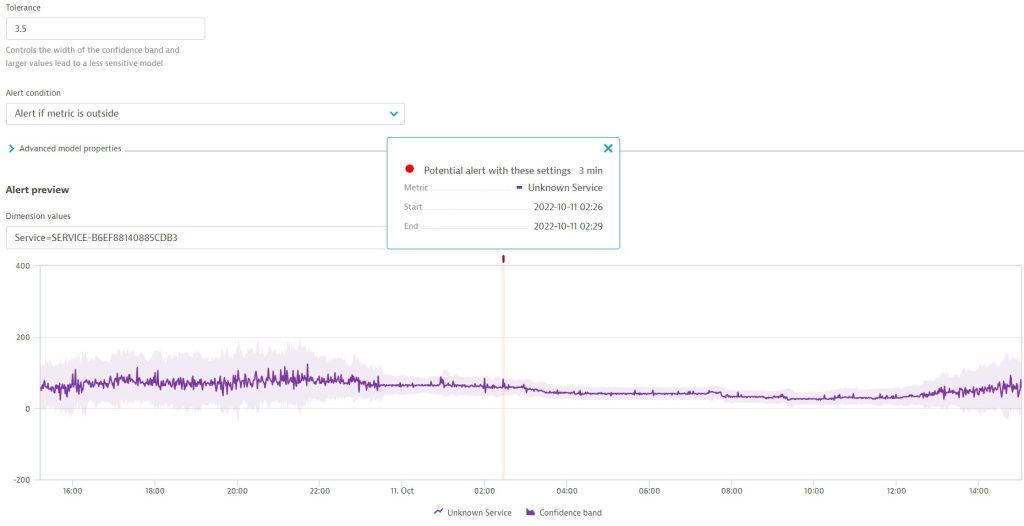
Once the settings are complete, you can see the result in the alert preview and adjust settings if necessary. The alert preview shows how your metric event configuration behaves on each dimension. On a seasonal baseline, for example, you can adjust the width of the confidence band. The screenshot below shows that a potential alert will be triggered based on the configured settings. This single violating sample was detected in a three-minute sliding window. If you adjust the violation tolerance from 2.5 to 3 samples, this potential alert on the dimension Service-EasytravelService will disappear.
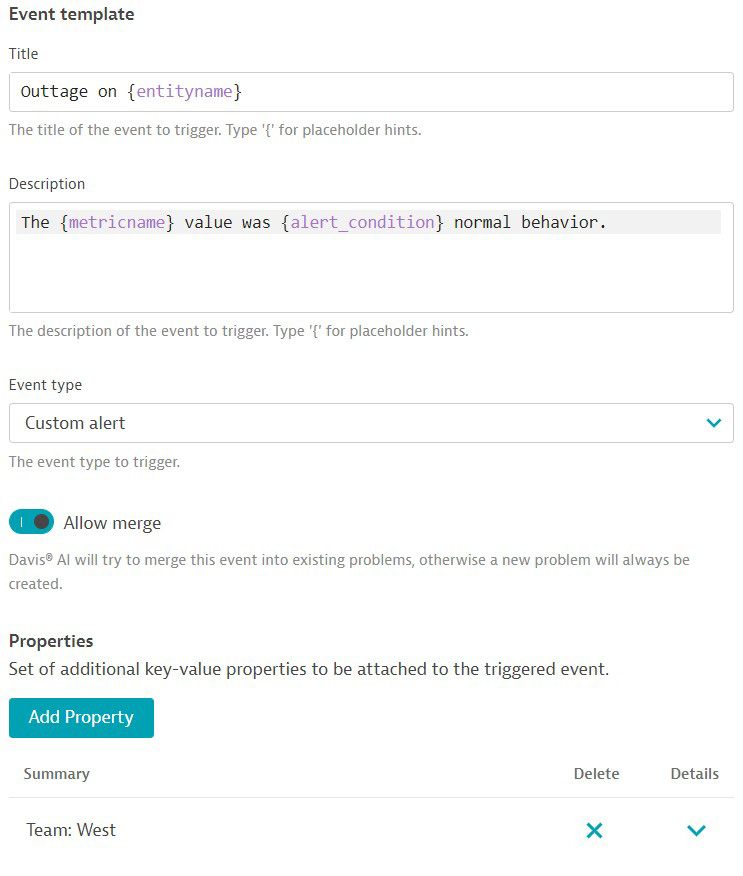
Once you’ve selected the metric and set up anomaly detection, you can move on to the next step: defining what we want to be informed of when this event is raised. You can use placeholders to create meaningful event-message titles and descriptions. In addition, you can use key:value properties to add relevant context, such as which team an issue belongs to.
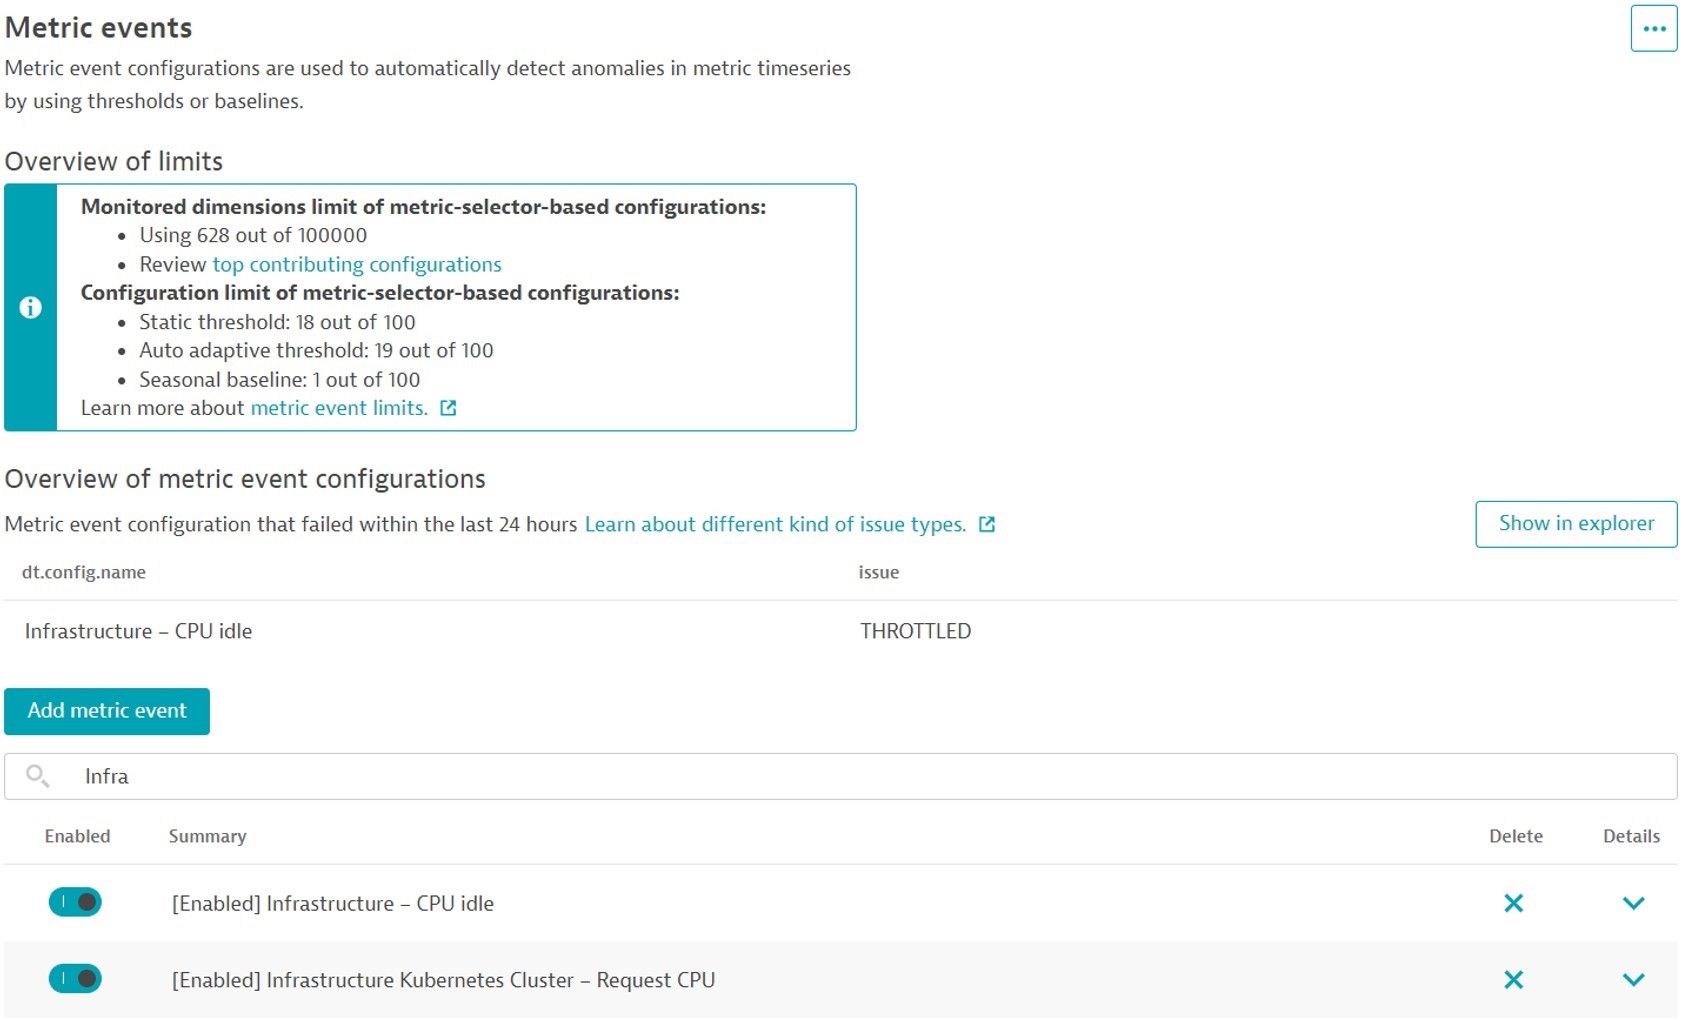
After saving, your metric event configuration is enabled. You can disable or adjust it at any time. You get an overview of the limits and any metric-event configuration failures within the last 24 hours.
What’s next?
Metric events will be automatically enabled for all Dynatrace SaaS environments with the release of Dynatrace version 1.253. No effort is needed from your side. We’re, of course, highly interested in your feedback. So, please head over to the Dynatrace Community and share your suggestions and product ideas to help us continuously improve Dynatrace anomaly detection.
See the metric events in action
Want to know more? Check out the following video, where Andreas Grabner and I teamed up for a new episode of Dynatrace Observability Clinic. We show you a live demonstration of setting up and working with metric events and answer many questions.


Looking for answers?
Start a new discussion or ask for help in our Q&A forum.
Go to forum