
Creating, sharing, and viewing dashboards are simple tasks that quickly become tricky as your environments grow over time. Say you want to provide a set of custom dashboards for internal users, or you need to perform administrative tasks like bulk deletion of obsolete dashboard instances. To-date, such tasks weren’t as flexible and easy to set up as they should have been. This is why, with Dynatrace version 1.164, we’ve introduced the new Dynatrace Dashboards API. The new API makes such bulk tasks and dashboard configurations easy to set up and automate.
Automation and scalability
Dynatrace is designed around the principles of automation and scalability—which is why Dynatrace is the monitoring tool of choice for the cloud. Automated dashboard setup and configuration require such flexibility, which is why we’re proud to announce the availability of the Dashboards API as a Beta release.
In a highly recommended blog post about the Dynatrace Configuration API, my colleague, Wolfgang Beer, explores the concept of “configuration as code” and what this strategy can provide for your organization. Dynatrace dashboards now fit perfectly with the configuration-as-code approach.
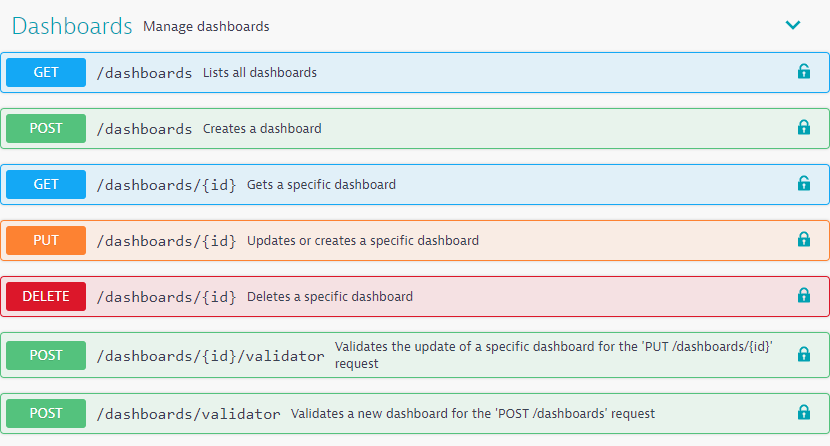
To access the Dynatrace API Explorer, navigate to Settings > Integration > Dynatrace API and generate a Configuration API token. Then, from within the API Explorer, select Configuration API from the drop-list in the upper-right to view the available dashboard configuration endpoints.
Build your own dashboard templates
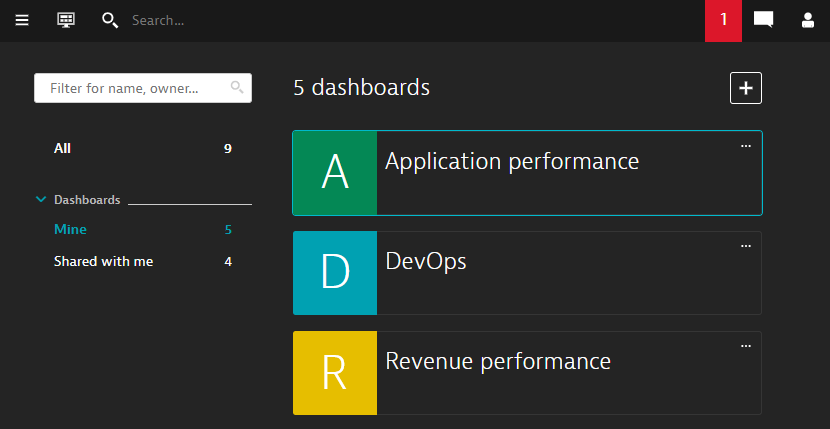
The Dashboards API allows you to export and then re-import Dynatrace dashboards as JSON documents. What this enables you to do is prepare your own set of dashboard templates (to address your specific dashboarding and reporting use cases) and import them via our API to make them available whenever you need them.
If you automate this process so that it’s performed on a regular schedule and push the JSON documents to a version control system like GitHub, you’ll have a log of all the changes that are made to your dashboard templates over time. This will allow you to revert to any previous dashboard configuration if desired.
Provision new environments by publishing shared dashboards
If your organization maintains multiple Dynatrace environments, you’ll probably want to automate your new-environment provisioning tasks. You can now do this with the Dashboards API. You can even define the sharing settings of dashboards when importing them via the API.
"dashboardMetadata": {
"name": "Example Dashboard",
"shared": true,
"sharingDetails": {
"linkShared": true,
"published": false
}
To make a dashboard that you’ve imported accessible via a shared link, be sure to set the linkShared attribute to true. In this way, you can, for example, share a dashboard URL via email. Note that the general shared switch also needs to be set to true to make this work, as this enables or disables all further sharing options.
To make a dashboard available to all users in a Dynatrace environment, set the published switch to true.
Transfer ownership or delete dashboards
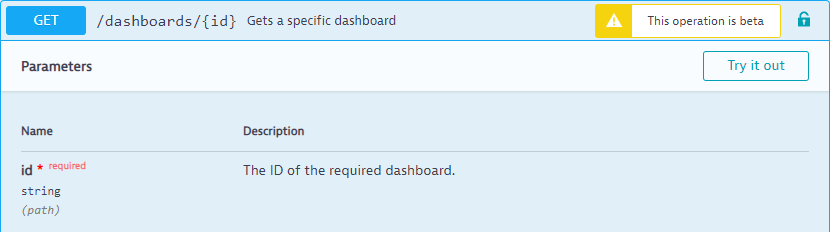
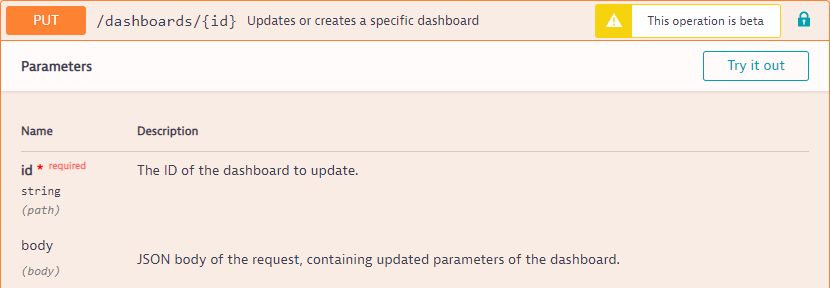
You may occasionally need to transfer ownership of a dashboard. For example, if an employee leaves your company, you can transfer their dashboard assignments to another employee by updating the dashboard owner information. To do this, fetch the dashboard via the API, change the owner by adjusting its parameters in JSON, and update the dashboard using the API call shown below.
Alternatively, you can delete dashboards you no longer want to keep. The DELETE endpoint lets you scrap specific dashboards.
Why you’ll love the Dashboards API
A well-built API is more powerful than any UI can ever be. Following our “API first” mantra, we’ve decided not to immediately add UI capabilities for these administrative tasks and have instead set out to empower you highly flexible dashboarding endpoints. As the old saying goes, sometimes less is actually more.
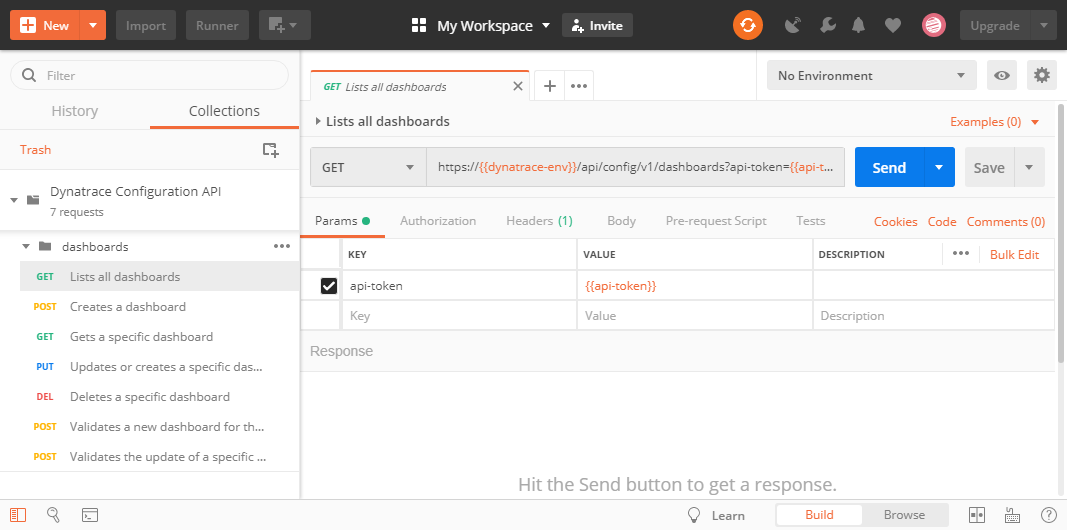
One piece of advice we’d like to leave you with: If you haven’t done so already, check out API development tools like Insomnia or Postman (a personal favorite). These tools will help you tremendously in managing REST APIs.
We used Postman to auto-generate a dashboarding endpoint collection from the Dynatrace API documentation, which is available at this link. To use it yourself, simply fire up Postman and import the collection using File > Import > Import from Link. Finally, adjust both the dynatrace-env and api-token variables to reflect the specifics of your Dynatrace environment. Then sit back and watch the magic unfold!
Limitations
- Referenced tag filters or entities must be present in the target environment, otherwise, no data will be returned. Referenced filters can be set up after a dashboard has been imported.
- Referenced metrics must be present for a chart to show any data. A common metric interface, which is currently being developed, will do away with most of the issues you might face during the current Dashboard API Beta phase.
- User permissions for specific dashboards aren’t yet supported over the API, but they will be in a future release.
- As all dashboard endpoints are available as a Beta release, they may be changed in non-compatible ways, although we will do our best to avoid this.
What’s next?
We’ll invest further in improving our Dashboards API and will work toward eliminating the limitations detailed above. To stay up-to-date with our dashboarding and reporting enhancement plans, check out our dashboarding roadmap and provide your feedback. We’d love to hear from you!


Looking for answers?
Start a new discussion or ask for help in our Q&A forum.
Go to forum