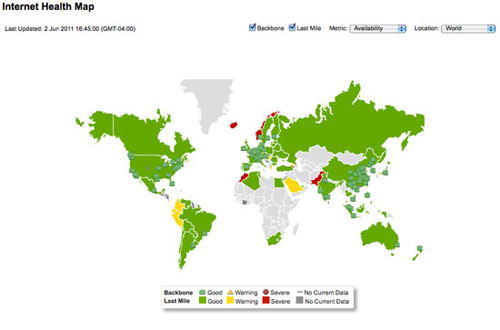
Recently, we launched the Internet Health Map allowing users quickly identify if performance issues in a particular geographical area are part of a broader Internet slow-down. The goal is to provide a clear indication of how actual users, not a data center server, are experiencing the Web.
Earlier this month, we launched the Internet Health Map which allows you to quickly identify if your performance issues in a particular geographical area are part of a broader Internet slow-down. This free offering uses our a “collective intelligence” approach to visualize the relative operational health of the Internet to help organizations determine if a performance problem is specific to them or shared by other users.
By comparing the results of the millions of tests that run on the Gomez Global Performance Network every day to a rolling baseline of data for the same weekday and time, the Internet Health Map detects aberrations that are indicative of a general Internet performance issue at specific geographic locations.
Because Compuware has the only testing network with 150,000+ real computers that operate at the “edge of the Internet” running behind local ISPs, the data from this “Last Mile” provides the most accurate insight into the true performance conditions experienced by real users.
Backbone and Last Mile metrics are compared to baseline values and a status indicating how performance compares is displayed on the Internet Health Map. The map compares current performance to the same hour the previous four weeks which is more accurate than comparing traffic to the previous hour or day due to the natural cycles of businesses. You can select to view Backbone, Last Mile or both. The metrics are available: page response time, DNS time, connect time, content time, throughput, and availability.
About the Status Indicators
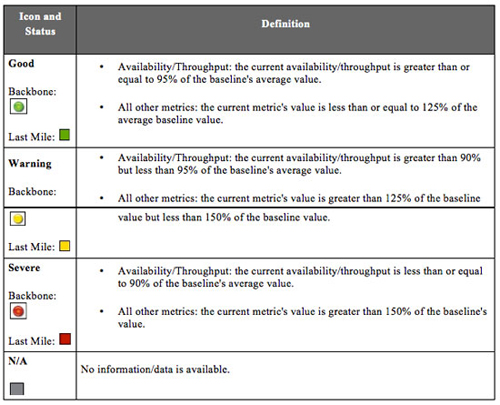
The status shown for each metric for Last Mile and Backbone is calculated by comparing the current value of the metric to its baseline value. The following table explains each status.
Note the following:
- The definition and status for the metrics is the same for Last Mile and Backbone.
- The calculation for the status of availability and throughput is different than for the other metrics.
The goal is to provide a clear indication of how actual users, not a data center server, are experiencing the Web.


Looking for answers?
Start a new discussion or ask for help in our Q&A forum.
Go to forum