
Dynatrace offers powerful and fully integrated synthetic monitoring capabilities out-of-the-box. With synthetic monitors, you can monitor application availability and complex business-critical workflows effortlessly with a real browser from locations across the world. You can also synthetically monitor your APIs quite easily with HTTP monitors.
But maybe you already have a synthetic monitoring solution in your toolkit; don’t worry, Dynatrace has you covered as well. Dynatrace now offers an API that enables you to push external synthetic test results. This allows you to integrate third-party or homegrown synthetic solutions that can enrich your Dynatrace monitoring data.
Why send synthetic data to Dynatrace?
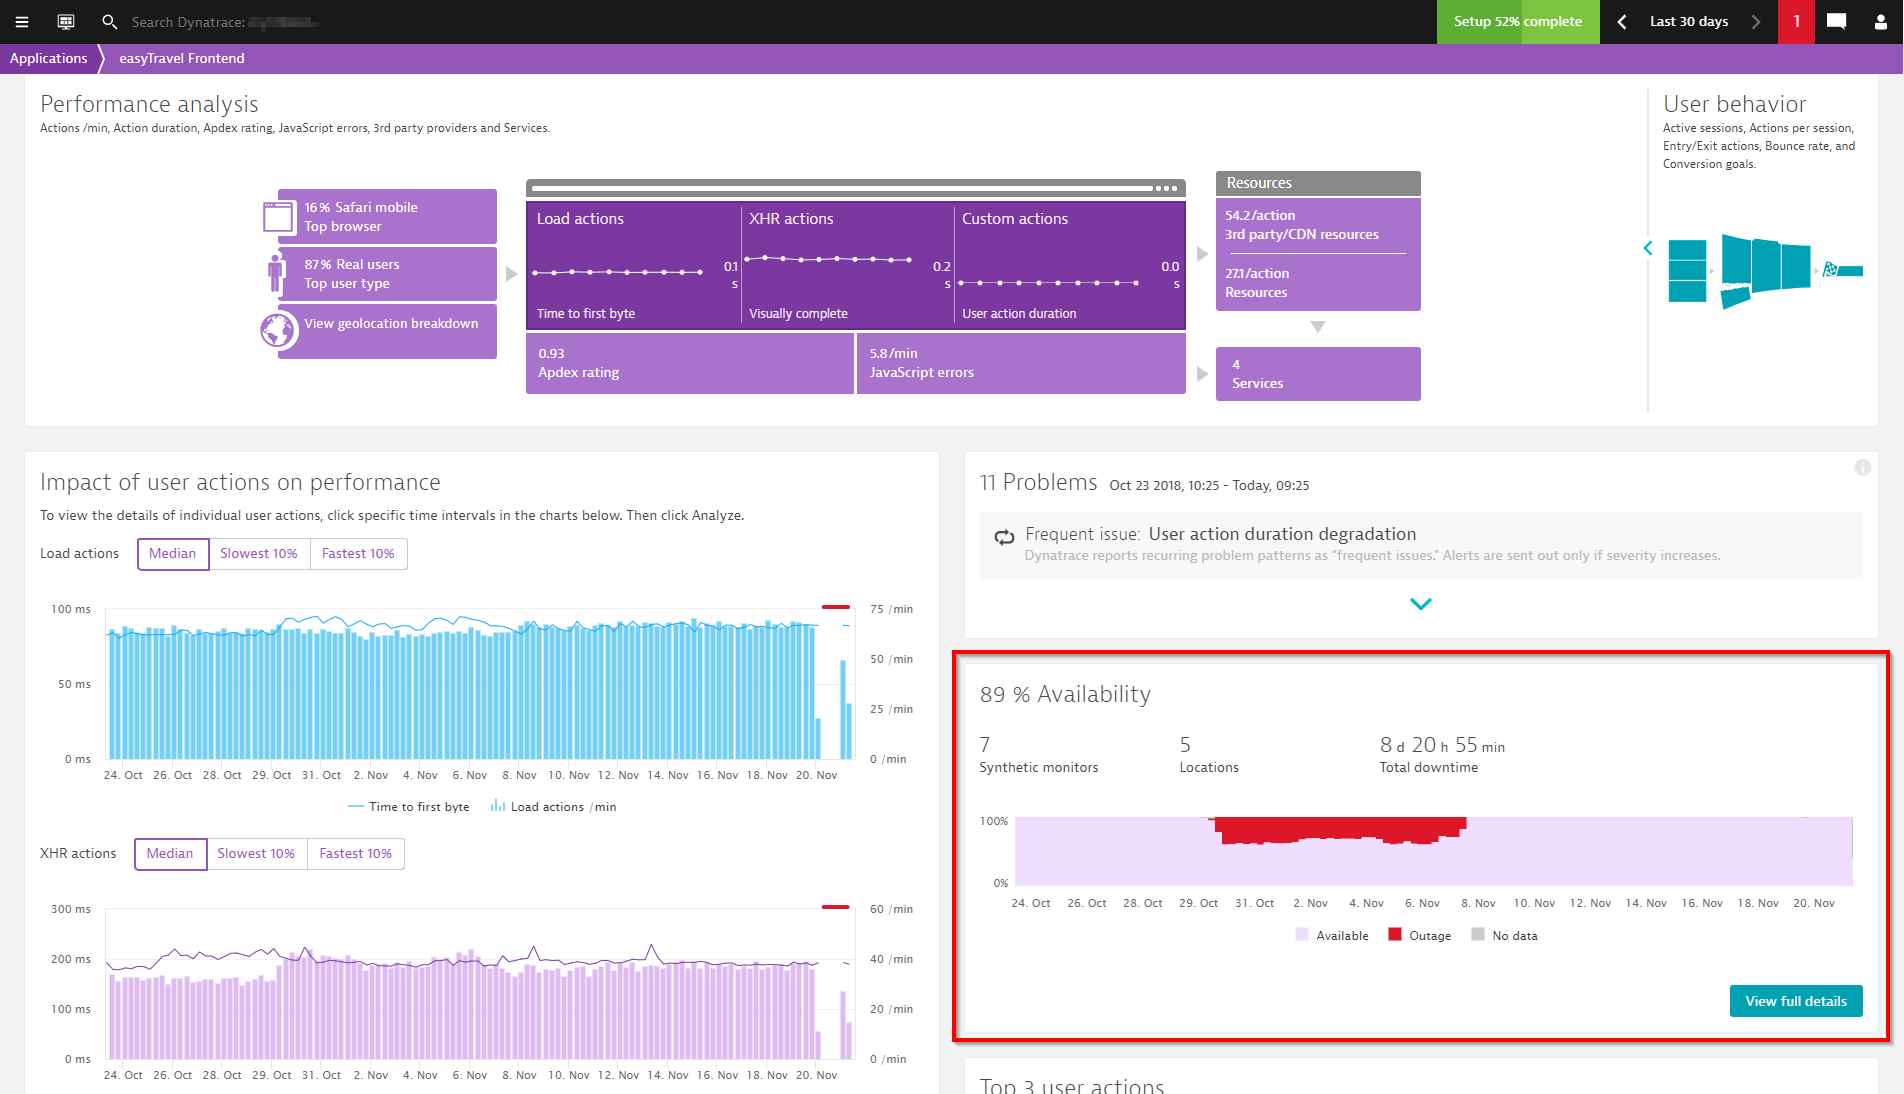
You can analyze all your monitoring data in a single location. You can even assign external synthetic data to the applications you monitor with Dynatrace. As soon as they’re linked, Dynatrace augments its real user data with synthetic data and correlates detected problems. With this approach, you can analyze external synthetic data directly on your Dynatrace dashboards.
What types of data can be sent to Dynatrace?
Some of the high-level items you can push into Dynatrace via the API are listed below. For details, look at the Dynatrace API Explorer or Dynatrace Help.
- Tests
- Locations (results by location)
- Results at the test and step level (Availability/Response time)
- Events
- Outage and slowdown events
- General
- Name and icon of external synthetic engine or tool sending the data (For your own scripts, you can enter any label; for external tools such as Pingdom, you can use the tool name and icon.)
Let’s get started
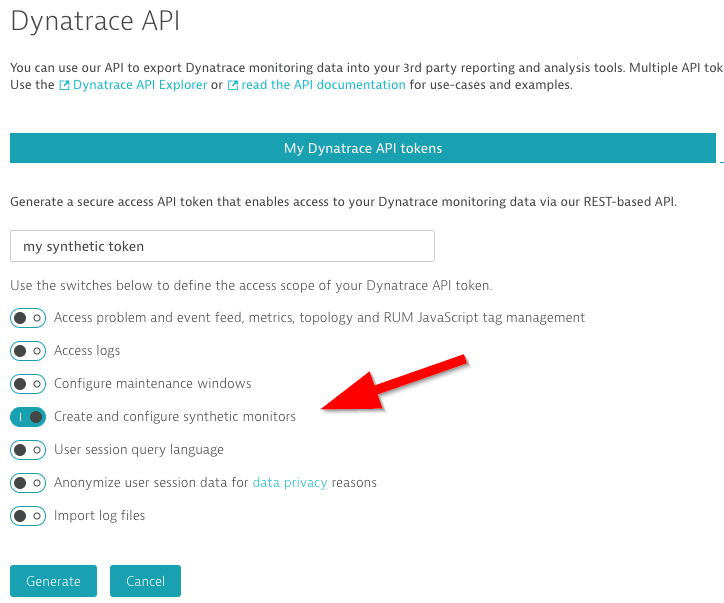
To begin, you’ll need to create an API token with adequate access scope so that you can send external synthetic data to Dynatrace.
- Select Settings from the navigation menu.
- Expand the Integration section and select Dynatrace API.
- Click the link to the Dynatrace API Explorer at the top of the page.
- Click the Generate token button and make sure the option Create and configure synthetic monitors is enabled.
Head over to GitHub where you’ll find a simple Python example to get you started.
How are external synthetic data sources displayed in Dynatrace?
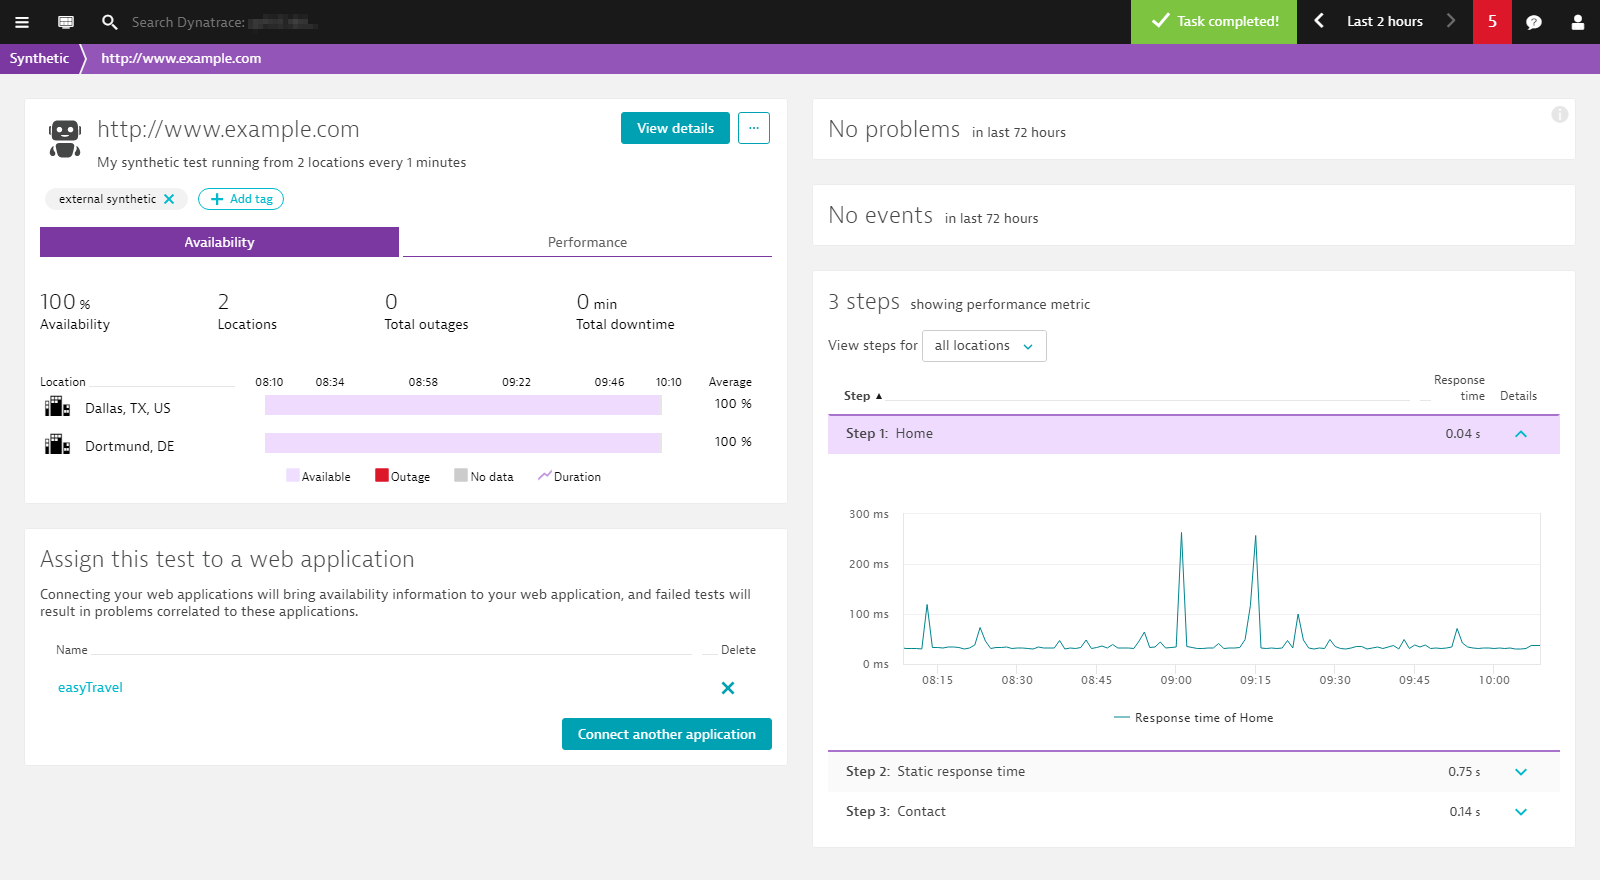
The POST external events to Dynatrace call and the POST external tests to Dynatrace call automatically push external synthetic data to Dynatrace. External synthetic data sources appear next to your Dynatrace synthetic monitors. To access them, select Synthetic from the navigation menu. You can tag your external synthetic data to easily identify and filter for external synthetic data by the tags. The screenshots below show external synthetic test data and event data in Dynatrace, respectively.
Pricing and feedback
Update: As of May 2020, the external synthetic/third-party synthetic API is billed via DEM units; see DEM monitoring consumption for details.
If you have any questions, feedback, or would like to partner with Dynatrace for an integration, we’d love to hear from you. For general details about the extensive Dynatrace API, see Dynatrace API Help.


Looking for answers?
Start a new discussion or ask for help in our Q&A forum.
Go to forum