
One key requirement of a microservices architecture is the ability to make information of all kinds available wherever and whenever it’s needed, without putting undue traffic on corporate and public networks. TIBCO Enterprise Message Service (EMS) is a standards-based messaging solution that can serve as the backbone of any microservices architecture by providing Java Message Service (JMS) compliant communications across a wide range of platforms and application technologies.
Dynatrace OneAgent has been able to detect TIBCO EMS processes out-of-the-box for some time already. However, so far it didn’t provide technology-specific metrics such as queue depth or number of consumers. With our new TIBCO EMS extension you can further enrich this information and see, for example, how many messages are getting stuck or how many messages went through the system. And when problems occur, you can easily drill down into the metrics of individual nodes to find the root causes of problems and potential bottlenecks.
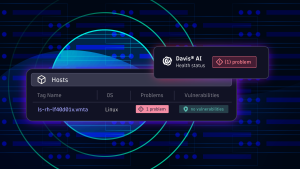
Apply Davis® AI to your TIBCO EMS servers
With the TIBCO EMS extension, Dynatrace AI incorporates relevant metrics into its analysis landscape and lets you know when the root cause of a problem relates to a metric that was acquired from TIBCO EMS. With this invaluable information you can remediate production issues much faster.
For example, you can create your own dashboard in minutes:
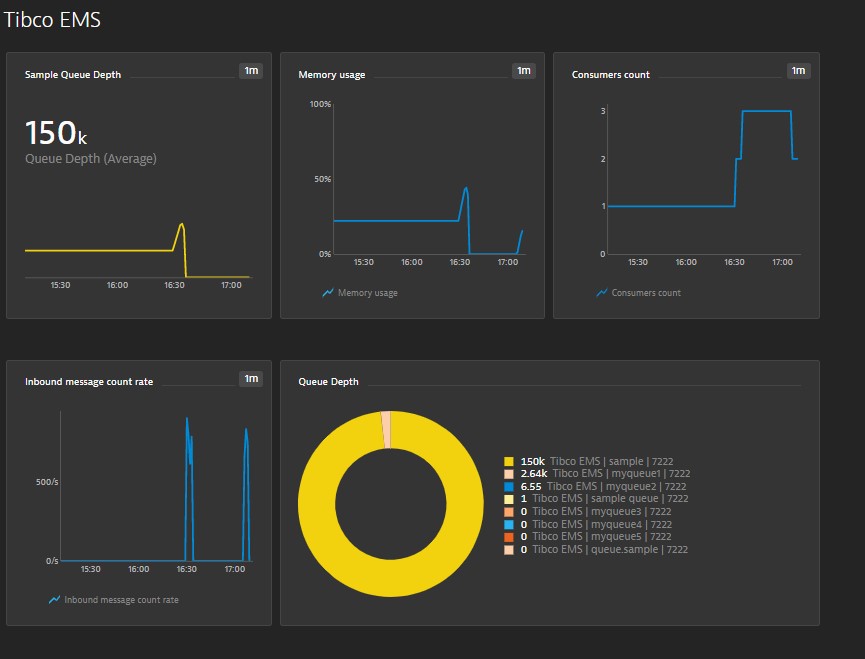
What you get
The TIBCO EMS extension detects multiple TIBCO EMS instances and gathers information from each of them. It can connect with or without SSL for more secure deployments. Once it’s configured, you can easily define custom alerts to notify your Operations team of any issues, such as queues filling up.
The extension captures global broker-level information under the new TIBCO EMS tab (see below).
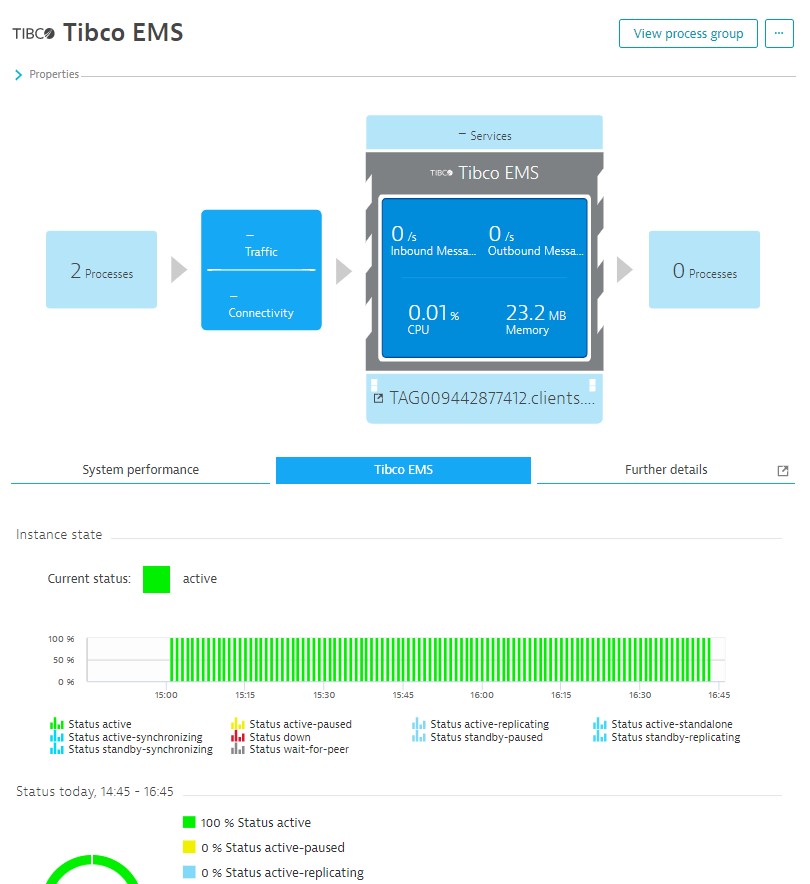
On the Further details tab, you’ll find metrics for specific queues and topics.
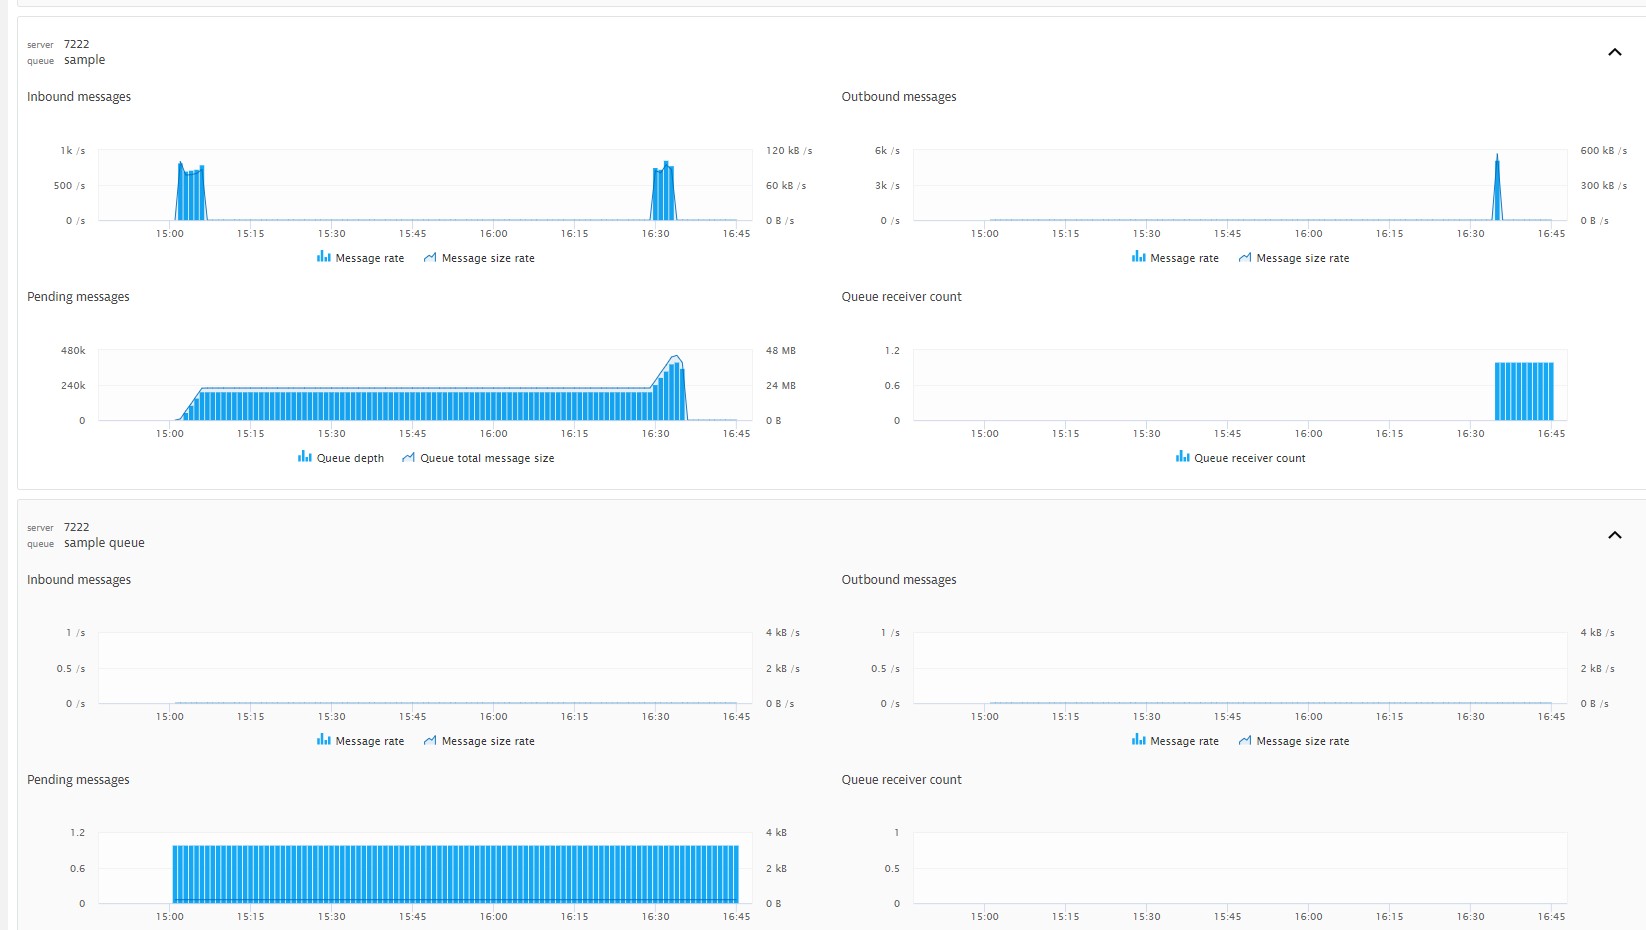
Captured Metrics
Queues
Queue Depth
Queue pending message size
Queue receiver count
Queue inbound message rate
Queue inbound message size rate
Queue outbound message rate
Queue outbound message size rate
Topics
Topic message depth
Topic message Size
Topic inbound message rate
Topic inbound message size rate
Topic outbound message rate,
Topic outbound message size rate
General information
Topics count
Queues count
Clients count
Sessions count
Producers count
Consumers count
Pending messages count
Pending messages size
Memory usage
Memory pooled
Synchronous storage size
Async storage size
Inbound message size rate
Inbound message count rate
Outbound message size rate
Outbound message count rate
Storage read size rate
Storage read count rate
Storage write size rate
Storage write count rate
Instance status
Requirements
- Tibco EMS 8.0+ on Windows or Linux
- OneAgent version 1.171+
- The dtuser account must be able to execute
tibemsadmin - A tibco account with sufficient rights to execute
showcommands viatibemsadmin
Known limitations
The extension can currently monitor up to 100 queues and 100 topics maximum per monitored host. You can use the Exclusion list on the configuration page to remove unnecessary queues and topics.
Interested in participating in the Preview?
If you’re interested in the Preview, and your environment meets the requirements, please complete the enrollment form.
For additional information about the Preview, please email the Platform Extensions team.


Looking for answers?
Start a new discussion or ask for help in our Q&A forum.
Go to forum