

Enterprise AI spending has never been higher. But when boards ask their teams to show the return, most organizations struggle to give a clear answer; not because AI isn’t delivering, but because they’re not measuring the right things.
Many enterprise AI projects can’t prove their return on investment. MIT’s GenAI Divide: State of AI in Business 2025 report finds that despite an estimated $30–40 billion in enterprise spending on generative AI, only around 5 percent of integrated pilots are extracting meaningful value. The vast majority show no measurable P&L impact. McKinsey’s State of AI in 2025: Agents, Innovation, and Transformation gets more specific on this: 88 percent of organizations now use AI in at least one function, but only 39 percent report any impact on enterprise-level earnings before interest and taxes (EBIT). Use-case benefits exist, but enterprise-level returns are harder to prove.
When executives report ROI but the P&L doesn’t move, the issue isn’t whether AI works. It’s whether success is being measured against outcomes the business can act on.
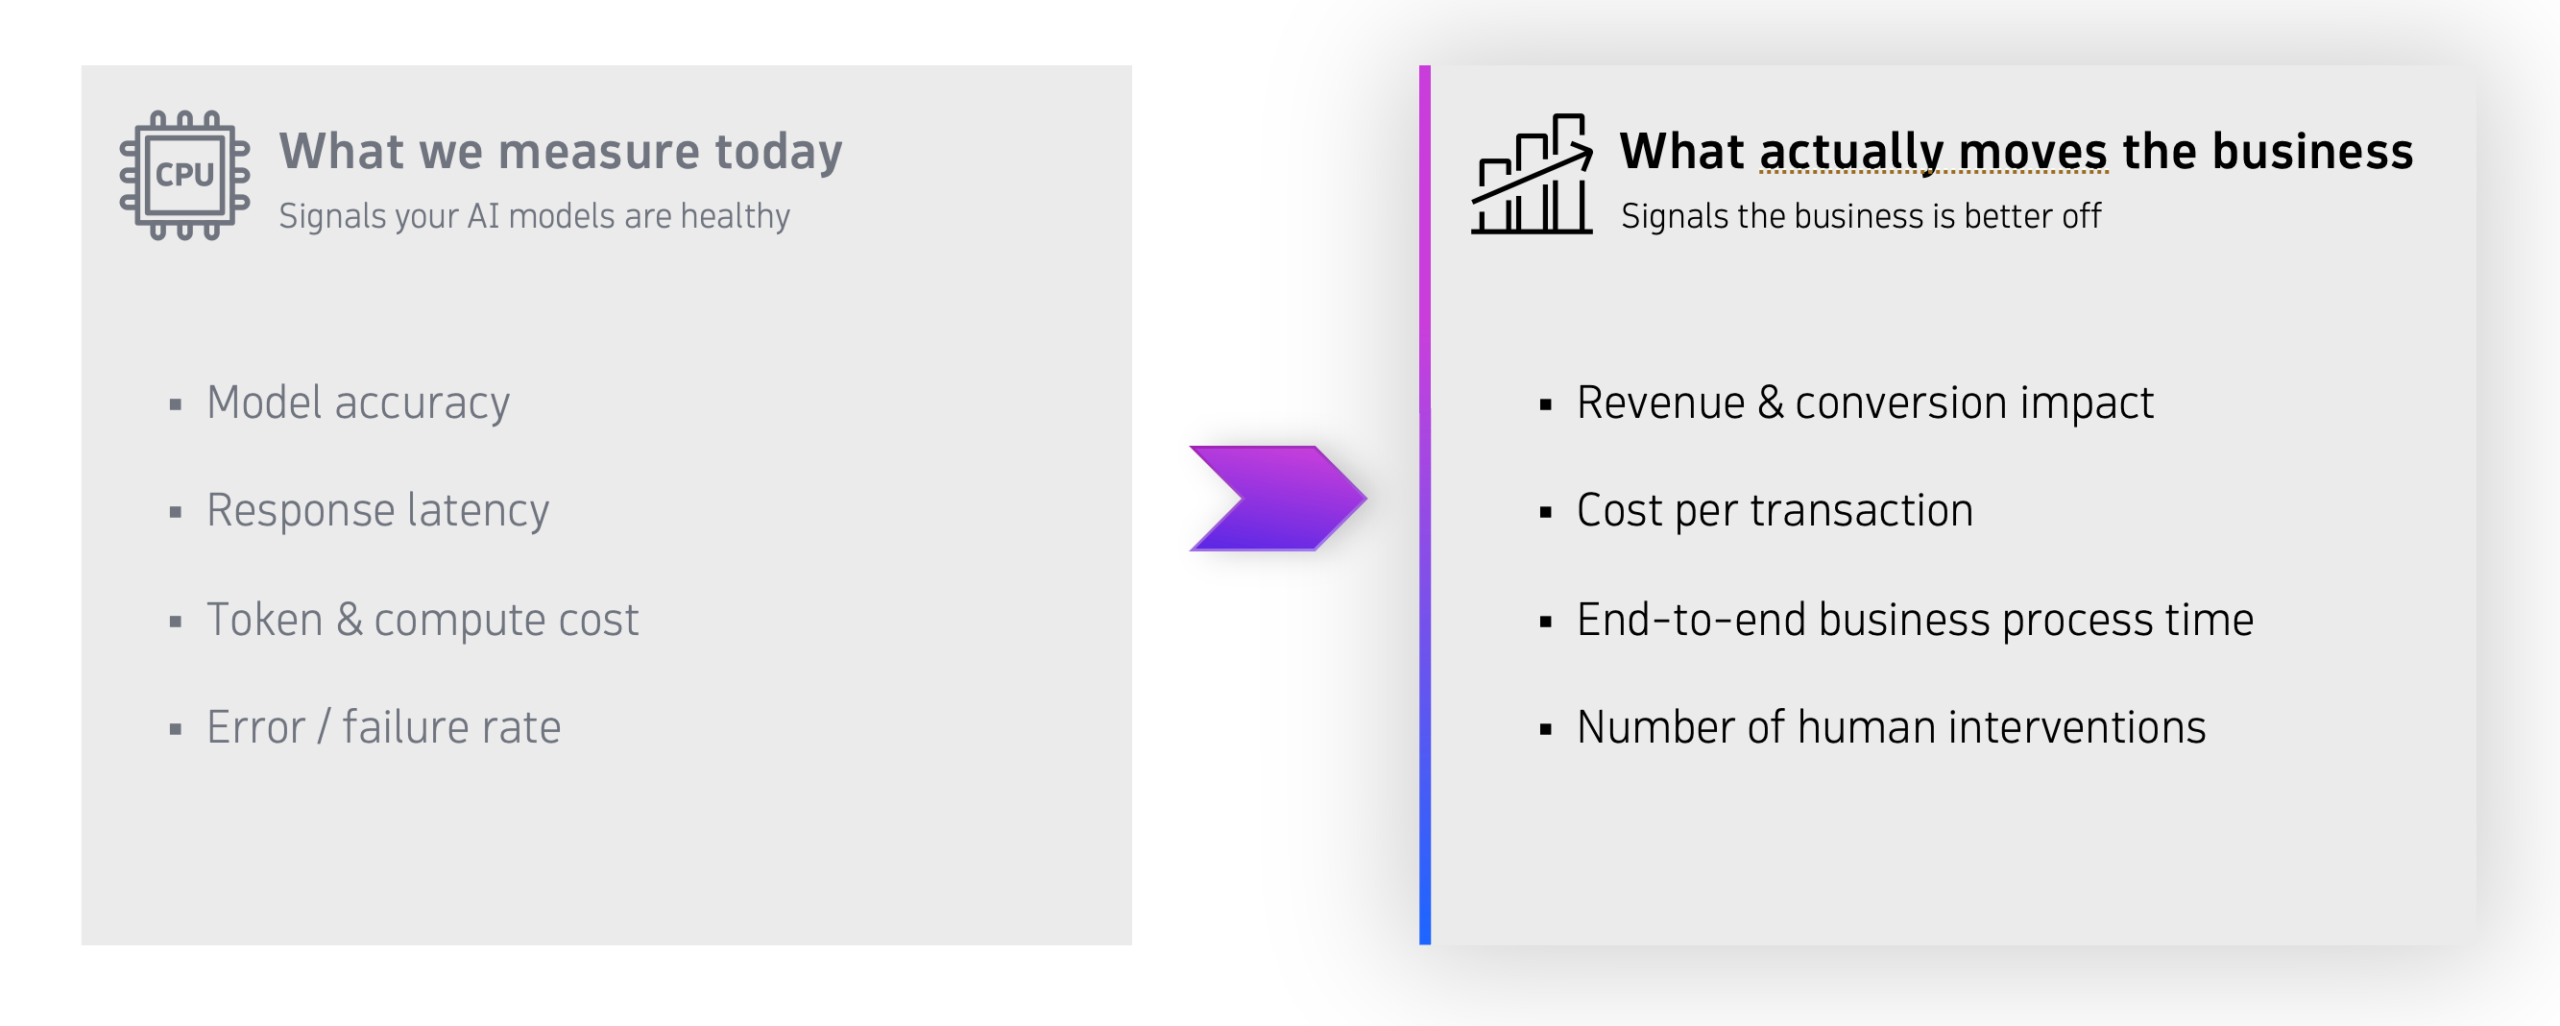
Teams often evaluate AI deployments with technical metrics such as model accuracy, response latency, token consumption, and error rates. These signals matter, but they answer a narrower question: how well the AI system is running, not whether the business is better off.
This is the gap observability must close. AI projects rarely exist on their own. They’re embedded in business processes that already had a job to do. McKinsey identifies workflow redesign as one of the strongest drivers of enterprise-level AI impact; the same survey finds that high performers are over three times more likely than their peers to use AI to fundamentally transform the business rather than just chase efficiency. The honest measure of an AI project’s value is whether that process, and the KPIs that describe it, visibly improved.
Why don’t technical AI metrics answer the ROI question?
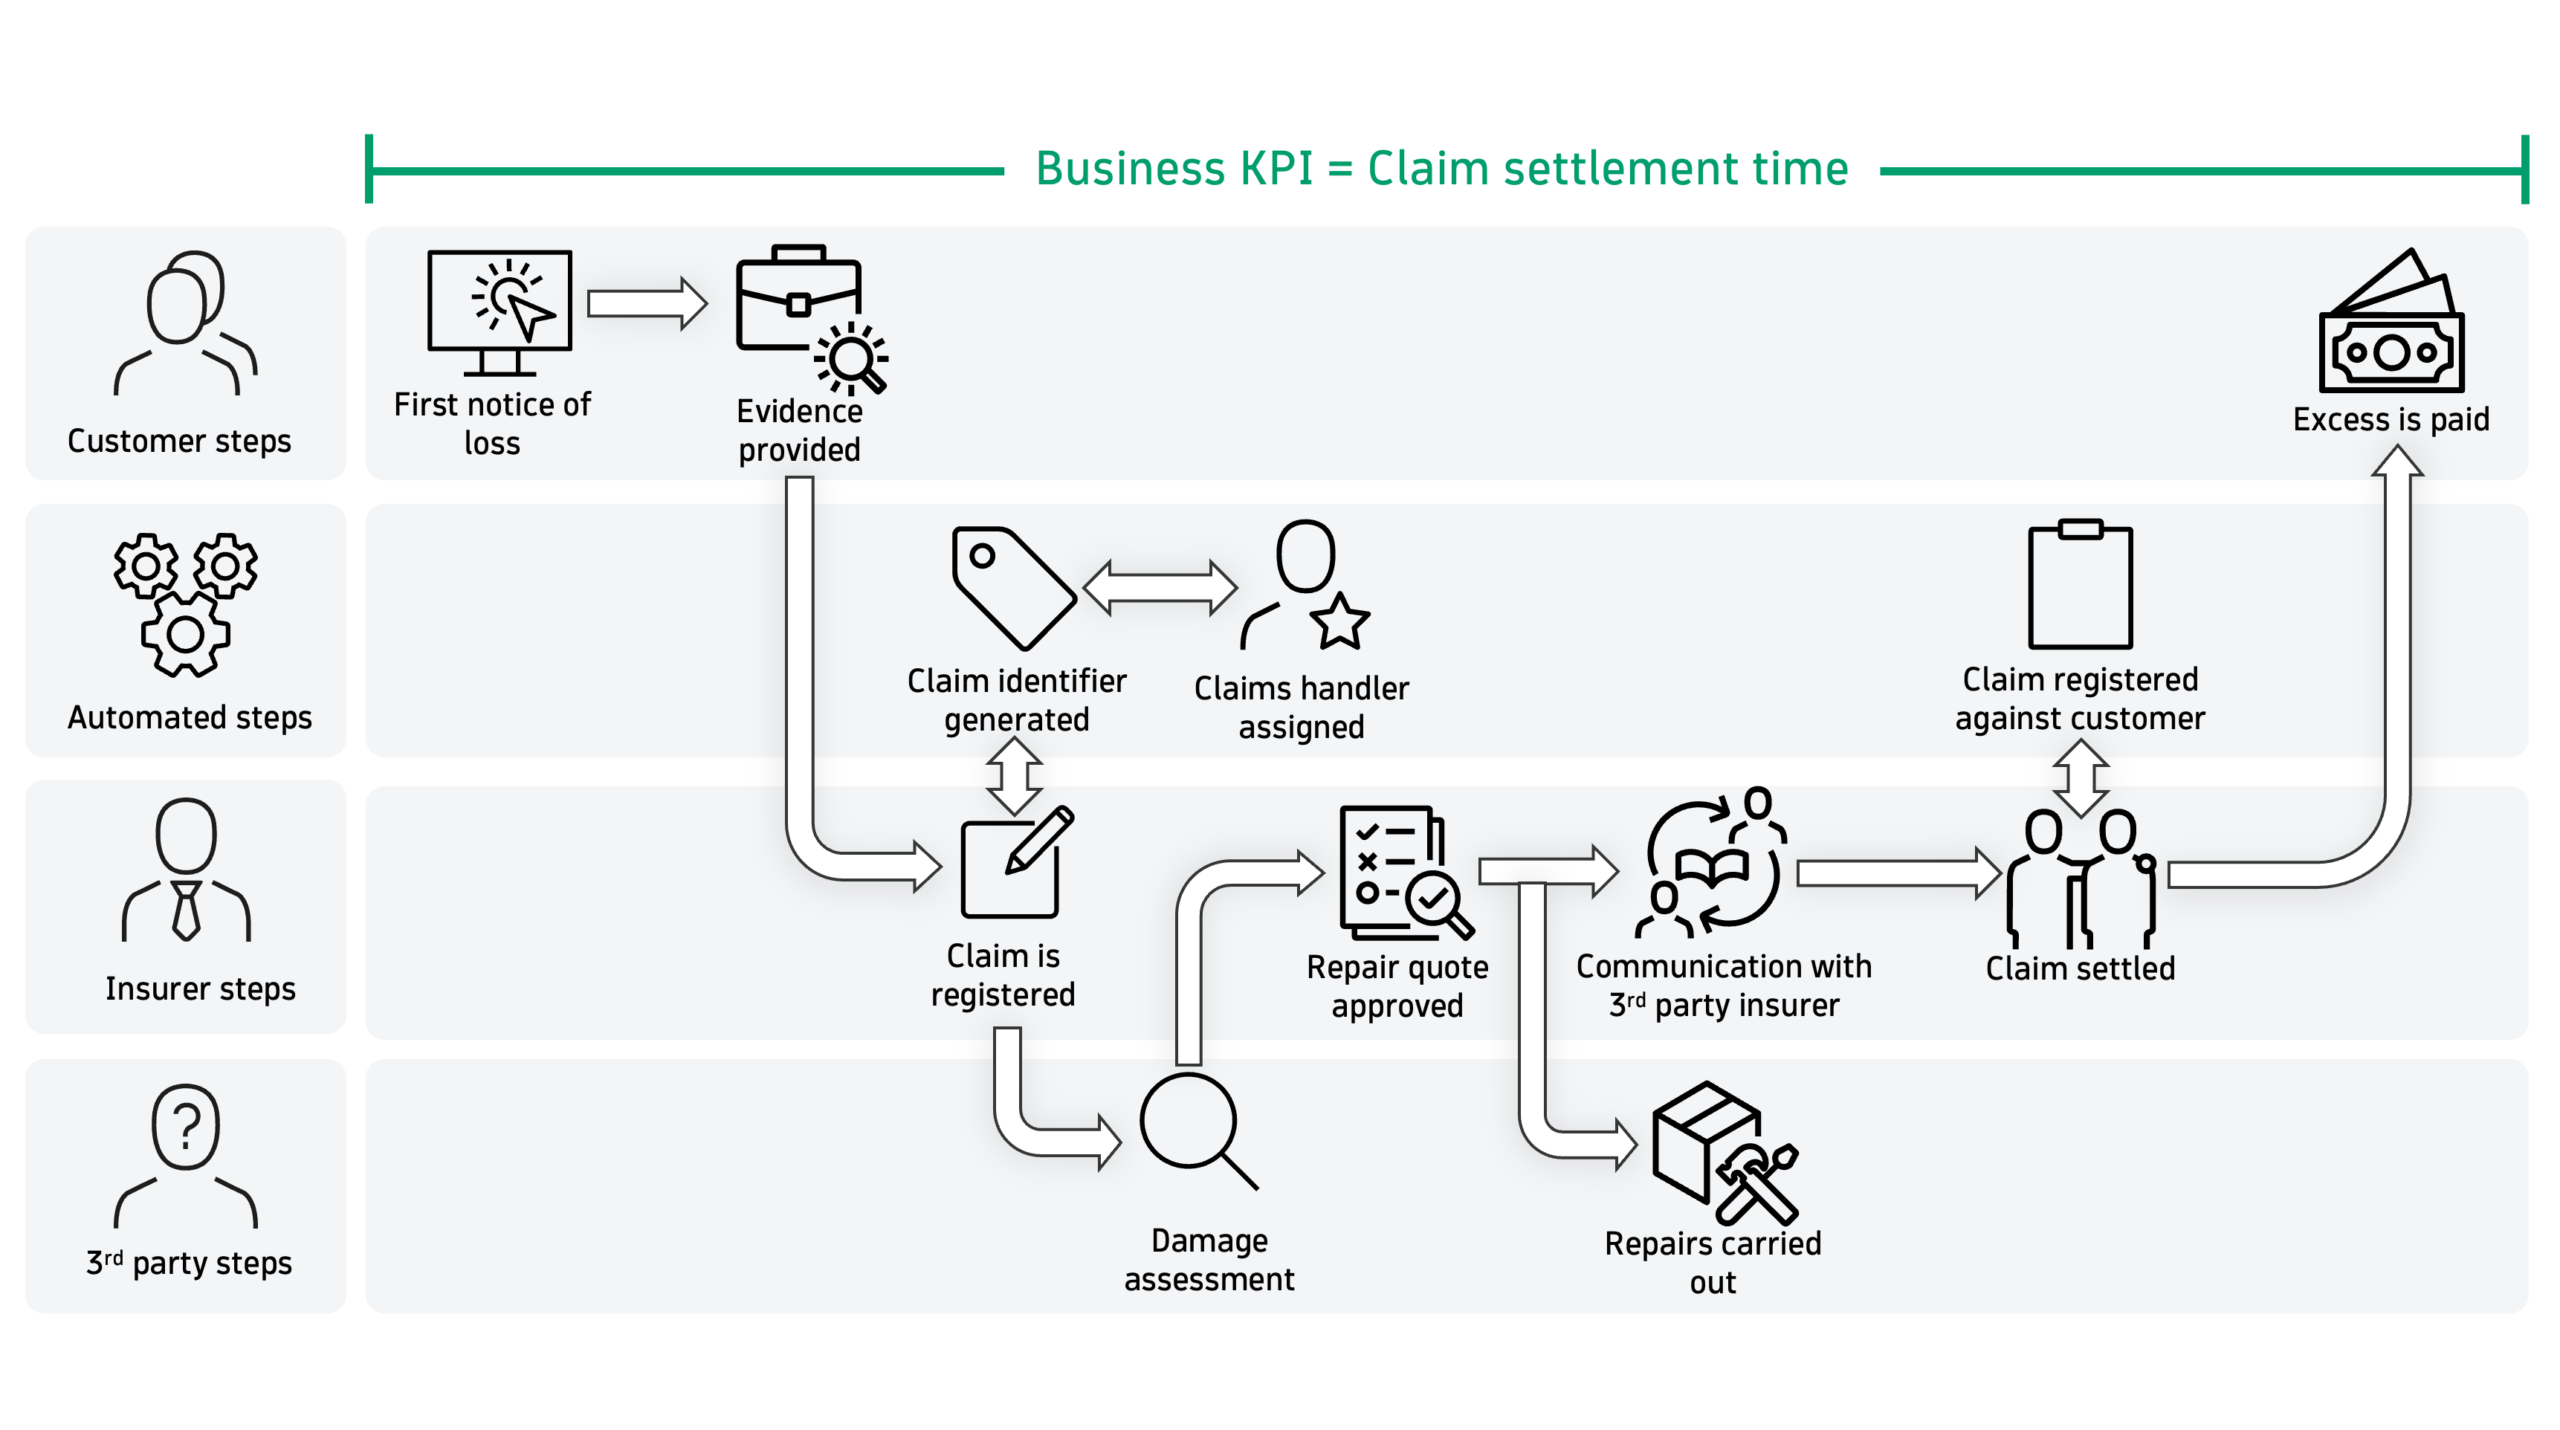
Imagine an AI agent inserted into an insurance claims pipeline. The model has 96 percent accuracy, sub-second response times, and a healthy token budget. Has it delivered ROI? You genuinely cannot tell from those numbers. The claims process might be settling 80 percent faster – or it might be settling at the same speed because a downstream bottleneck soaked up all the AI’s gains. The model dashboard looks identical either way.
According to Dynatrace State of Observability 2025 research, only around 28 percent of organizations align their observability data with business KPIs. That’s the gap. Most teams have ample telemetry; few have telemetry that connects to outcomes.
How do you measure AI ROI?
Almost every AI project plugs into an existing process: claims handling, customer onboarding, order fulfillment, support resolution or underwriting to name a few. The AI may automate a step, route a decision, summarize a document, or sit alongside a human as a copilot, but the process is what generates value what changes when the AI works.
That reframes the ROI question. Instead of asking, “Is the model performing well?” You ask: did the process get faster, cheaper, more accurate, or more responsive?
Examples of KPIs that belong on AI ROI scorecards include:
- Time to complete the business process.
- Cost per transaction.
- Customer lifetime value.
- Conversion.
- Customer satisfaction at close.
A four-step framework for measuring AI ROI
Once you accept the business process as the unit of measurement, ROI becomes a solvable management challenge.
- Instrument the process end-to-end: Capture every touch point. Not just where AI is going to be used, but the entire business process. You need to see individual claims, orders, or tickets flow through the process, not just aggregate dashboards.
- Baseline the process before AI goes live: Capture business process time, cost per transaction, customer satisfaction – whatever KPIs define a healthy version of the process. Without this, every later claim of improvement is just an assertion.
- Attribute the change: Isolate the AI’s contribution from seasonal volume, staffing changes, or upstream fixes. Treat it like any experiment: a control group exists, even if it’s just the version of the process from last quarter.
- Translate the verified delta into money: Time saved, revenue gained from higher conversion, SLA penalties avoided.
How Business Observability delivers each step
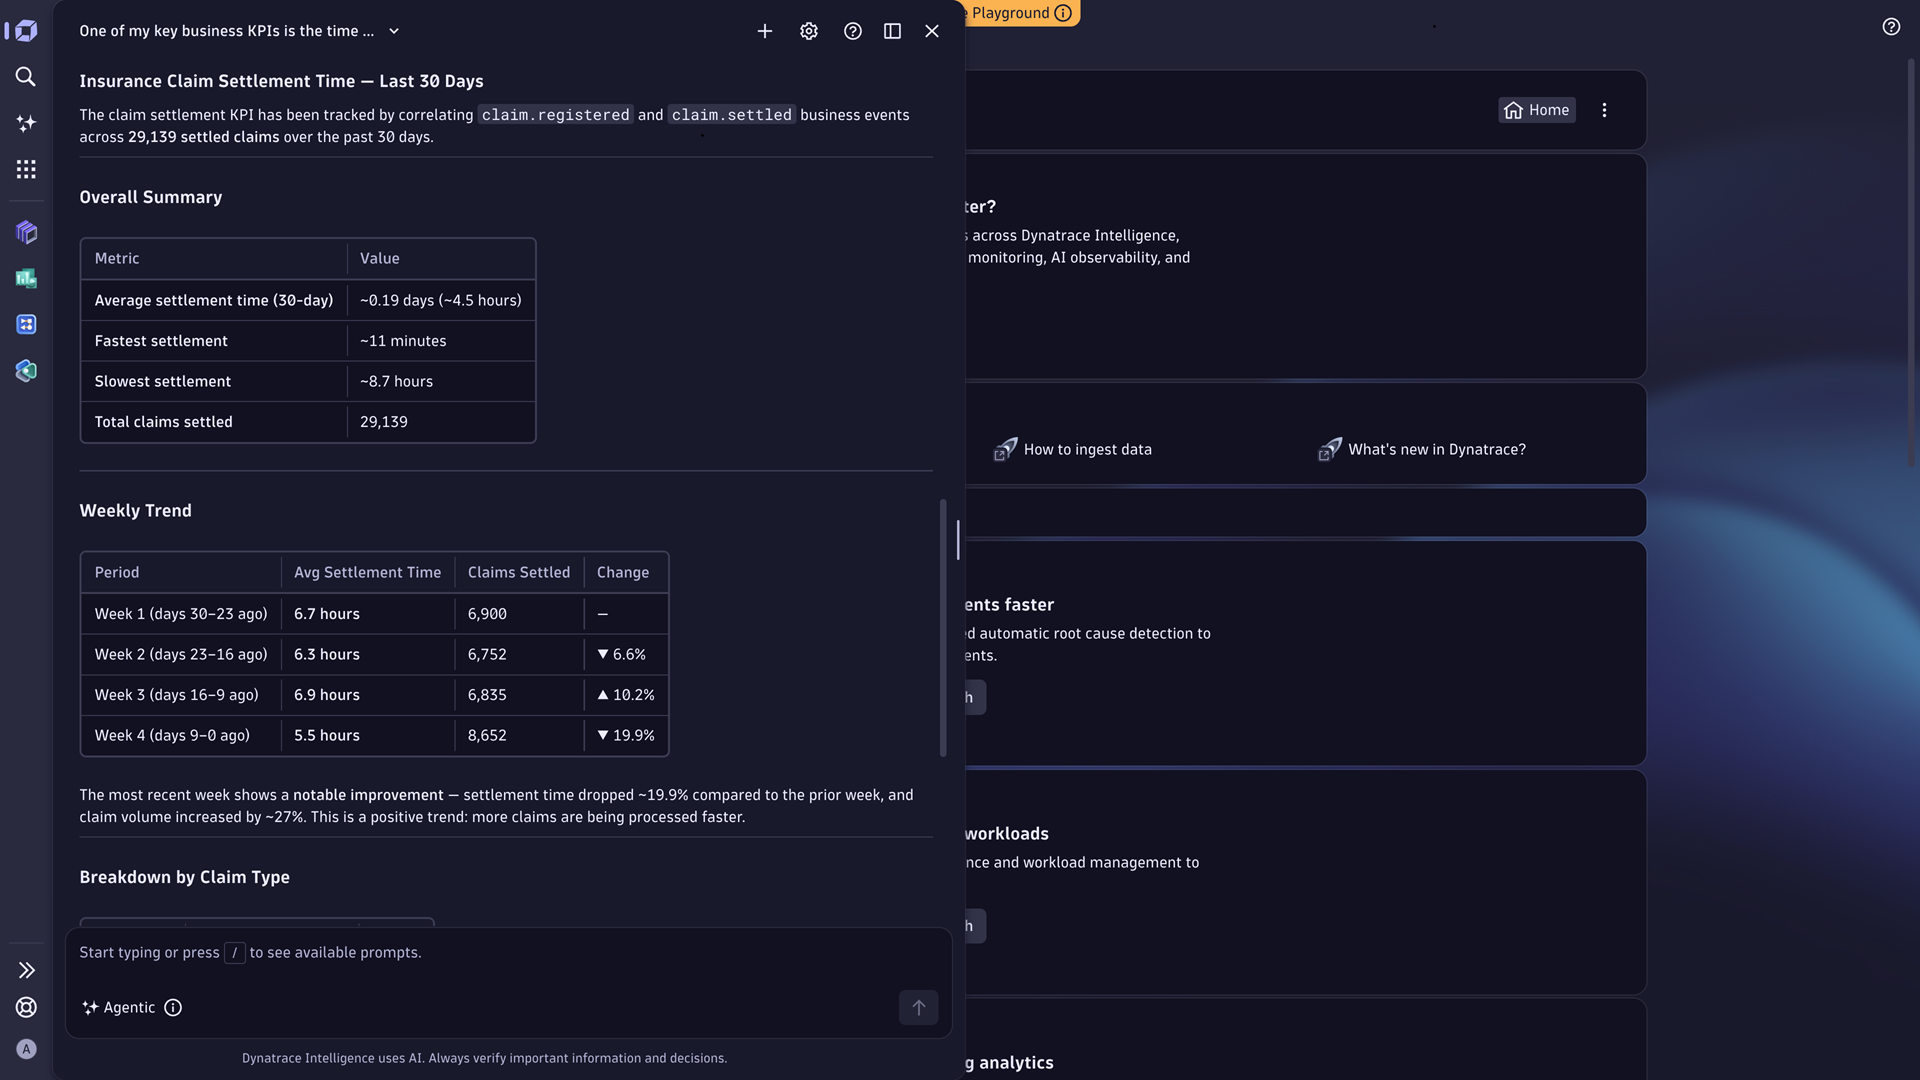
Dynatrace Business Observability tracks your business processes in real time, so you see individual transactions flowing through each step as they happen, not aggregate dashboards reviewed after the fact. KPIs are monitored alongside your full IT environment, so when something shifts — a system issue, a degrading AI model — you can isolate the cause immediately and know whether it’s affecting the business.
- Business events capture logical steps in your business process from transactions in-flight – so a claim, an order, or a ticket is observable as a first-class entity rather than a stack of disconnected logs.
- The Business Flow app stitches those events into a process view, connecting top-level KPIs to step-level analytics and individual instance traces.
- When something goes wrong, Dynatrace Intelligence can help you identify whether the cause is an IT issue, a model problem, or something else entirely.
All four steps of the framework can be run continuously. Baseline, instrumentation, attribution, and monetization should be an always-on capability, not a quarterly exercise.
Shift from “does the model work?” to “did the process get better?”
AI ROI isn’t a number you calculate once and present. It’s something you observe continuously, at the level of the business process, so you catch the quiet failures as readily as you celebrate the wins.
Business Observability enables teams to go from technical AI metrics to business outcomes, from quarterly post-hoc estimates to always-on measurement, and from “did we build it well?” to “did it actually move the business?”



Looking for answers?
Start a new discussion or ask for help in our Q&A forum.
Go to forum