Start server metrics monitoring in under 5 minutes!
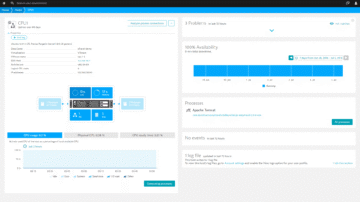
In under five minutes, Dynatrace shows you your servers’ CPU, memory, and network health metrics all the way down to the process level.
- Manual configuration of your monitoring setup is no longer necessary.
- Auto-detection starts monitoring new virtual machines as they are deployed.
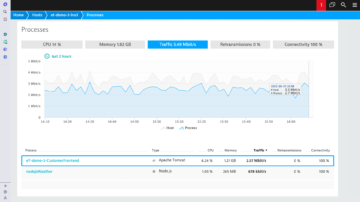
- Dynatrace is the only solution that shows you process-specific network metrics.
Get full insights into virtualized environments
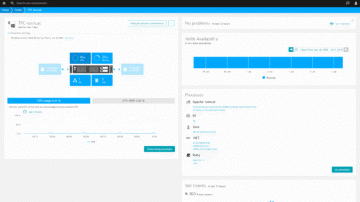
Dynatrace gives you a comprehensive overview of your virtualized network infrastructure. You’ll always know the status of your virtual hosts.
- See the impact of every vMotion event.
- Dynatrace automatically learns the baseline performance of your application under load, including response times, error rates, and behavior.
- You'll be notified instantly, if a code deployment results in unusually high resource consumption.
Monitor containers and cloud environments out-of-the-box
Ensure cloud-based application delivery and understand how your applications are deployed across cloud instances.
- See the full picture of your dynamic infrastructure in real time.
- Gain observability into containers from the application perspective without touching your images or making special configurations.
- Dynatrace automatically keeps up with any changes in your environment.
Understand the impact of issues on customer experience
Dynatrace not only monitors your servers, it learns the details of your entire application architecture automatically
- Artificial intelligence automatically identifies the dependencies within your environment.
- Dynatrace detects and analyzes availability and performance problems across your entire technology stack.
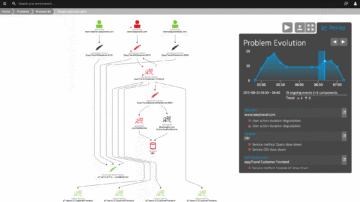
- Visualize how problems evolve and how they impact the user experience.
Sign up for Dynatrace host & server monitoring today

A Leader in the 2025 Gartner® Magic Quadrant™ for Observability Platforms
Read the complimentary report to see why Gartner positioned us highest for Ability to Execute in the latest Magic Quadrant.
This graphic was published by Gartner, Inc. as part of a larger research document and should be evaluated in the context of the entire document. The Gartner document is available upon request from Dynatrace. Dynatrace was recognized as Compuware from 2010-2014.


