
Lookup tables are a simple feature with serious leverage. They give your team a lightweight, maintainable way to layer business context onto your observability data at query time so your raw telemetry stays clean and enrichment remains flexible.
Observability data can tell you a lot, but often not in a language that your business understands. Traces fire, business events flow, and dashboards light up, yet P1 incidents still break out. The first question from the war room is typically, “Who’s impacted?” Too often, the honest answer is, “Let me check the database and get back to you.” This gap between raw telemetry and human-readable business context is exactly what lookup tables in Dynatrace are designed to close.
In our introductory blog post on Dynatrace lookup tables, we explained the fundamentals: what lookup tables are, how to ingest them, and initial use cases spanning security to business context enrichment.
In this blog, we’ll go deeper, with real-world examples of lookup tables, practical patterns, and how teams are already putting them to work.
The problem: Dashboards display cryptic identifiers, not insights
Daniel Adams, Observability Engineer at FreedomPay, put it plainly in a recent Dynatrace Tips & Tricks session:
“A lot of our apps are not coded to show customer names or plain text human-readable stuff. It’s mostly IDs being passed back and forth.”
The result is that dashboards are filled with cryptic identifiers that operations teams and business stakeholders can’t mentally decode. And splitting data by customer, country, or store requires trips back to the SQL database for further contextual configuration.
Many organizations that run distributed systems at scale face the same challenge: telemetry is rich, but the business context is missing.
The solution: Use lookup tables to make your reference data available in Grail
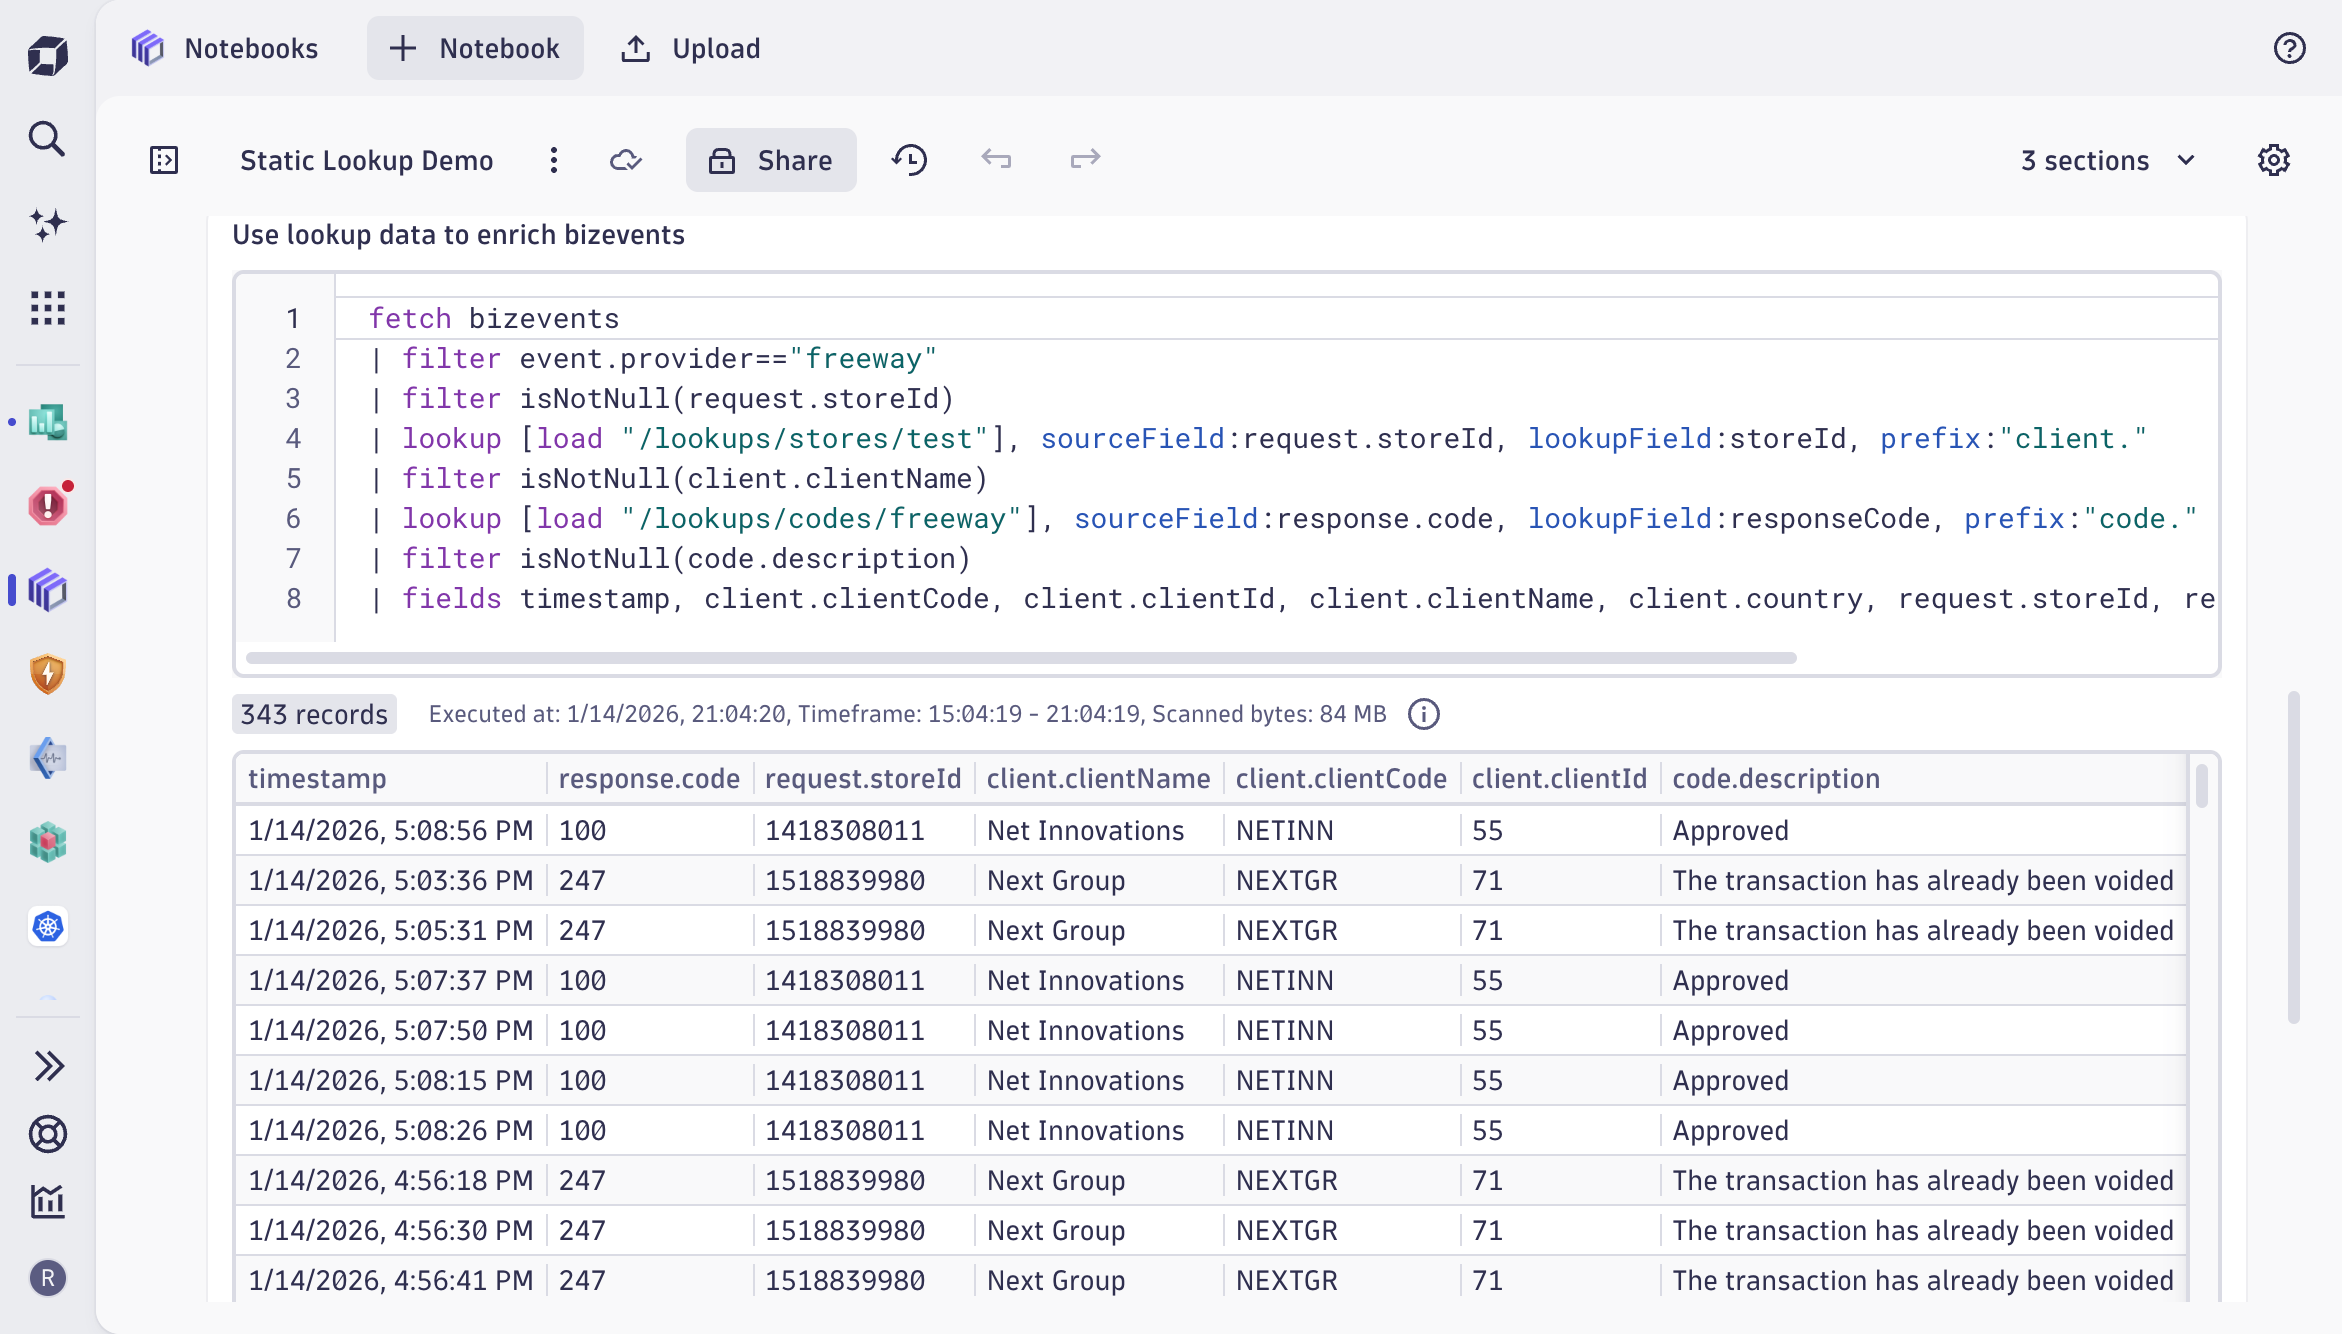
Lookup tables let you upload reference data (CSV, JSON, or XML files) directly into Dynatrace Grail®, where it lives alongside your logs, traces, metrics, and business events. Once uploaded, two DQL commands unlock the enrichment from your lookup tables:
- Load fetches the contents of a lookup table, working just like querying any other data type in Grail.
- lookup joins records from your observability data with matching rows in the lookup table, using a defined key field.
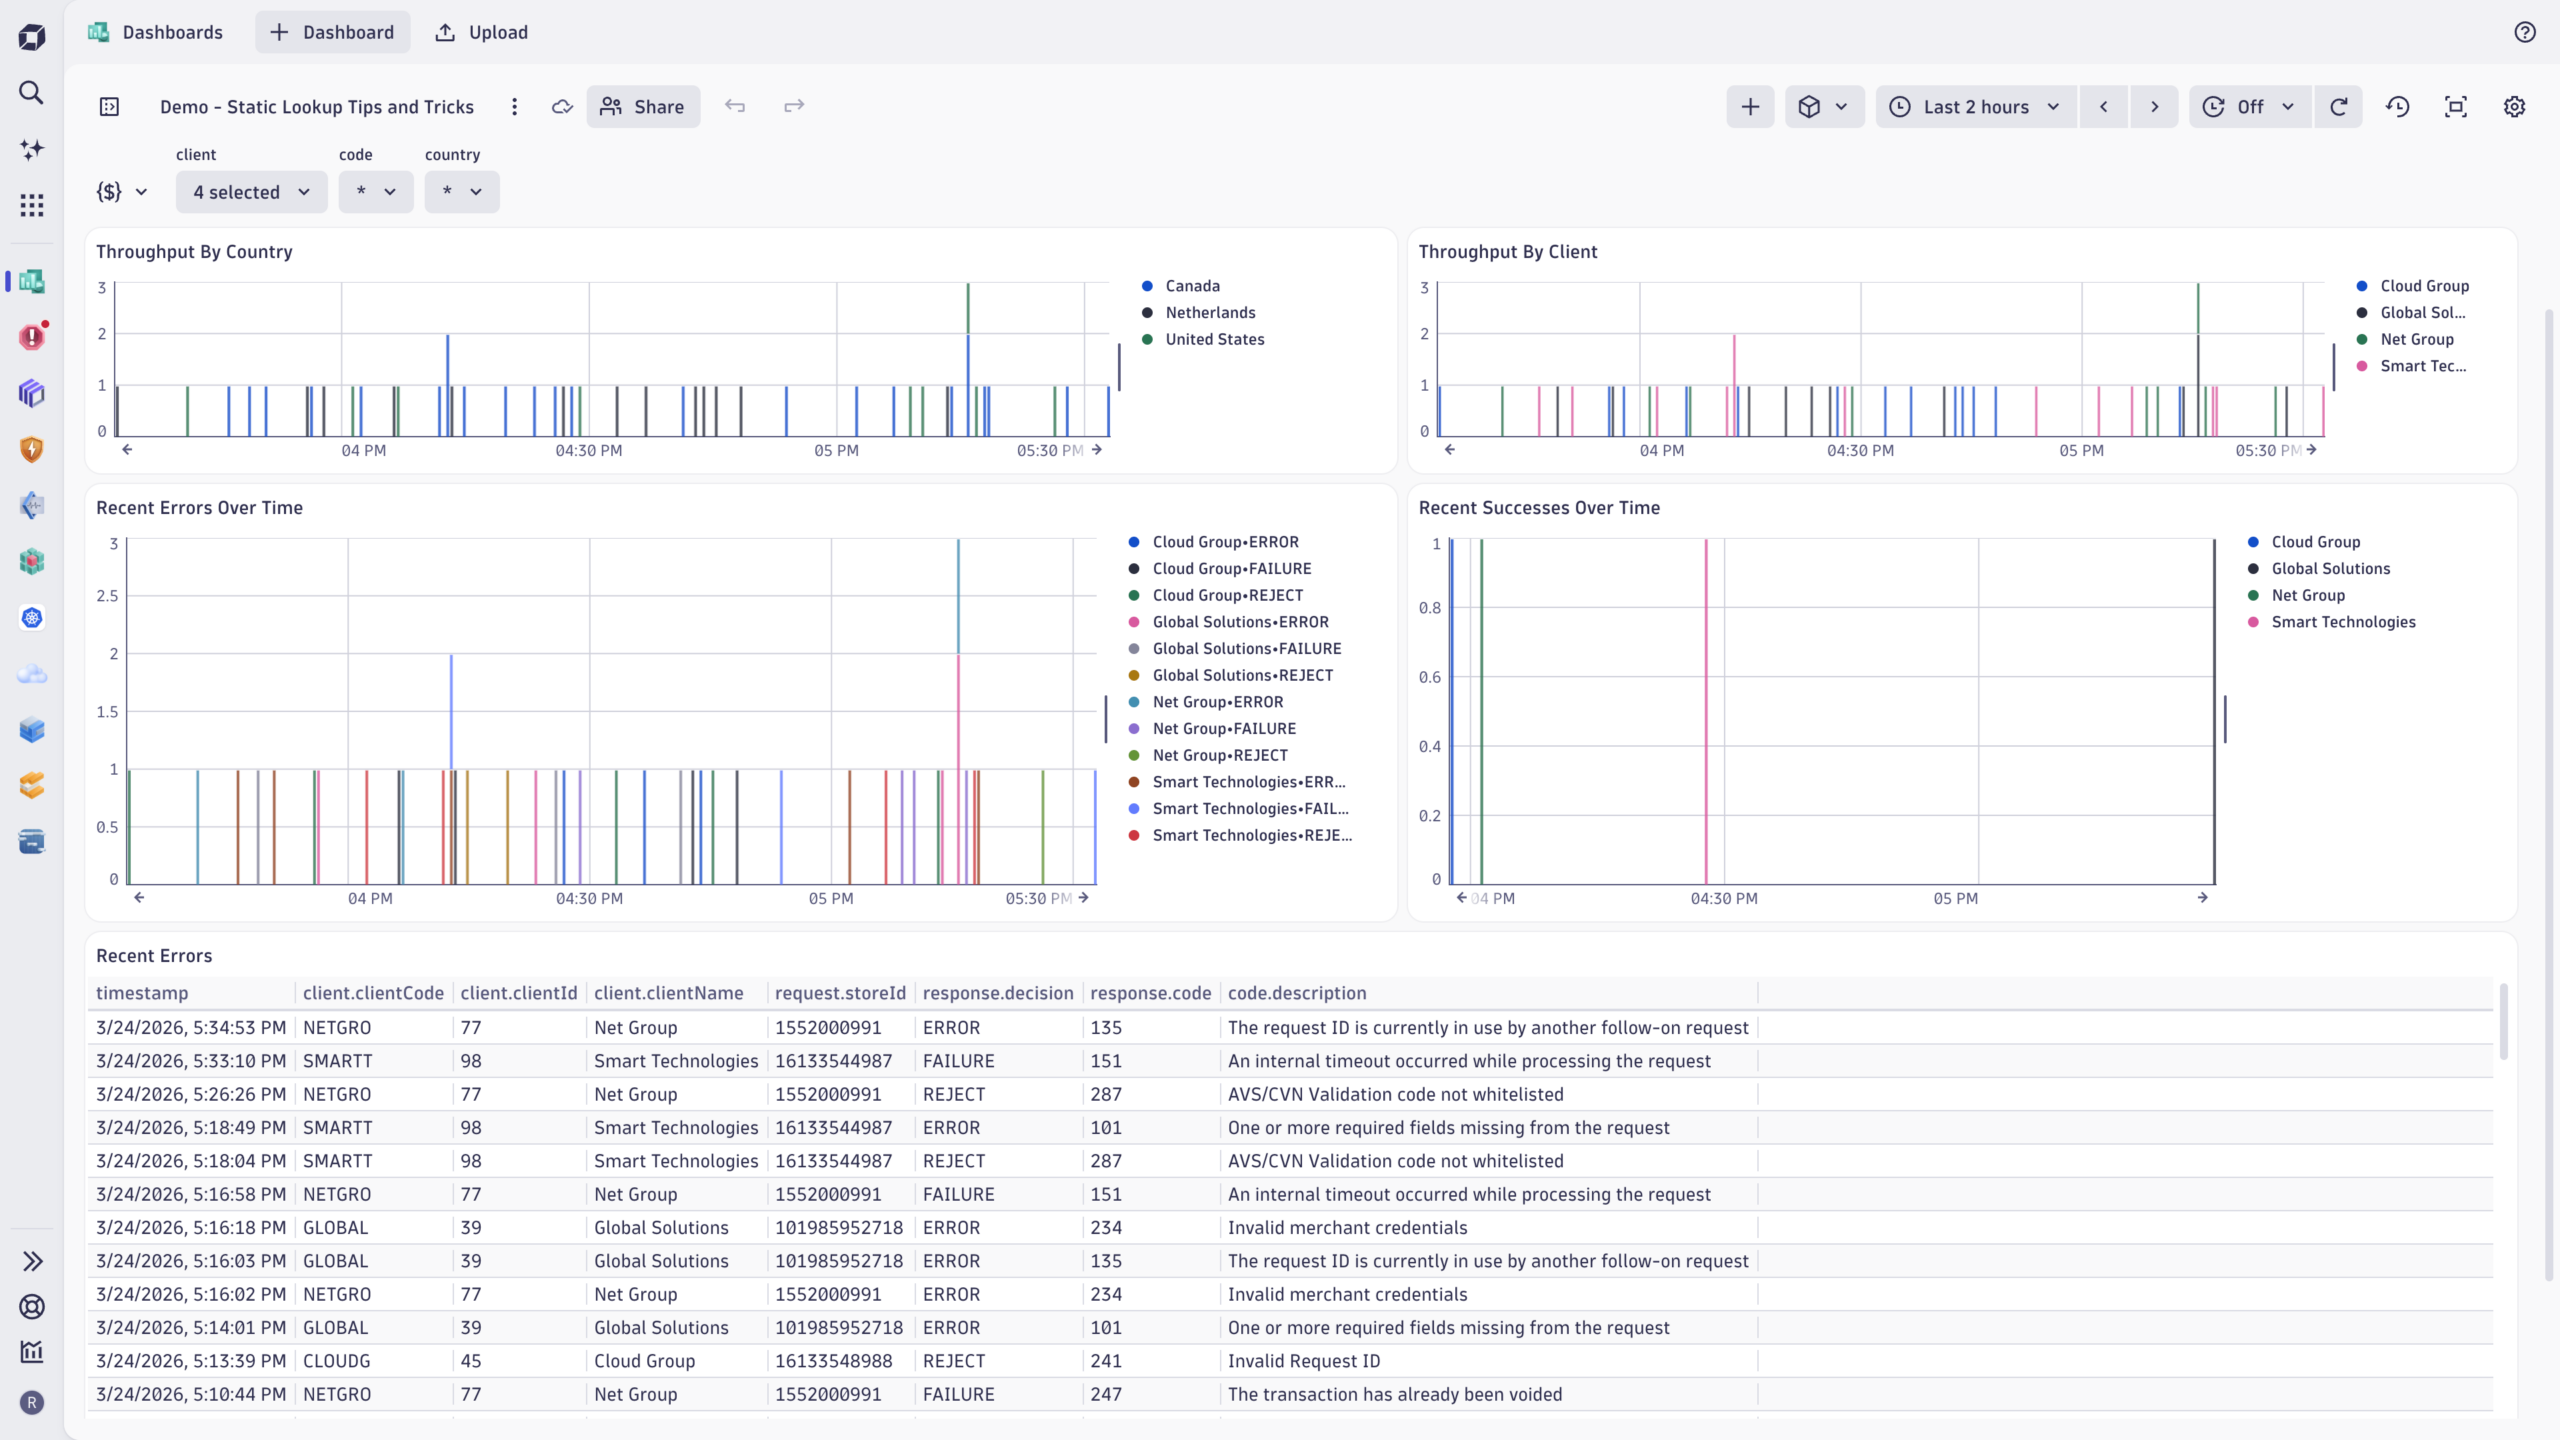
In FreedomPay’s case, the lookup table holds customer names, customer codes, store IDs, and countries. The join key is the store ID, the same cryptic identifier that was previously displayed on their dashboards. One DQL lookup command later, those IDs become readable names, and the data can be split by country, grouped by customer, and surfaced in a dashboard that anyone on the team can use.
Lookup tables reduce user cognitive load
The impact of lookup tables is not just cosmetic. Daniel described the before-and-after in P1 situations:
“Previously, everyone was asking: who’s impacted, which customer? Now it’s just very apparent and real-time. People can share screenshots directly from Dynatrace.”
The shift from “let me go check” to “it’s right here” compresses triage time and reduces the cognitive load on everyone in the room.
Beyond incident response, lookup tables also power dashboard variables. FreedomPay uses dashboard variables to populate dropdown filters (for example, clients and countries) directly from the lookup table itself, keeping the UI dynamic without manual maintenance. The load command behaves like any other fetch command but operates on reference data rather than telemetry, making it a natural fit for driving interactive dashboards.
And the enrichment isn’t limited to business events. The load and lookup commands work across all data types in Grail.
In practice: cost allocation with lookup tables
Cost allocation is a good example of how lookup tables bridge the gap between operational data and business reality. Many organizations already maintain mappings that associate users, teams, or services with products or cost centers, but that context rarely lives inside observability data. Lookup tables allow you to introduce such context.
Consider DPS (Dynatrace Platform Subscription) consumption driven by user activity such as running queries, triggering automation, or executing functions. On its own, such usage is hard to attribute to a specific part of the organization. By associating users with products or cost centers in a lookup table, you can attribute usage to organizational ownership rather than just technical activity, align cost views with existing financial or product structures, and keep that attribution logic centralized and reusable rather than embedding it in individual analyses.
What makes this pattern scale is that business mappings change over time, while usage data continues to flow. Lookup tables allow you to evolve the mapping without rewriting your analyses. The same mechanism used for cost allocation works equally well for mapping users to teams, services to portfolios, or environments to internal programs. Cost allocation simply highlights how powerful this becomes when operational data is interpreted through a business lens.
Importantly, this is just one way to approach cost allocation, not the only way. Some teams rely on host-based attribution, others on pipeline metadata or external financial systems. Lookup tables complement these models by making it easy to incorporate existing reference data wherever it adds clarity.
Keeping lookup data fresh
For lookup tables to deliver lasting value, their data must remain current. FreedomPay currently uses Postman to push updated CSVs via the upload API, but they’re building automation to pull this data from their SQL backend daily and sync changes using the overwrite: true parameter. The lookup table path stays the same; the data underneath gets refreshed. Downstream dashboards and queries are updated automatically.
More broadly, there are several approaches to keeping lookup data up to date:
- Dynatrace Workflows automate extraction and upload from SQL databases or APIs on a schedule.
- Periodic refresh updates your lookup data programmatically as part of CI/CD or data sync processes.
- Manual refresh uses Postman, cURL, or other API-based uploads with the overwrite flag when data changes infrequently.
Dynatrace lookup tables are now generally available
With the release of Dynatrace SaaS version 1.334, lookup tables are generally available for all customers running Dynatrace SaaS with an active Dynatrace Platform Subscription (DPS). GA brings production-readiness, improved query performance for the lookup command, and full integration with Grail’s scalability and access controls.
To get started
- Identify a data enrichment use case: cost allocation, customer context, error code mapping, or security allow lists.
- Prepare your reference data as a CSV, JSON, or JSONL (JSON Lines) file.
- Upload the file to Grail using the Dynatrace API, Workflows, or a custom app.
- Use the load and lookup commands in your DQL queries, notebooks, and dashboards.
For detailed instructions, visit our lookup data documentation. And to see how FreedomPay built its implementation from end to end, watch the full demo on YouTube.


Looking for answers?
Start a new discussion or ask for help in our Q&A forum.
Go to forum