
In this blog, I will be going through a step-by-step guide on how to automate SRE-driven performance engineering. You may have seen over the past few months we have been extensively promoting Service Level Indicators (SLIs) and Service Level Objectives (SLOs) as part of our Open Source project Keptn. Keptn uses SLO definitions to automatically configure Dynatrace or Prometheus alerting rules. If an alert is triggered, Keptn automates operational tasks such as triggering remediation actions. Keptn also uses the same SLOs to validate that these operational actions had the desired impact.
While Google’s SRE Handbook mostly focuses on the production use case for SLIs/SLOs, Keptn is “Shifting-Left” this approach and using SLIs/SLOs to enforce Quality Gates as part of your progressive delivery process. After a new build gets deployed and automated tests executed, SLIs are evaluated against their SLOs and, depending on that result, a build is considered good (promoted) or bad (rolled back).
“The earlier in the lifecycle we ensure SLIs meet their SLOs the better it will to ensure these service levels in production”.
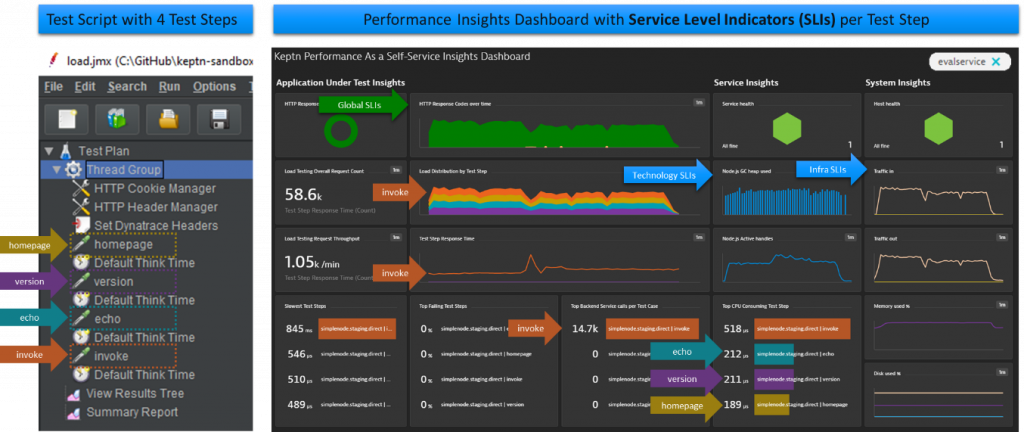
Now, while we’ve been pushing these concepts in Keptn we haven’t explained well enough how to level-up your existing load testing scripts for better SLI monitoring and how to integrate them with Dynatrace in order to reap all the benefits of SLI-based Performance Analysis. This is what this blog is all about. Its a detailed tutorial blog that explains how you can make the first steps towards SLI/SLO-based Quality Gates. Let me walk you through how I have built my Dynatrace Performance Insights Dashboard showing SLIs split by Test Name as well as SLIs for the specific technology and infrastructure:
While I’ve included the automation script that creates the above dashboard, request attributes and calculated service metrics in Dynatrace as part of my Keptn Tutorial titled “Progressive Delivery with Keptn using Dynatrace” I didn’t explain how I got to this point so that anybody can replicate this in their own environment, with their own test scripts on their own applications.
So, let’s walk through the individual steps.
Step-by-step guide: SRE-driven performance analysis with Dynatrace
For this blog I will be using the same Node.js based sample application as in some of my Keptn Tutorials. If you want, you can use the same sample app and follow my steps – or – just apply the same concepts to your own environment! The app description and supporting files such as load testing scripts are on the Keptn Example GitHub
If you’re short on time, or want to see all of this in action instead then, please check out my Performance Clinic: Automated SRE-driven Performance Engineering with Dynatrace”
Step #1: Monitoring your test environment
Firstly, start by installing the Dynatrace OneAgent on the hosts where you’ll be running your application test. If you have a distributed environment with multiple servers hosting your webservers, app servers, and database, I suggest you install the OneAgent on all these servers to get full end-to-end visibility. If your apps are deployed in a PaaS Platform, e.g: Kubernetes, OpenShift, Cloud Foundry or Azure Web Apps then install the OneAgent by following the OneAgent PaaS installation options.
In my example, I’m going to run my sample node.js based application on an EC2 Linux machine using Docker. For that I simply followed the OneAgent installation instructions for Linux. Once installed I get full visibility into that host:
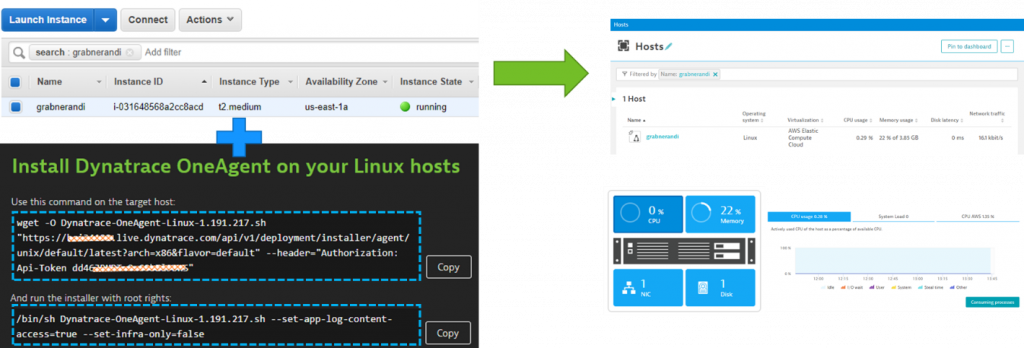
Step 1 accomplished! Now our environment where we’ll be deploying our application under test is now automatically monitored by Dynatrace!
Step #2: Deploy our application
Now let’s deploy our application. If you use your own application and it was already running before you installed the OneAgent, please restart your application and web servers. This will enable deep monitoring of those Java, .NET, Node, processes as well as your web servers. Please note – there is no need to restart your database servers.
In my case, I’m going to deploy my simple node application. This could either be done by deploying it on a k8s cluster or runnning it as a simple docker container. In this circumstance, I’m going to opt for a simple docker on my EC2 machine by executing the following command: docker run -p 80:8080 grabnerandi/simplenodeservice:1.0.0
After it’s deployed, verify that the application is up and running by accessing it through its public IP. Once Dynatrace sees the incoming traffic it will also show up in Dynatrace, under Transaction & Services. From here, you can explore the first service details:
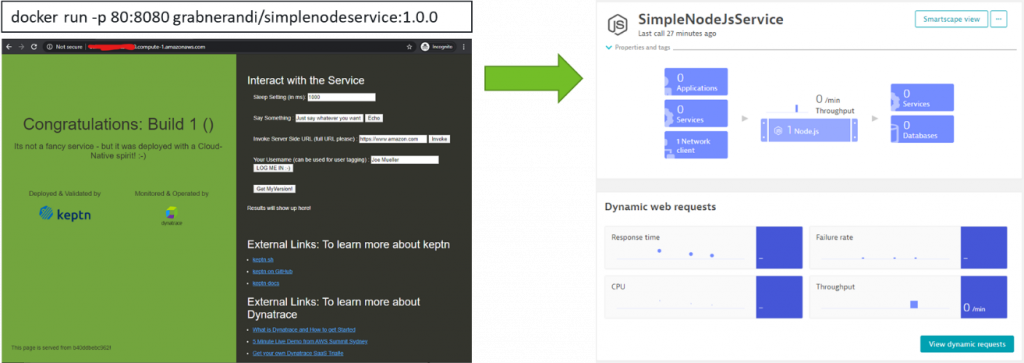
Step 2 accomplished: We have deployed an application that is fully monitored with Dynatrace!
Step #3: Tagging of services
A key concept in monitoring is proper tagging. Tagging allows you to better organize your monitoring data. In Dynatrace, tagging also allows you to control access rights (via Management Zones), filter data on dashboards or via the API as well as allowing you to control calculation of custom service metrics or extraction of request attributes.
There are multiple ways to define tags and metadata in Dynatrace:
- Manual Tagging: Put them on service and the process group via the UI or the Dynatrace API
- Automated Tagging: Define a rule that tag entities based on existing metadata
- Cloud & Platform Tags: Extract tags & annotations from k8s, OpenShift or Cloud Foundry
- Environment Tags: specify tags via the DT_TAGS environment variable
In my example below, you’ll see I’ve tagged the service and processes my services run on with a tag called “AppUnderTest”. While I could have done this manually I have decided to automate this tagging by passing DT_TAGS=AppUnderTest to my container startup parameters. Here is my adapted docker run command: docker run -p 80:8080 –env DT_TAGS=AppUnderTest grabnerandi/simplenodeservice:1.0.0
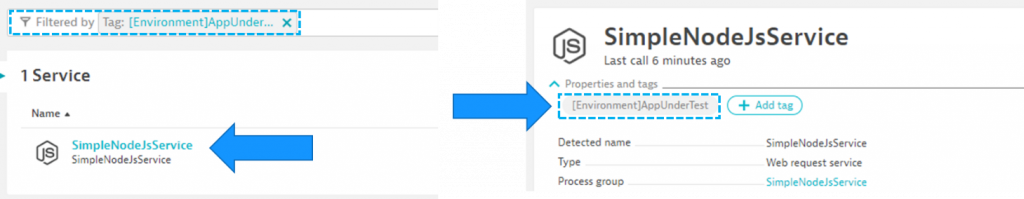
Step 3 accomplished: Our application under test is now automatically tagged. These tags will allow us to create dashboards, request attributes or calculate service metrics specifically for our application under test. At a later stage, these tags allow us to automate data analysis through tools such as Keptn which provides an SLI/SLO based approach of performance analysis. Tags play a critical role there as well as it allows us to define which entities to have automatically analyzed.
Step #4: Tag your Load Testing steps
Dynatrace by default captures and traces every single incoming request on our instrumented applications and services. This allows us to analyze metrics (SLIs) for each individual endpoint URL. While this is great, the URL is not necessarily meaningful when we want to analyze details for a step from your load testing script, e.g: Login, Add to Cart, Checkout.
For my sample application, I’ve prepared a simple JMeter based test script which contains four test steps: homepage, invoke, echo and version.
When analyzing test results, I want to see the same test step names in Dynatrace so it’s easier for me to focus my diagnostics on these four steps instead of using URLs. To pass information such as Test Step Name (TSN), Load Test Name (LTN), Load Script Name (LSN), Virtual User Id (VU) and others we can follow the load testing integration best practice as documented in Dynatrace and load testing tools integration. The best practices describes how testing tool can add an additional HTTP Header called x-dynatrace-test to each simulated request. The value for x-dynatrace-test is a set of semicolon separated name=value pairs including information such as TSN, LTN, LSN, VU … – the following screenshot shows my JMeter script and the corresponding x-dynatrace-test header for two of my four test steps:
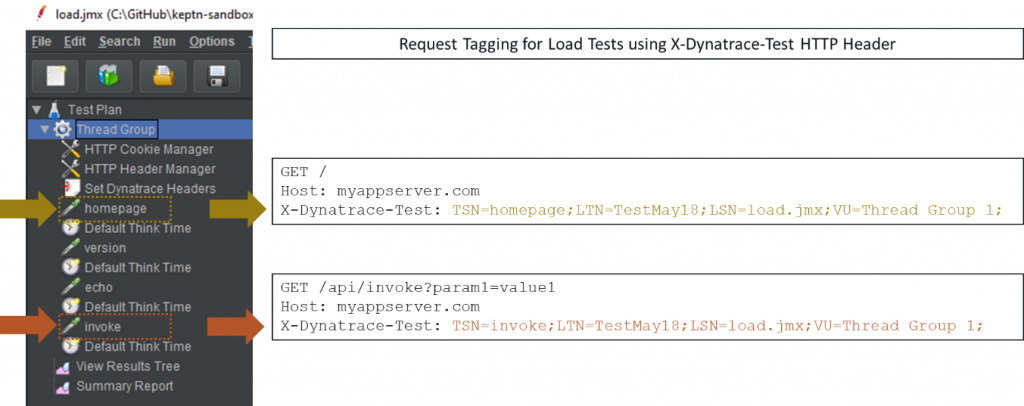
Adding this custom header will be specific to the testing tool you use. If you’re using JMeter feel free to look at my sample load.jmx JMeter script that you can find in the example GitHub repo. For other tools either check out our documentation for Neoload, LoadRunner or JMeter. For any other tool I’m sure there’s a documented feature that allows you to add a custom HTTP Header with the documented format to your test requests. Neoload stands out as they have built an integration that automates many of the Dynatrace configuration steps.
Step 4 accomplished: When executing our test script, every request contains additional context information about the test script, load test name and test step as part of the x-dynatrace-test http header. This information can now be used in Dynatrace for Request Attributes and Calculated Service Metrics.
Step #5: Create Request Attributes in Dynatrace
Now that every simulated HTTP Request from our testing tool contains additional context information we can configure Requests Attributes which will instruct Dynatrace to pull out these name/value pairs and add it as context data on every single PurePath. Once this is done we can use this data for filtering and focused diagnostics, e.g: only show me requests that came in for TSN=homepage and LTN=TestMay18.
Request Attributes are rules that get applied to a certain set of Dynatrace monitored service entities. They allow you to extract meta data from a data source, e.g: HTTP Headers, URL, and then allow you to specify whether you want the full value or just a part of it. To make yourself familiar with Request Attributes I suggest you check out Basic Concepts – Request Attributes (doc).
In our case we want to create 4 rules that extract the individual name value pair (TSN, LTN, LSN, VU) from the x-dynatrace-test header. The following shows the screenshot of a rule for TSN. Be aware that it is a best practice to additionally limit this rule to only apply to certain technologies or services. Also be aware that the extraction where it says “between TSN= and ;”:
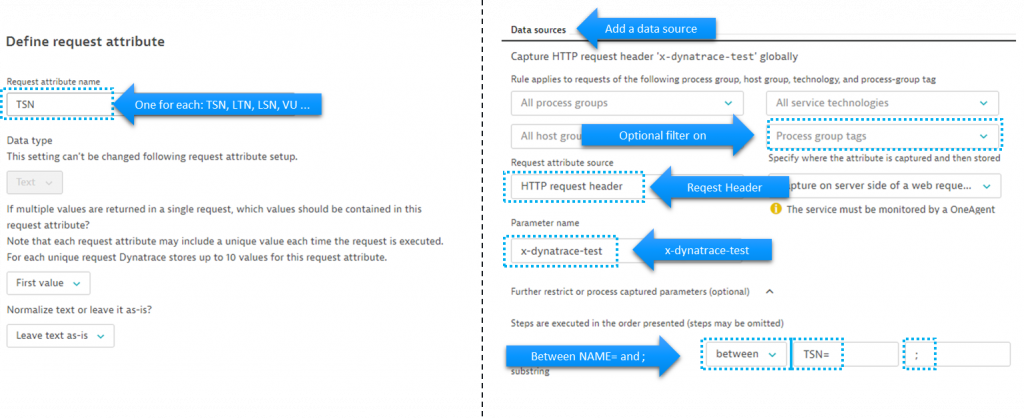
Not only can we create these rules through the UI. We can also automate them through the Dynatrace Configuration API. As part of my example GitHub tutorial repo you find a script that is called createTestRequestAttributes.sh. Feel free to use that script to create these rules automatically!
Step 5 accomplished: Whenever a test gets executed Dynatrace will capture the test context and applies it to the PurePaths. This data can then be used for targeted multi-dimensional analysis, filtering, calculated service metrics – more on that in the next steps.
Step #6: Multidimensional analysis based on test context
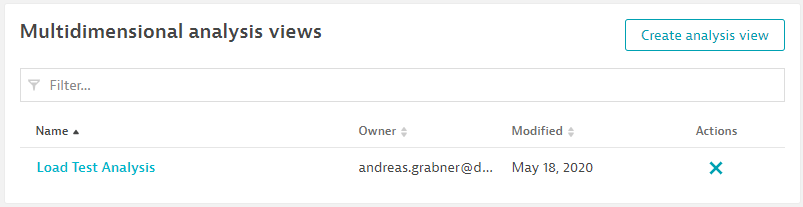
If we run load test script now, Dynatrace will give us the option to analyze data based on those Request Attributes we just specified. So, after running my simple JMeter script against my sample app I can open the Multidimensional Analysis view from my service and define queries like: 95th Percentile Response Time by Test Step Name:
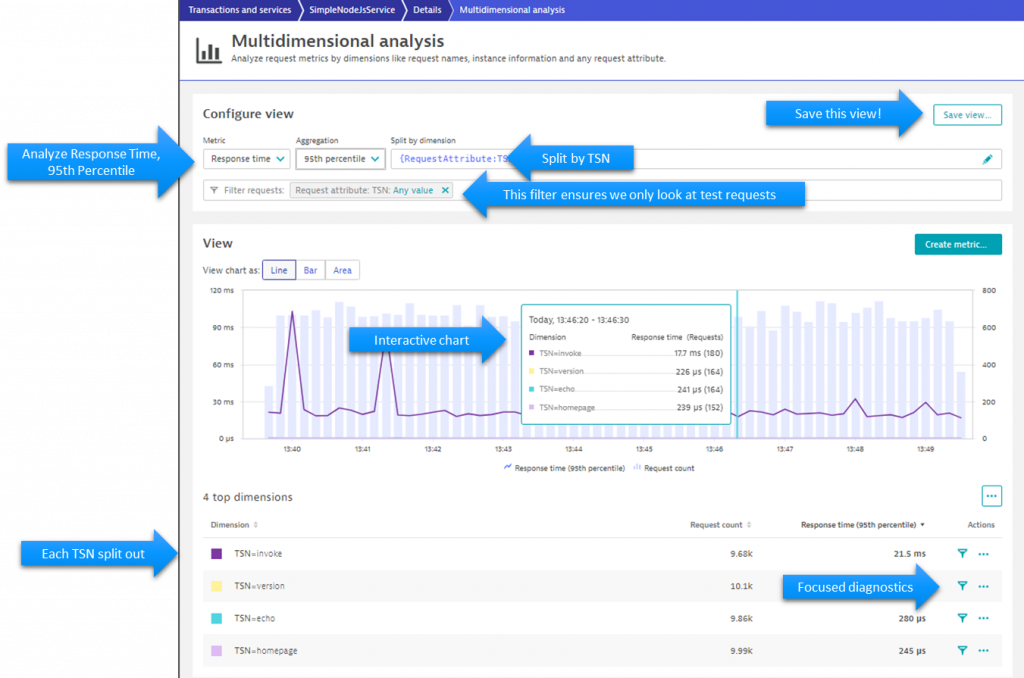
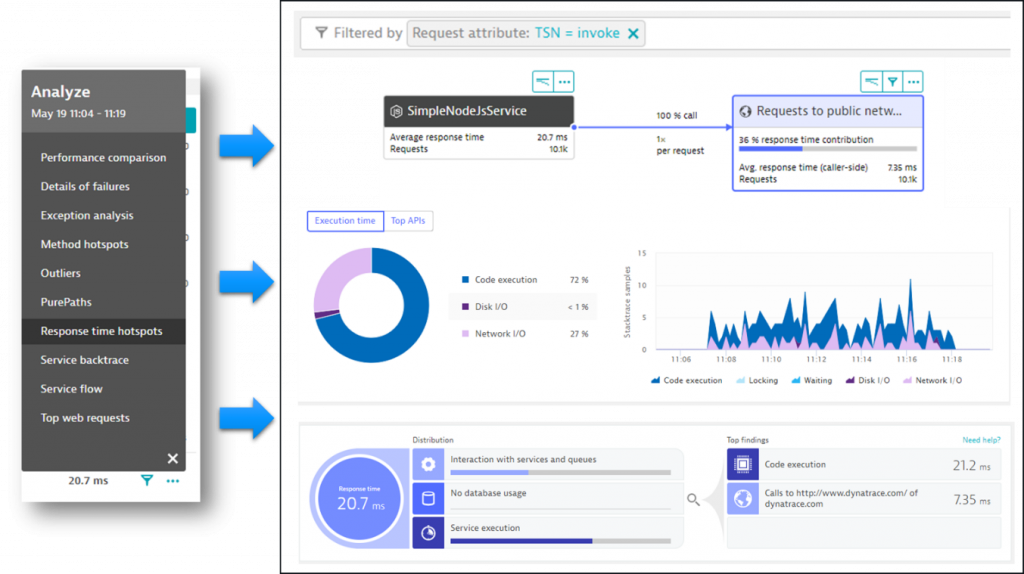
This analysis view is the perfect starting point for digging into response time hotspots, service flow analysis, failure analysis …
The multidimensional analysis view allows us to analyze all sorts of advanced metrics such as “number of database calls”, “number of backend service calls”, “time spent on CPU”. This opens up new analytics use case to e.g: detect those test cases that cause high database or CPU overhead. To learn more check out Michael Kopp’s blog post on Multidimensional Analysis 2.0.
Step 6 accomplished: After executing our tests we can leverage the multidimensional diagnostics option splitting or filtering by context data from our tests, e.g: test name, test step. We can also save that view on our service which makes it more convenient for future analysis exercises.
Step #7: Comparing results of two test runs
Analyzing one test run is great, but comparing two is better as we want to know what the difference between two test runs really is. In my example I deploy version 2.0.0 of my node.js sample application. If you read through my sample application readme on GitHub you will see that Build 2.0.0 has some built-in issues where requests to one of the api endpoints has a high failure rate.
So, I start with deploying Build 2.0.0 like this: docker run -p 80:8080 grabnerandi/simplenodeservice:2.0.0
Now I run the same JMeter load test again and bring up a new multidimensional analysis view. This time focusing on “Average Failure Rate split by Test Names” and from here start my comparison with the previous test:
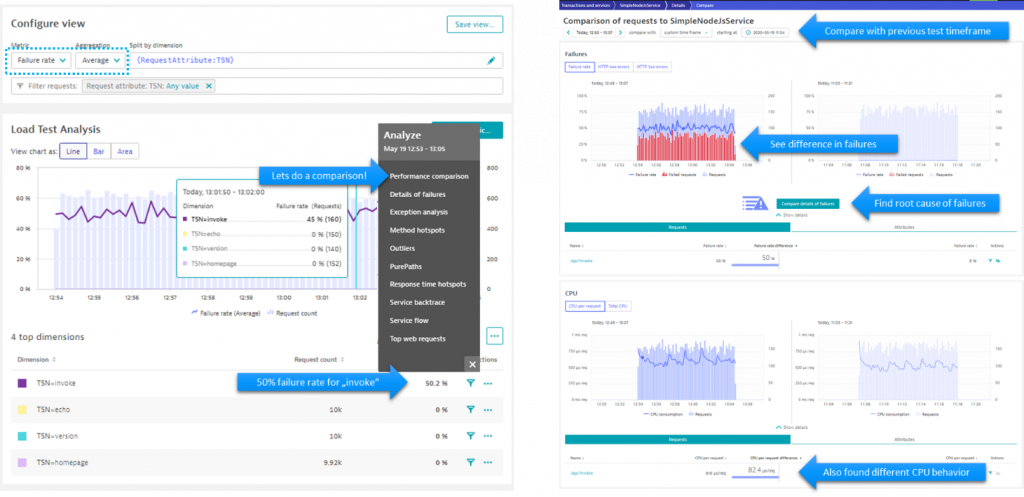
Step 7 accomplished: While there are several options to compare test runs, the multi dimensional analysis view gives us a great starting point into the comparison views of Dynatrace. We can now do this for every test we run by comparing it with the test results of our last known good build.
Step #8: Create Calculated Service Metrics (SLIs)
We’ve seen how we can use the multidimensional analysis view to answer questions like “What’s my response time, failure rate, number of database statements, CPU or idle time per Test Step?” These are also questions you would phrase as SLOs when monitoring a production environment, e.g: Response Time of a Key Business Service or Key Business Transaction must be faster than 200ms at 95% of the time. Dynatrace however not just gives us the standard SLO metrics based on Google’s SRE handbook. We can also include SLOs that touch upon CPU Consumption, Number of Database Interactions, Number of calls to external Services.
Instead of getting these answers in the multi-dimensional analysis view, we can define Calculated Service Metrics to have these data points available as metrics (SLIs). So, for example, we can put them on a dashboard, define alerts or pull this data through an API which allows us to validate them against our objectives or – for load testing purposes – easily detect abnormal behavior within a test or compare them against previous tests.
As true for many features in Dynatrace there are multiple ways to get started with Calculated Service Metrics. The easiest though is to create them right out of the Multidimensional Analysis View:
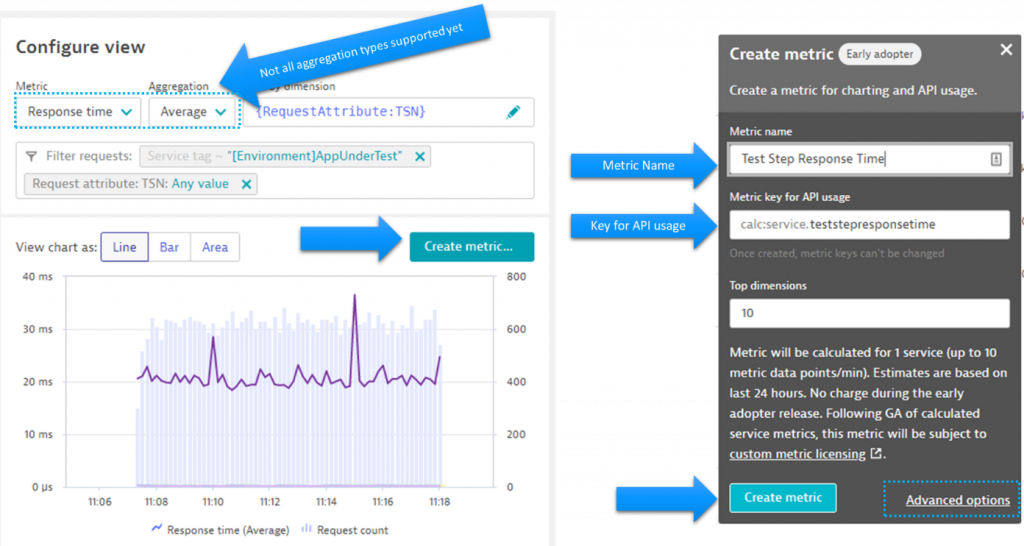
As you will notice, not all aggregations are currently supported for calculated service metrics but support for more is coming. In case an aggregation is not supported, the Create metric dialog will tell you. If you click on “Advanced options” when creating such as calculated metric you will be taken to the settings screen where you’ll see all configuration options. If you want to learn more about this watch my Performance Clinic on Calculated Service Metrics and APIv2.
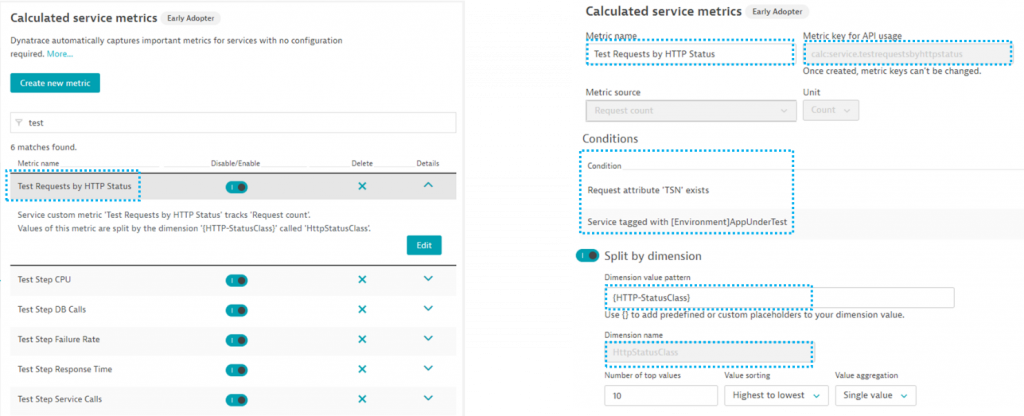
Just as with Request Attributes we can either manually create these rules or automate this creation through the Dynatrace API. As part of my example repository, I’ve prepared a script that creates seven calculated service metrics. As calculated service metrics are only applied to service entities that match a certain filter my script can be called with a tag filter option. In our case, it would be “ENVIRONMENT: AppUnderTest”. You can therefore run the script like this: ./createTestStepCalculatedMetrics.sh ENVIRONMENT AppUnderTest
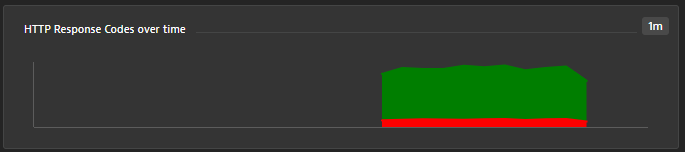
If you want more sophisticated tag filters, you can either extend the script or modify the rules in Dynatrace. Just be aware that these metrics are only calculated for services that match the tagging rules. Also be aware that calculated service metrics will consume licenses. For more information please consult the Dynatrace documentation. The image below shows all the different rules my script is generating. Most of them are split by the TSN Request Attribute. One, however, splits by HttpStatusClass which allows us to later chart the number requests split by HttpStatusClass:
Step 8 accomplished: If we run our load test once more we can chart these calculated service metrics. This is the starting point for our final step which is creating a load testing dashboard that contains all our key SLIs (Service Level Indicators):
Step #9: Creating an SLI performance insights dashboard
Now we’re in the stage of putting all our key metrics and SLIs on a single dashboard. This can include the calculated service metrics we created, giving us insights by Test Step, overall service level metrics such as throughput and failure rate, and can also include metrics from the underlying processes or hosts.
The dashboard you’ve seen at the start of this blog is what you can build right now. The image below shows the different building blocks and which metrics I have put on. Depending on your application and environment you may put different aspects of it, but I hope this is a good starting point for you:
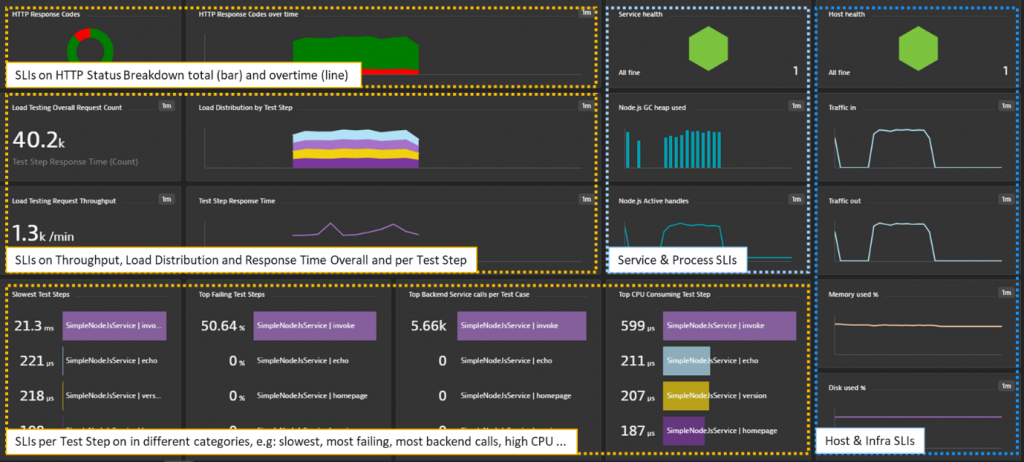
As there’s also a Dynatrace API to create dashboards, I created a script that creates the basic dashboard as shown above. It’s part of the example GitHub and is called createLoadTestingDashboard.sh. You can use this to get a head start and then customize the dashboard to your needs.
There are additional things I would suggest you do after building this dashboard:
#1: Links for drill-downs
I suggest you add a markdown tile at the top with links to other views such as the Multidimensional Analysis View, Response Time Hotspots, Service Flow. This will make it easier for you and others to start diagnostics in case the SLIs show an issue:

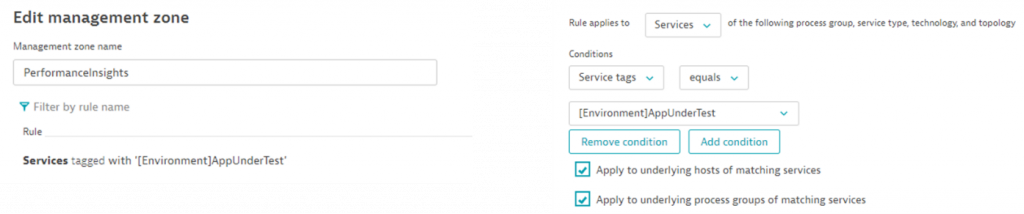
#2: Filter through Management Zones
Create Management Zones for your different “Application Under Test” environments. Once you have this set up you can use and reuse your dashboard for different test environments by applying the management zone as a filter:
Step 9 accomplished: We now have a dashboard we can use to analyze load testing data based on service level indicators split by test context data such as Test Steps. We can also use it to open diagnostics views to analyze the hotspots in our application under test or even compare the results with previous builds.
As a reminder – if you want to see these steps in action – please check out my Performance Clinic titled “Automated SRE-driven Performance Engineering with Dynatrace”
Next Step: Automate SLI validation through Keptn
While I hope I just made your lives as performance engineers easier with getting SLIs based on Test Steps and putting them on a dashboard next to other relevant service level and host health indicators, it’s still a manual task to look at these dashboards and comparing metrics across builds.
This is where Keptn comes in; automating the process by automatically pulling out SLIs for the period of the test and then automatically compares them against previous test timeframes (detects regressions) or against your SLOs:
If you want to read more on this, take a look at blog SLO Validation as a Self Service with Keptn Quality Gates or watch my YouTube Tutorial Leveling Up your Jenkins-based Delivery with Keptn. Also make sure to check out our Keptn Tutorials on https://keptn.sh
Dynatrace ACE Services for Quality Gates!
If you want some help with setting this up then I have got good news. At Dynatrace, we have a team of dedicated ACE (Autonomous Cloud Enablement) experts who are there for you to transform into an organization that truly embraces shift-left by adopting automated SLO driven quality gates. Our team will help you with:
- Implementing Keptn Quality Gates in your environment
- Educating on SLI/SLO best practices to ensure meaningful quality gates are used in the right phase of the CI/CD process
- Integrating the quality gates with your CI/CD platform of choice to achieve an automated quality gate
Reach out to ace@dynatrace.com or your account executive for more information


Looking for answers?
Start a new discussion or ask for help in our Q&A forum.
Go to forum