
We’re proud to announce the general availability of OneAgent full-stack monitoring for the AIX operating system. We saw great adoption during the beta program, during which many of you who use AIX began leveraging deep Dynatrace analysis insights into their environments. We’ve already reached a percentage of monitored AIX hosts running OneAgent that is equivalent to AIX market share.
While cloud-native applications often grab the lion’s share of headlines in the tech world, the data-center-native applications that many modern applications rely on still play an important role in nearly every industry. When we examine IBM Power Systems usage by industry, the majority of Fortune 500 companies run their most demanding mission-critical workloads on AIX.
Monitoring IBM Power Systems isn’t a simple task, due to its specific architecture, there aren’t many tools available on the market. The ones that are available are old generation. These have complex configuration processes and still don’t provide consistent end-to-end visibility into applications.
Fear no more! Dynatrace OneAgent for AIX now delivers AI-driven problem detection, automated instrumentation of your hosts, automatic topology detection, PurePaths, application insights, and more. This means that it’s time for us to remove the “beta” sticker and make full-stack AIX monitoring with Dynatrace available to everyone. Starting with OneAgent version 1.165, end-to-end monitoring of applications and services that run on the AIX operating system is now enabled.
Installation
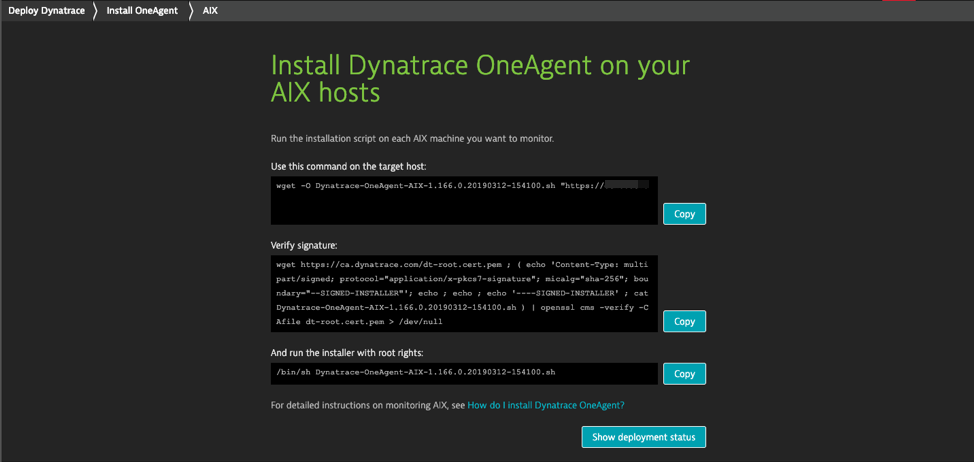
OneAgent for AIX comes with easy-to-use and robust installation scripts. Simply log into your Dynatrace account, select Deploy Dynatrace from the navigation menu, select AIX, and follow the on-screen instructions.
Host performance measures
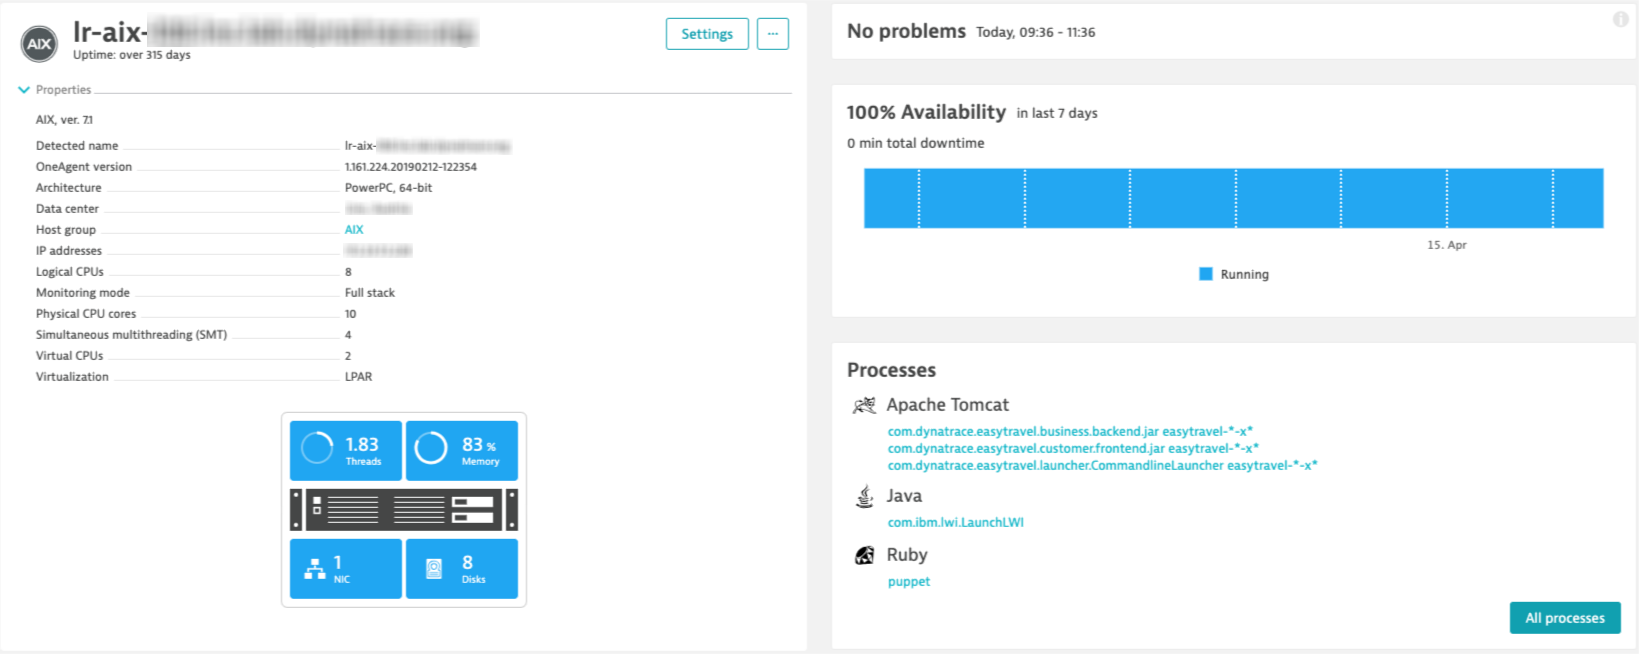
OneAgent for AIX is capable of performing a number of host-level measurements for each of your instrumented AIX hosts. Host performance is tracked across multiple Dynatrace analysis views, beginning with high-level health metrics on your dashboard and extending down to dedicated overview pages for each of your hosts. For details on available metrics, see host performance measures.
CPU and memory measurements with per-process resolution
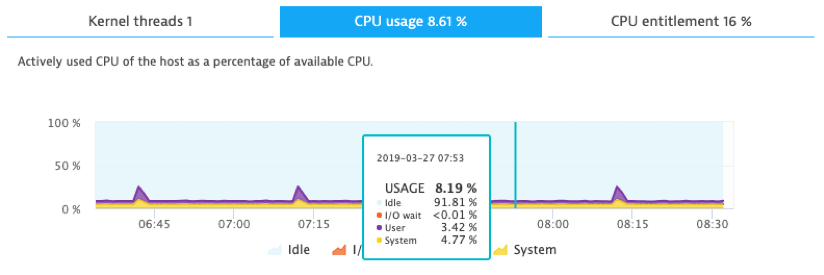
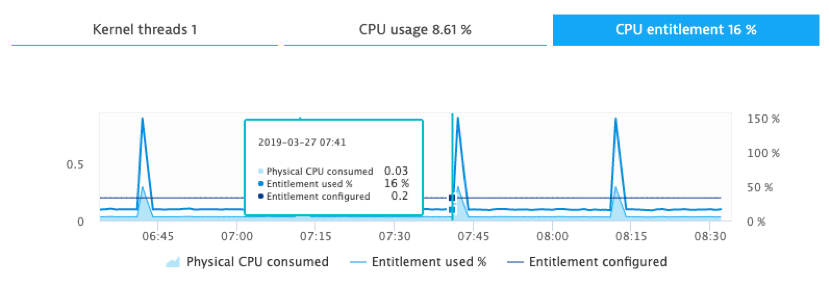
In addition to the basic CPU metrics that were available with the beta release of AIX support, OneAgent now also provides the following advanced CPU measurements:
- Kernel threads: Threads running, Threads blocked, I/O raw wait, I/O direct, buffered, and Logical CPUs.
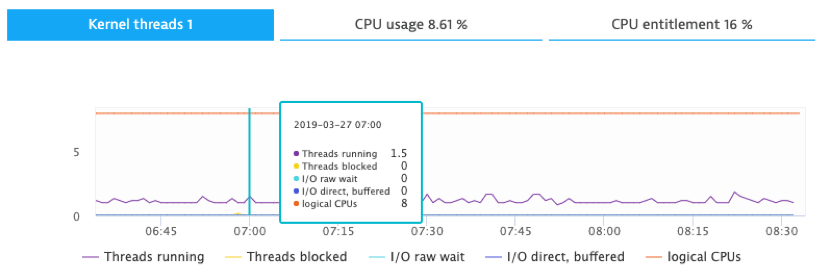
- CPU usage: Idle, User, System and I/O wait categories.
- CPU entitlement: Physical CPU consumed, Entitlement used %, and Entitlement configured.
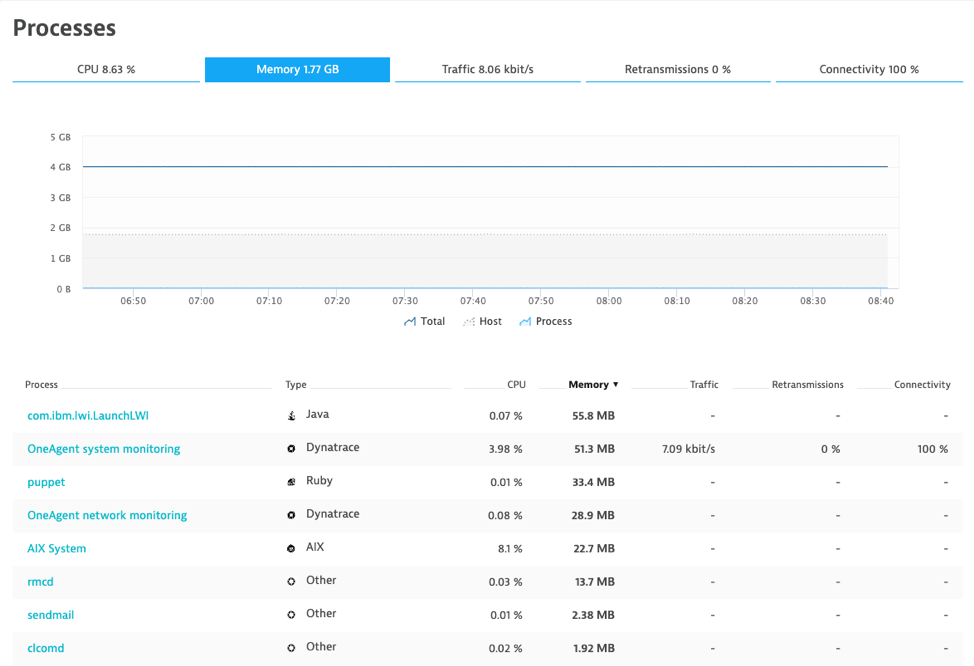
Dynatrace is capable of instrumenting memory in LPARs with Active Memory™ Expansion (AME) enabled. AME employs memory compression technology to transparently compress in-memory data, allowing more data to be placed into memory and thus expanding the memory capacity of configured systems. If you’re using AME, no additional steps are required. Dynatrace will automatically detect that AME is enabled and memory metrics will be displayed accordingly.
The CPU and memory measurements are provided on a per-host basis, but they’re also available with higher granularity. These measurements are also performed for all processes detected by OneAgent on monitored AIX hosts, including, but not limited to, Java and Apache/IHS processes.
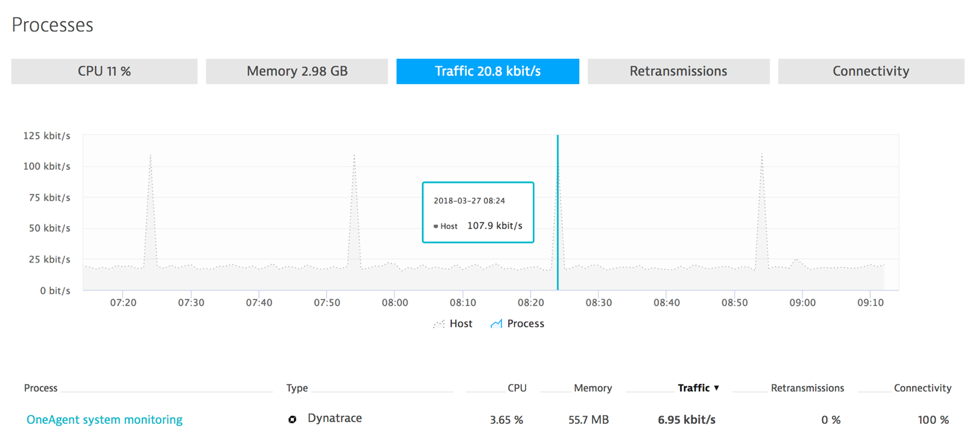
Network measurements with per-interface and per-process resolution
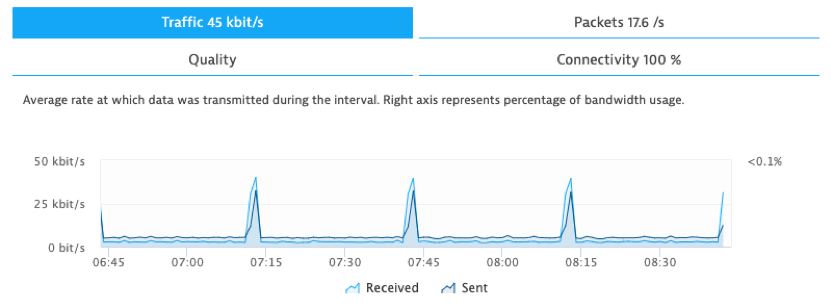
OneAgent for AIX collects a number of network metrics: Received and Sent traffic (measured in bytes and packets), Retransmissions, as well as Connectivity.
In addition to collecting network metrics for AIX hosts, OneAgent also identifies all contributing interfaces and provides a detailed breakdown of the related measurements.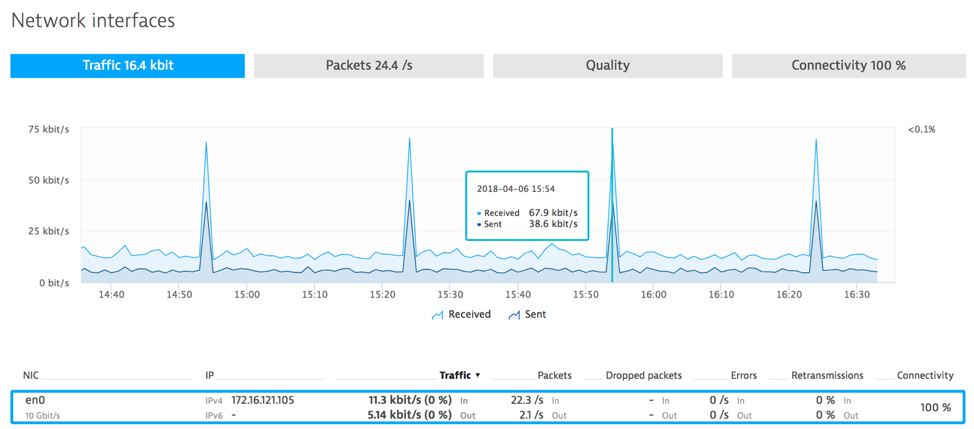
Network metrics are also collected for detected processes.
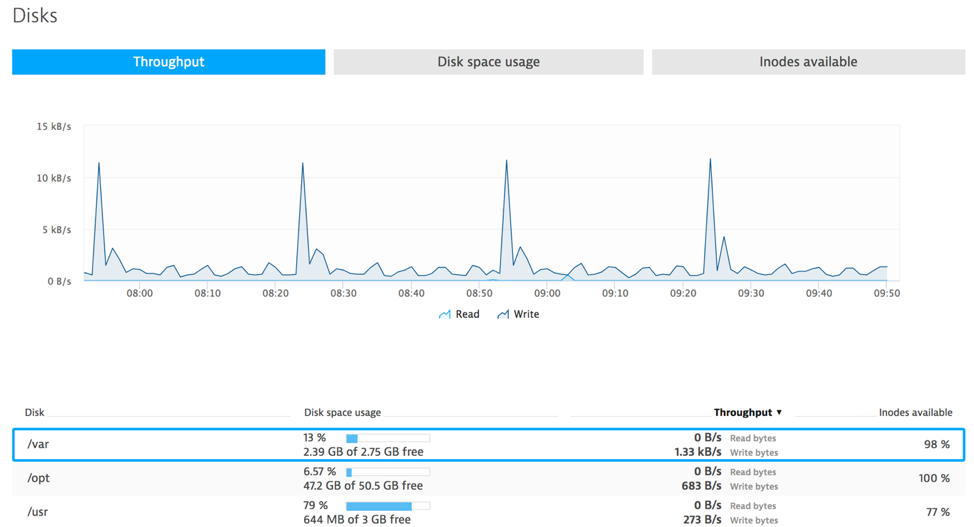
Disk measurements with per-disk resolution
OneAgent for AIX collects the following disk metrics for hosts: Throughput, Disk space usage, and Inodes available.
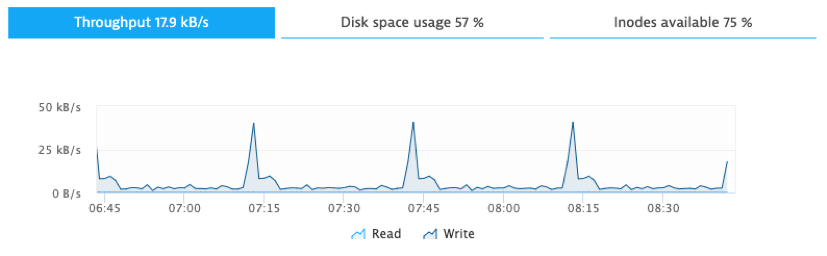
Disk metrics are collected for each discovered disk. Disk metrics are reported as filesystem mount points for easier identification.
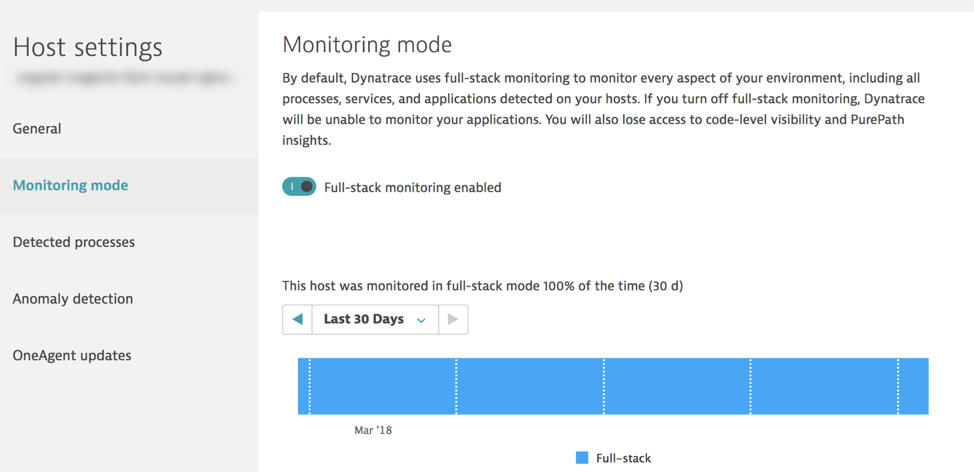
Full-stack and cloud-infrastructure monitoring modes
OneAgent for AIX works in both full-stack and cloud-infrastructure monitoring modes. Monitoring modes are defined during OneAgent installation. You can, however, change the monitoring mode at any time using host-specific settings. Go to Host settings > Monitoring mode. For more details, see cloud-infrastructure monitoring mode.
Automatic updates of all monitoring modules
Full-stack OneAgent for AIX comes equipped with an automatic update feature. Following initial deployment of OneAgent, all subsequent updates are performed automatically, with no manual effort required. Similarly, as with OneAgent for Windows and Linux, you can specify that a specific version of OneAgent be deployed to your hosts, either globally or on a per-host basis. For details, see OneAgent automatic updates.


Looking for answers?
Start a new discussion or ask for help in our Q&A forum.
Go to forum