
The Dynatrace platform provides expanded data access via the Dynatrace MCP server and several APIs that tie into agentic integrations from our ecosystem, our IDE plugins, CLIs, and Dynatrace® Apps. The Dynatrace MCP server has been a cornerstone of making this innovation available to our developer audience right in the IDE. However, MCP is heavily relying on text-based output. This blog introduces new Dynatrace MCP Server application support, which we’re happy to contribute to the community, upgrading UI capabilities by enabling data visualization. It empowers developers and organizations to build their own agentic platforms and visualize experience data, without relying solely on LLM reasoning.
Why are MCP applications so valuable to Developers?
A picture is worth a thousand words
Charts, color cues, and visual tables are here for a reason. We just need a quick look to determine whether something is right or wrong, and with MCP Apps, those visuals can appear in the same conversation with Dynatrace Assist or when interacting with Dynatrace Intelligence from within Kiro, GitHub Copilot, or any other MCP integration, where we ask questions while avoiding context switching and speeding up analysis and result checking. Once we get the insights we need, we can dive even further into the platform applications with comprehensive context.
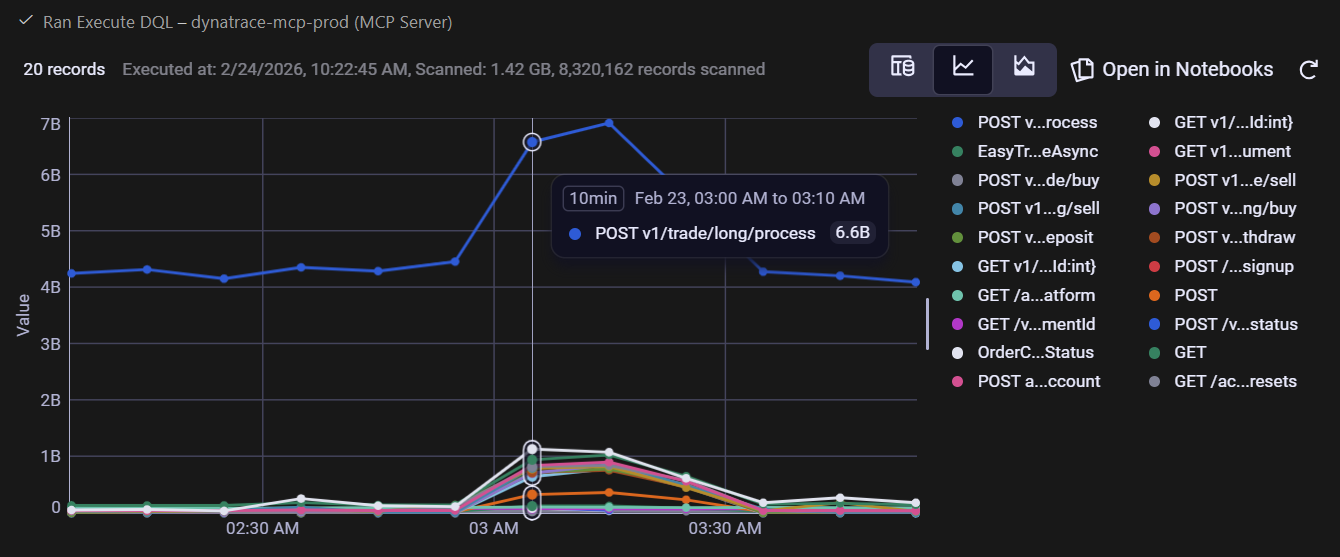
For example, during a problem investigation, we observe a spike in requests across all endpoints, especially for the v1/trade/long/process endpoint.
Dynamic visual results
Interactive UIs let users modify results per their needs. With the new visual results, we can filter, pivot, and drill into results without re-issuing prompts; the model and UI remain in sync and continue the conversation with a richer context.
Actionability built in
Visuals can include action buttons, for example, Open in Notebooks, which calls back to the server to drill into the data stored in Dynatrace Grail® unified data lakehouse. You can create dashboards and notebooks directly from any page without changing context.
Human verification
Human involvement in data analysis is one of the factors that differentiate these processes from purely LLM-based solutions. Keeping humans in the loop to validate and interpret results visually is one of the most important factors for organizations that want to maintain control over their data analysis process.
MCP App architecture
MCP extension protocol integration
The Dynatrace MCP Server uses the @modelcontextprotocol/ext-apps library to register interactive UI applications alongside traditional text-based tool responses. This allows the MCP client (such as GitHub Copilot) to extend the standard MCP results with visual capabilities.
Tool-to-UI binding
Tools are registered via the _meta.ui.resourceUri property that links the tool’s output to its visual counterpart. When execute_dql returns results, the host knows to render the associated UI app as well.
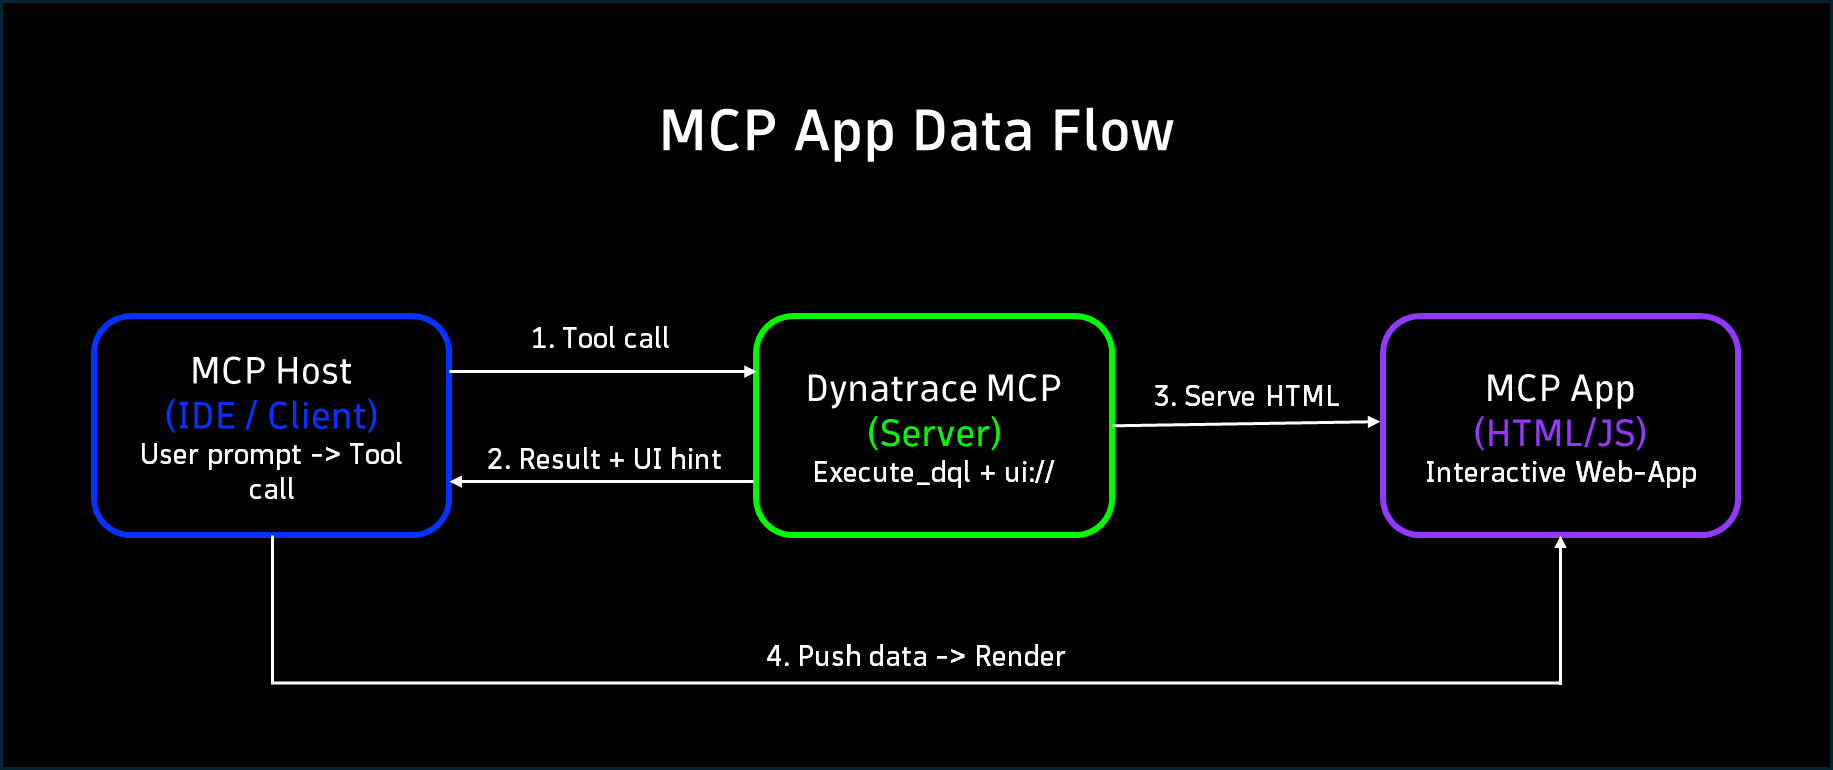
Data flow
Structured output parsing
The tool returns results as structured markdown containing metadata and a JSON block. The UI app parses this response, extracting record counts, warnings, and the actual data records.
Real-time client-side rendering
A lightweight TypeScript-based web-app (execute-dql.ts) receives the tool result via the app.ontoolresult callback and dynamically builds an interactive HTML table—complete with sortable columns, hover states, and expandable JSON cells.
Single-file bundling
When using Vite with vite-plugin-singlefile, the HTML, CSS, and TypeScript are bundled into a self-contained HTML resource that the MCP server serves on demand.
See it in action
Take a look at this example video showing an investigation into slowdowns.

In the following screenshots, you can see examples of how data that is structured in a visual way helps us to ask the right questions or continue investigations promptly.
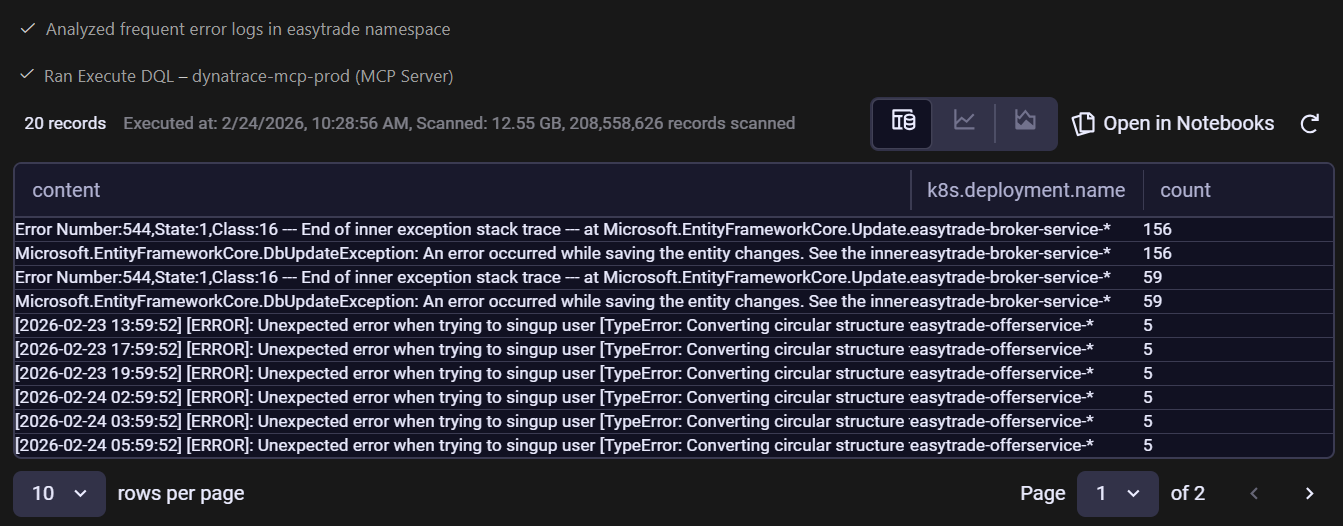
In reviewing error logs, we see frequent errors appearing in easytrade-broker-service.
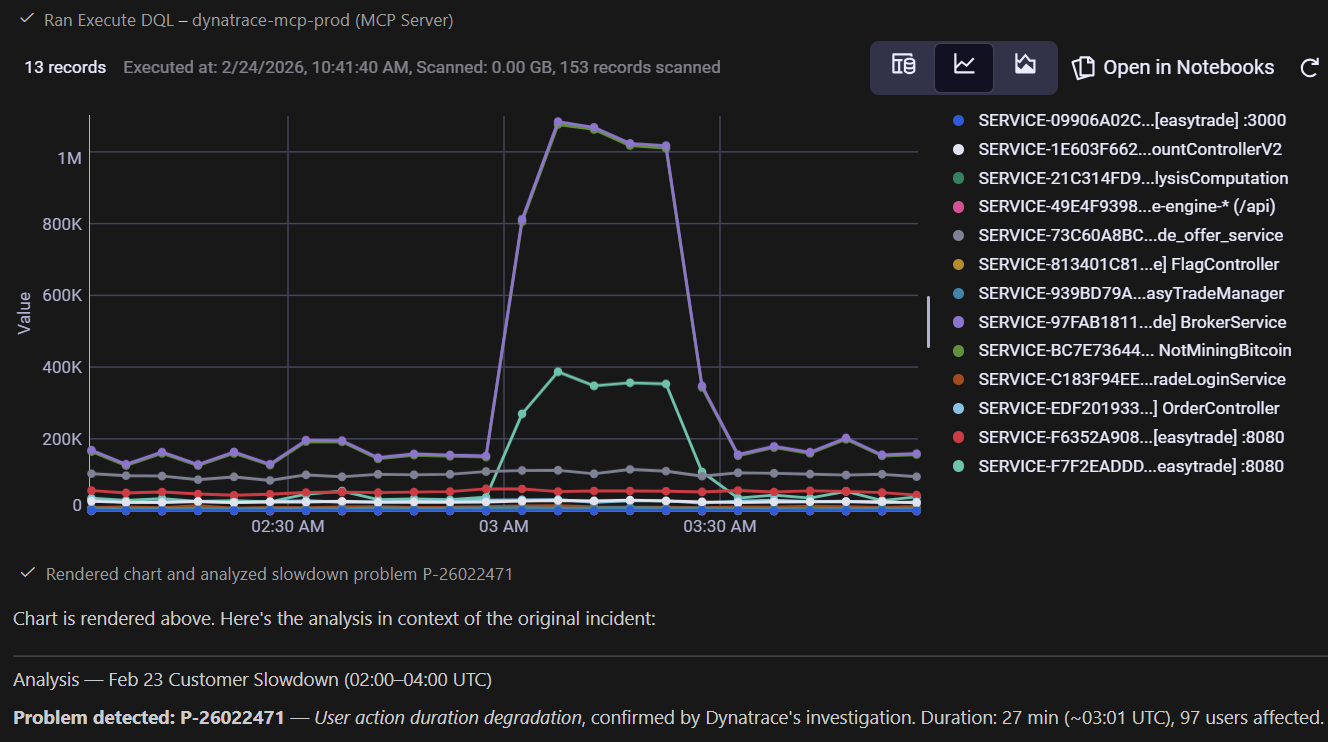
While analyzing service degradation due to the slowdown, we found that two services were affected for approximately 30 minutes.
What about security?
Let’s call out the elephant in the room: security is a major concern with MCP servers, and adding HTML rendering on top is likely to raise eyebrows.
There are a couple of security measures and best practices in place to protect our users:
- Dynatrace MCP Apps are always rendered in a sandboxed iframe controlled by the host.
- Our MCP apps communicate only with the MCP host via JSON RPC. No direct communication with the internet occurs with Dynatrace MCP apps.
- We make use of battle-tested React components, inheriting all security-relevant features of React.
Get started
Dynatrace MCP Apps is already included in the latest version of our local MCP Server, and will soon be added to our remote server as well. If you’re already using the local MCP server, you only need the updated version, which should be automatically available in your Dynatrace environment. If the update doesn’t happen automatically, or if you aren’t already using the local Dynatrace MCP server, install it via the GitHub MCP registry and start experimenting using the provided quickstart.
To better understand how you can uplevel your AI assistants with live production insights from Dynatrace, read our most recent blog post or explore the Dynatrace Agentic AI ecosystem in Dynatrace Hub.
To learn more about MCP Apps and the MCP protocol, visit the Model Context Protocol website.


Looking for answers?
Start a new discussion or ask for help in our Q&A forum.
Go to forum