
Much has been said about the distributed and ephemeral nature of today’s software development landscape. In recent years, the rise of AI and agentic ecosystems has further transformed the way developers work. Yet, despite these advancements, developers still struggle with scattered tech stacks, fragmented tools, and, until now, fragmented insights.
With Dynatrace, developers can rest assured that everything they need—from development to deployed infrastructure—is available with full context at every touchpoint. Traditionally, developers have had limited visibility into production systems, relying on operations teams to surface issues after deployment. This disjointed approach often leads to delays in identifying and resolving problems, increased risk of production failures, and inefficiencies in the development process
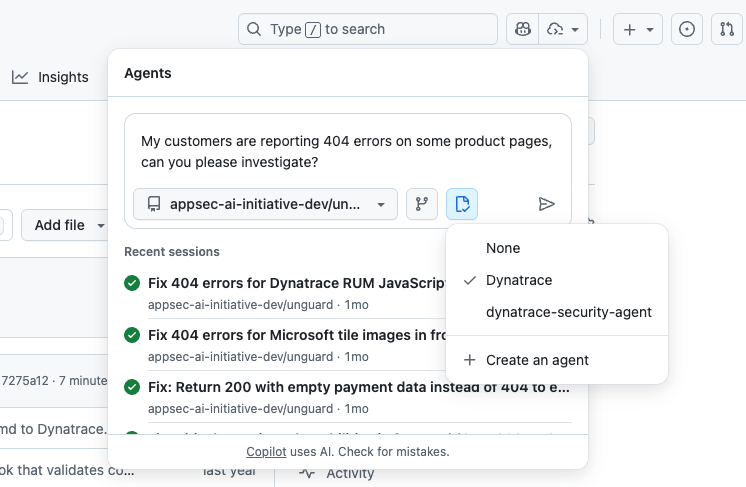
With GitHub’s recent announcement of custom agents, Dynatrace is proud to launch its first custom agent, introducing a powerful new entry point for Dynatrace insights directly within GitHub repositories, where developers can act on them immediately. This integration ensures that developers no longer need to leave their familiar GitHub environment to access critical observability and security data. Whether it’s triaging production errors, validating deployments, or responding to security vulnerabilities
This isn’t just another way to consume observability and security insights from Dynatrace—this is about achieving true end-to-end visibility, from code to production, by combining the capabilities of Dynatrace with GitHub Copilot and its custom agents.
In this blog post, we’ll explore the most prominent use cases offered by this integration and demonstrate how deploying these two tools in tandem can unlock new levels of efficiency, reliability, and security for your software development lifecycle.
How it works
Dynatrace and Git solutions support opposite ends of the Software Delivery Lifecycle: Git hosts your code repository while Dynatrace monitors your production infrastructure. Agentic AI and the MCP protocol allow bridging of this gap, essentially allowing AI assistants to verify their code in production.
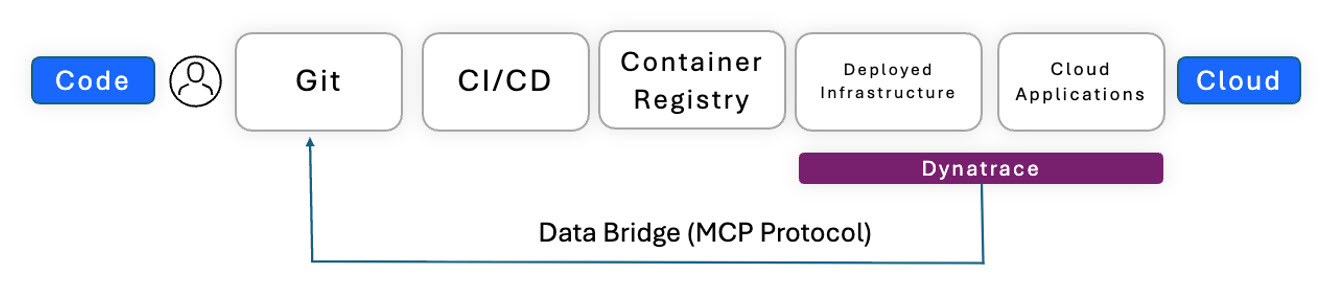
Setting up the connection with Dynatrace is simple
We recommend using your local MCP server for prototyping and testing things out. First, follow these instructions to create a platform token with the necessary scopes. Once this is done, install the MCP server in your GitHub repository: you’ll find the configuration in Settings > CoPilot > Coding Agent (an example can be found in the repository linked above).
Finally, you need to set up the custom agent in your repository under .github/agents/Dynatrace.md. For your convenience, we’ve provided an example file that you can simply drag and drop. Update your MCP server’s credentials, and you’re all set.
Tip: Before promotion to production, we recommend switching from your local MCP Server to our remote MCP Server.
Use cases: Unlock the power of production insights
Dynatrace’s custom agent for GitHub Copilot unlocks the following core use cases, each designed to enhance developer productivity and ensure operational excellence:
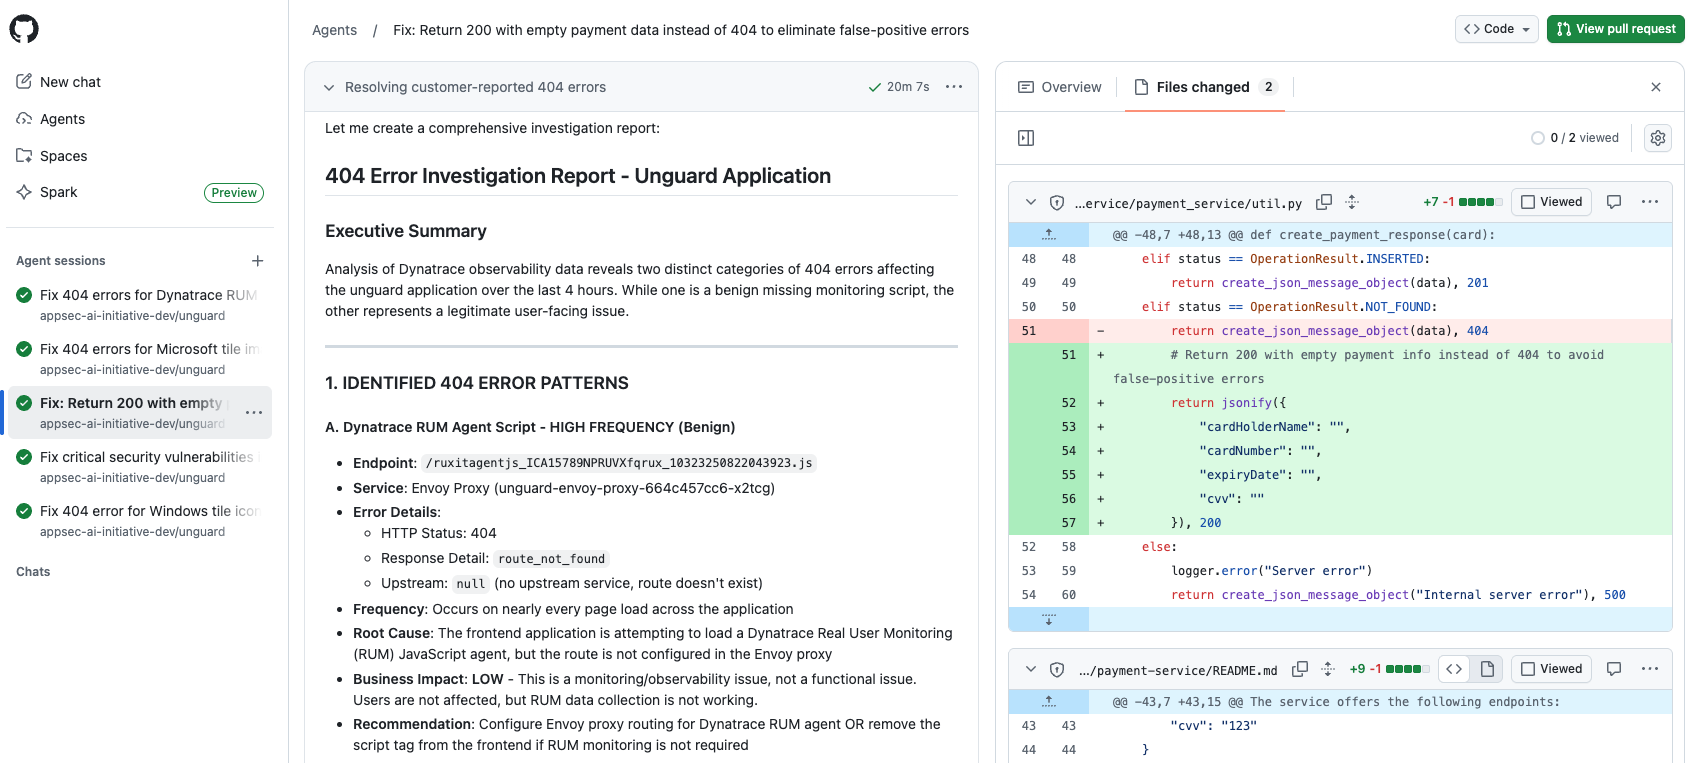
Incident Response and Root Cause Analysis
Developers can investigate and resolve production failures directly within GitHub by leveraging Dynatrace Davis® AI for real-time problem detection, backend stack trace analysis, and business impact assessment. This provides higher precision in less time, without requiring changes to workflows at other locations.
Deployment impact analysis
The agent validates deployments by comparing pre- and post-deployment metrics, detecting anomalies, and providing data-driven health assessments to ensure smooth rollouts.
Production error triage
Dynatrace systematically monitors and categorizes production errors. Now, with a custom agent, we can prioritize remediation efforts, reduce error backlogs, and improve application reliability directly in GitHub Copilot.
Performance regression detection
Dynatrace continuously monitors application performance baselines, ensuring that any degradation in latency, throughput, or error rates is flagged before it impacts your end-users or breaches service-level objectives (SLOs).
Release validation and health checks
Acting as an automated quality gate, the agent can validate releases, monitor post-deployment stabilization, and ensure compliance with SLOs.
Security vulnerability response and compliance monitoring
Dynatrace integrates security workflows into GitHub, proactively identifying vulnerabilities, mapping them to compliance frameworks, and providing prioritized remediation recommendations
To infinity and beyond
Dynatrace’s custom agent is more than just a tool for many use cases—it’s a powerful toolkit that helps you unlock the full potential of your existing data to uncover the insights you need, precisely when you need them. The use cases we’ve highlighted here are just the beginning. The true power of this integration lies in the dynamic nature of AI, enabling you to search, query, and connect insights across a vast network of agents and platforms. While the journey may take you through uncharted territories of interconnected ecosystems, and it may sound a bit scary at first, there is huge value (and fun!) in turning complexity into clarity and productivity.
Ready to consolidate observability and get answers faster?
Have you already seen the recently launched GitHub custom agents, and are you interested in trying out Dynatrace’s custom agents? Then familiarize yourself with our remote MCP Server and learn how to integrate it into your development landscape.


Looking for answers?
Start a new discussion or ask for help in our Q&A forum.
Go to forum