
We’re happy to announce the availability of enhanced Dynatrace MongoDB monitoring. MongoDB monitoring provides you with a good understanding of your MongoDB performance and its impact on your applications.
Viewing MongoDB monitoring metrics
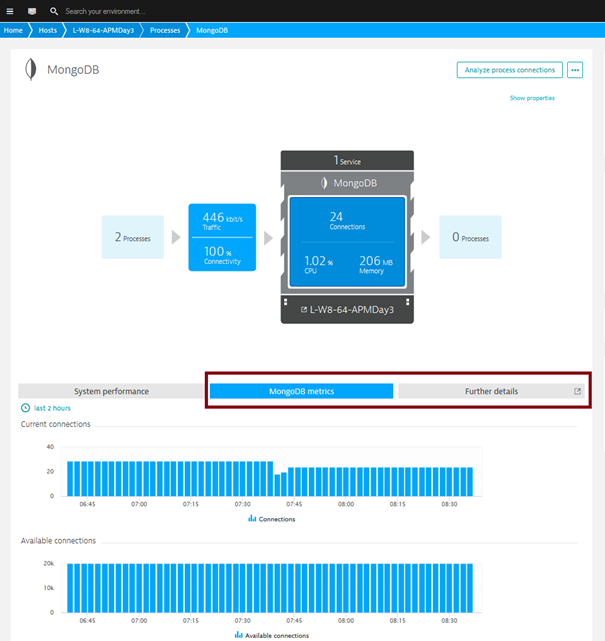
Captured MongoDB metrics are displayed on MongoDB Process pages. Click the infographic, or click the MongoDB metrics and Further details tabs to view metric details.
Collected metrics
| Metric | Description |
|---|---|
| Current connections | Reflects number of incoming connections from clients to the database server, including the current shell session. Provides insight into the connection load on the database. |
| Available connections | Number of available unused incoming connections. |
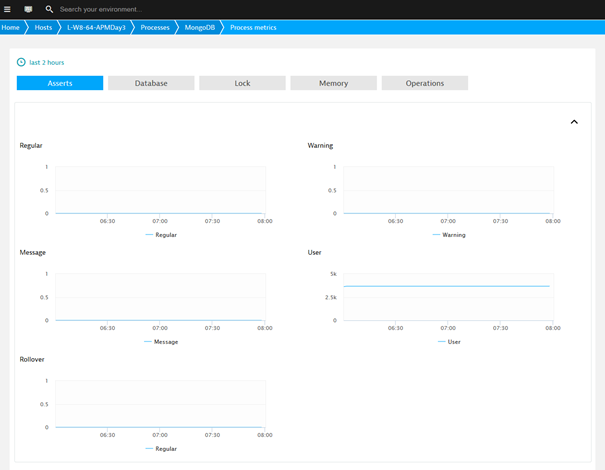
| Asserts | Regular – Number of regular assertions raised since the MongoDB process started. Warning – Number of warning assertions raised since the MongoDB process started. Message – Number of message assertions raised since the MongoDB process started. User – Number of user assertions raised since the MongoDB process started. These are errors that user may generate, for instance duplicate key or out of disk space. Rollover – Number of times that the rollover counters have rolled over per second. |
| Current queue | Number of operations queued waiting for the lock. A consistently high value indicates a possible concurrency issue that may be affecting performance. |
| Active clients | Number of connected clients and the read and write operations performed by these clients. |
| Resident memory | Value is roughly equivalent to the amount of RAM, which is currently used by the database process. |
| Virtual memory | Amount of virtual memory used by the mongod process. |
| Operations | Insert – Number of insert operations per second. Query – Number of queries per second.
|
Database-level metrics
| Metric | Description |
|---|---|
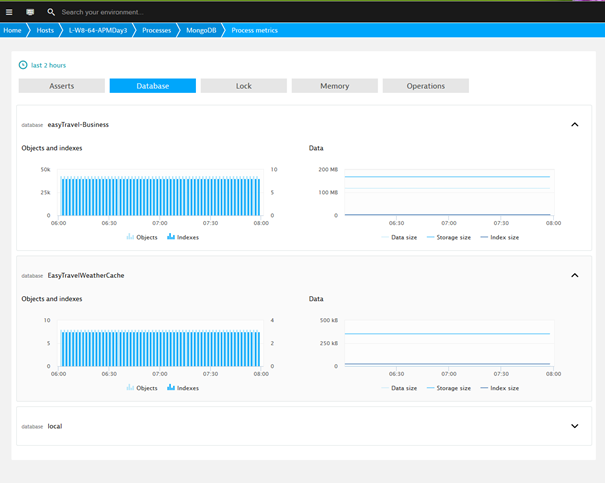
| Objects | Number of documents in the database across all collections. |
| Indexes | Total number of indexes in the database across all collections. |
| Data size | Total size (bytes) of data held in the database. |
| Storage size | Amount of space (bytes) allocated to collections in this database for document storage. The storage size doesn’t decrease as documents are removed or reduced. |
| Index size | Total size (bytes) of all indexes created on this database. |
Prerequisites
- MongoDB 2.6 (or higher)
- OneAgent 1.89 (or higher)
- Privileges: User must have the clusterMonitor role for the admin database.
Configuring MongoDB monitoring
There are two configuration options available for MongoDB monitoring:
global(applicable to all hosts) The main advantage of using theglobalconfiguration option is that, once configured, when a new host running MongoDB is detected in the future, monitoring will be activated and metrics will be gathered automatically.local(specific hosts only)
To enable MongoDB monitoring globally (recommended):
- From the navigation menu, select Settings.
- Select Monitored technologies.
- Click Edit next to the Configure MongoDB extension listing.
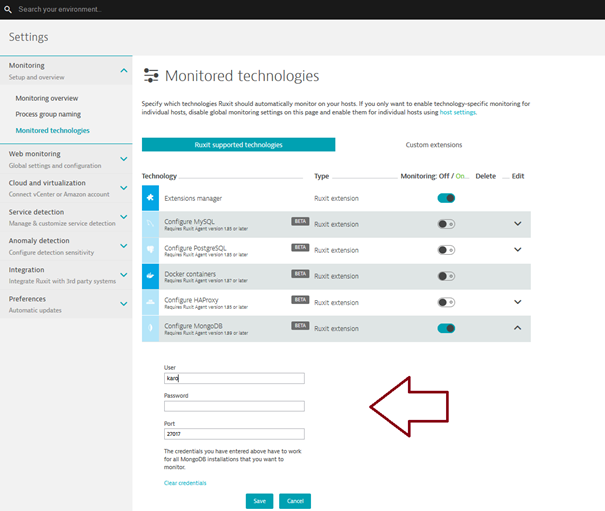
- Enter the User and Password needed to connect to the MongoDB server.
- Click Save.
- Set the MongoDB switch to On to enable monitoring.
- Ensure that the Extensions manager switch is also set to the On position.
To enable MongoDB monitoring locally:
Note: Before proceeding, ensure that the Configure MongoDB global configuration option (explained above) is set to the Off position.
- Go to a MongoDB Host page.
- Click Edit to configure MongoDB locally.
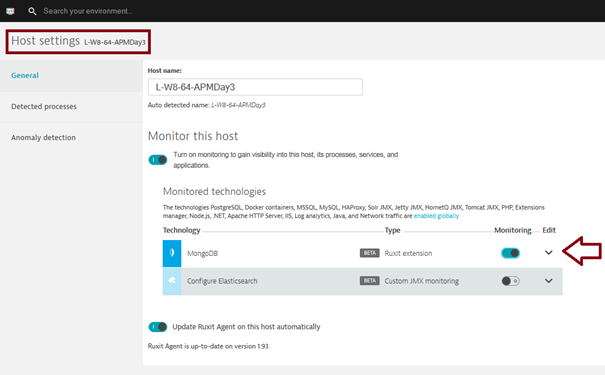
- Expand the MongoDB extension listing.
- Follow steps 4-7 as explained above for global configuration.


Looking for answers?
Start a new discussion or ask for help in our Q&A forum.
Go to forum