
Solving incidents or finding root causes is a time-critical activity that requires logged evidence to understand what really happened in a system. Whether to prevent such incidents from happening again or to rule out a malicious hacking attempt, getting answers is the key, and logs are your best source for getting such evidence.
However, analyzing only logs might not be enough. For example, if the incident resulted in a system crash, it would be important to also see the utilization of the system just before the incident occurred or to understand what happened in the system around utilization peaks.
This is why Dynatrace has introduced a new advanced investigation feature for Security Investigator that gives you faster insights into Performance Metrics.
Solving latency issues with metric insights
Dynatrace Security Investigator is one of the built-in apps that ships with Dynatrace. It’s designed for evidence-driven security use cases based on the logs, metrics, and traces ingested into the Dynatrace Grail® data lakehouse.
Imagine you’re performing root cause analysis on a long-running query using Security Investigator. You’ve found the logs for the request that was running for a long time, and you want to understand what the CPU utilization of the application was at the time of the request.
By simply right-clicking on the log record in your results, you can choose either the relevant pod, container, host, or any other dimension available in the log record and choose CPU utilization.
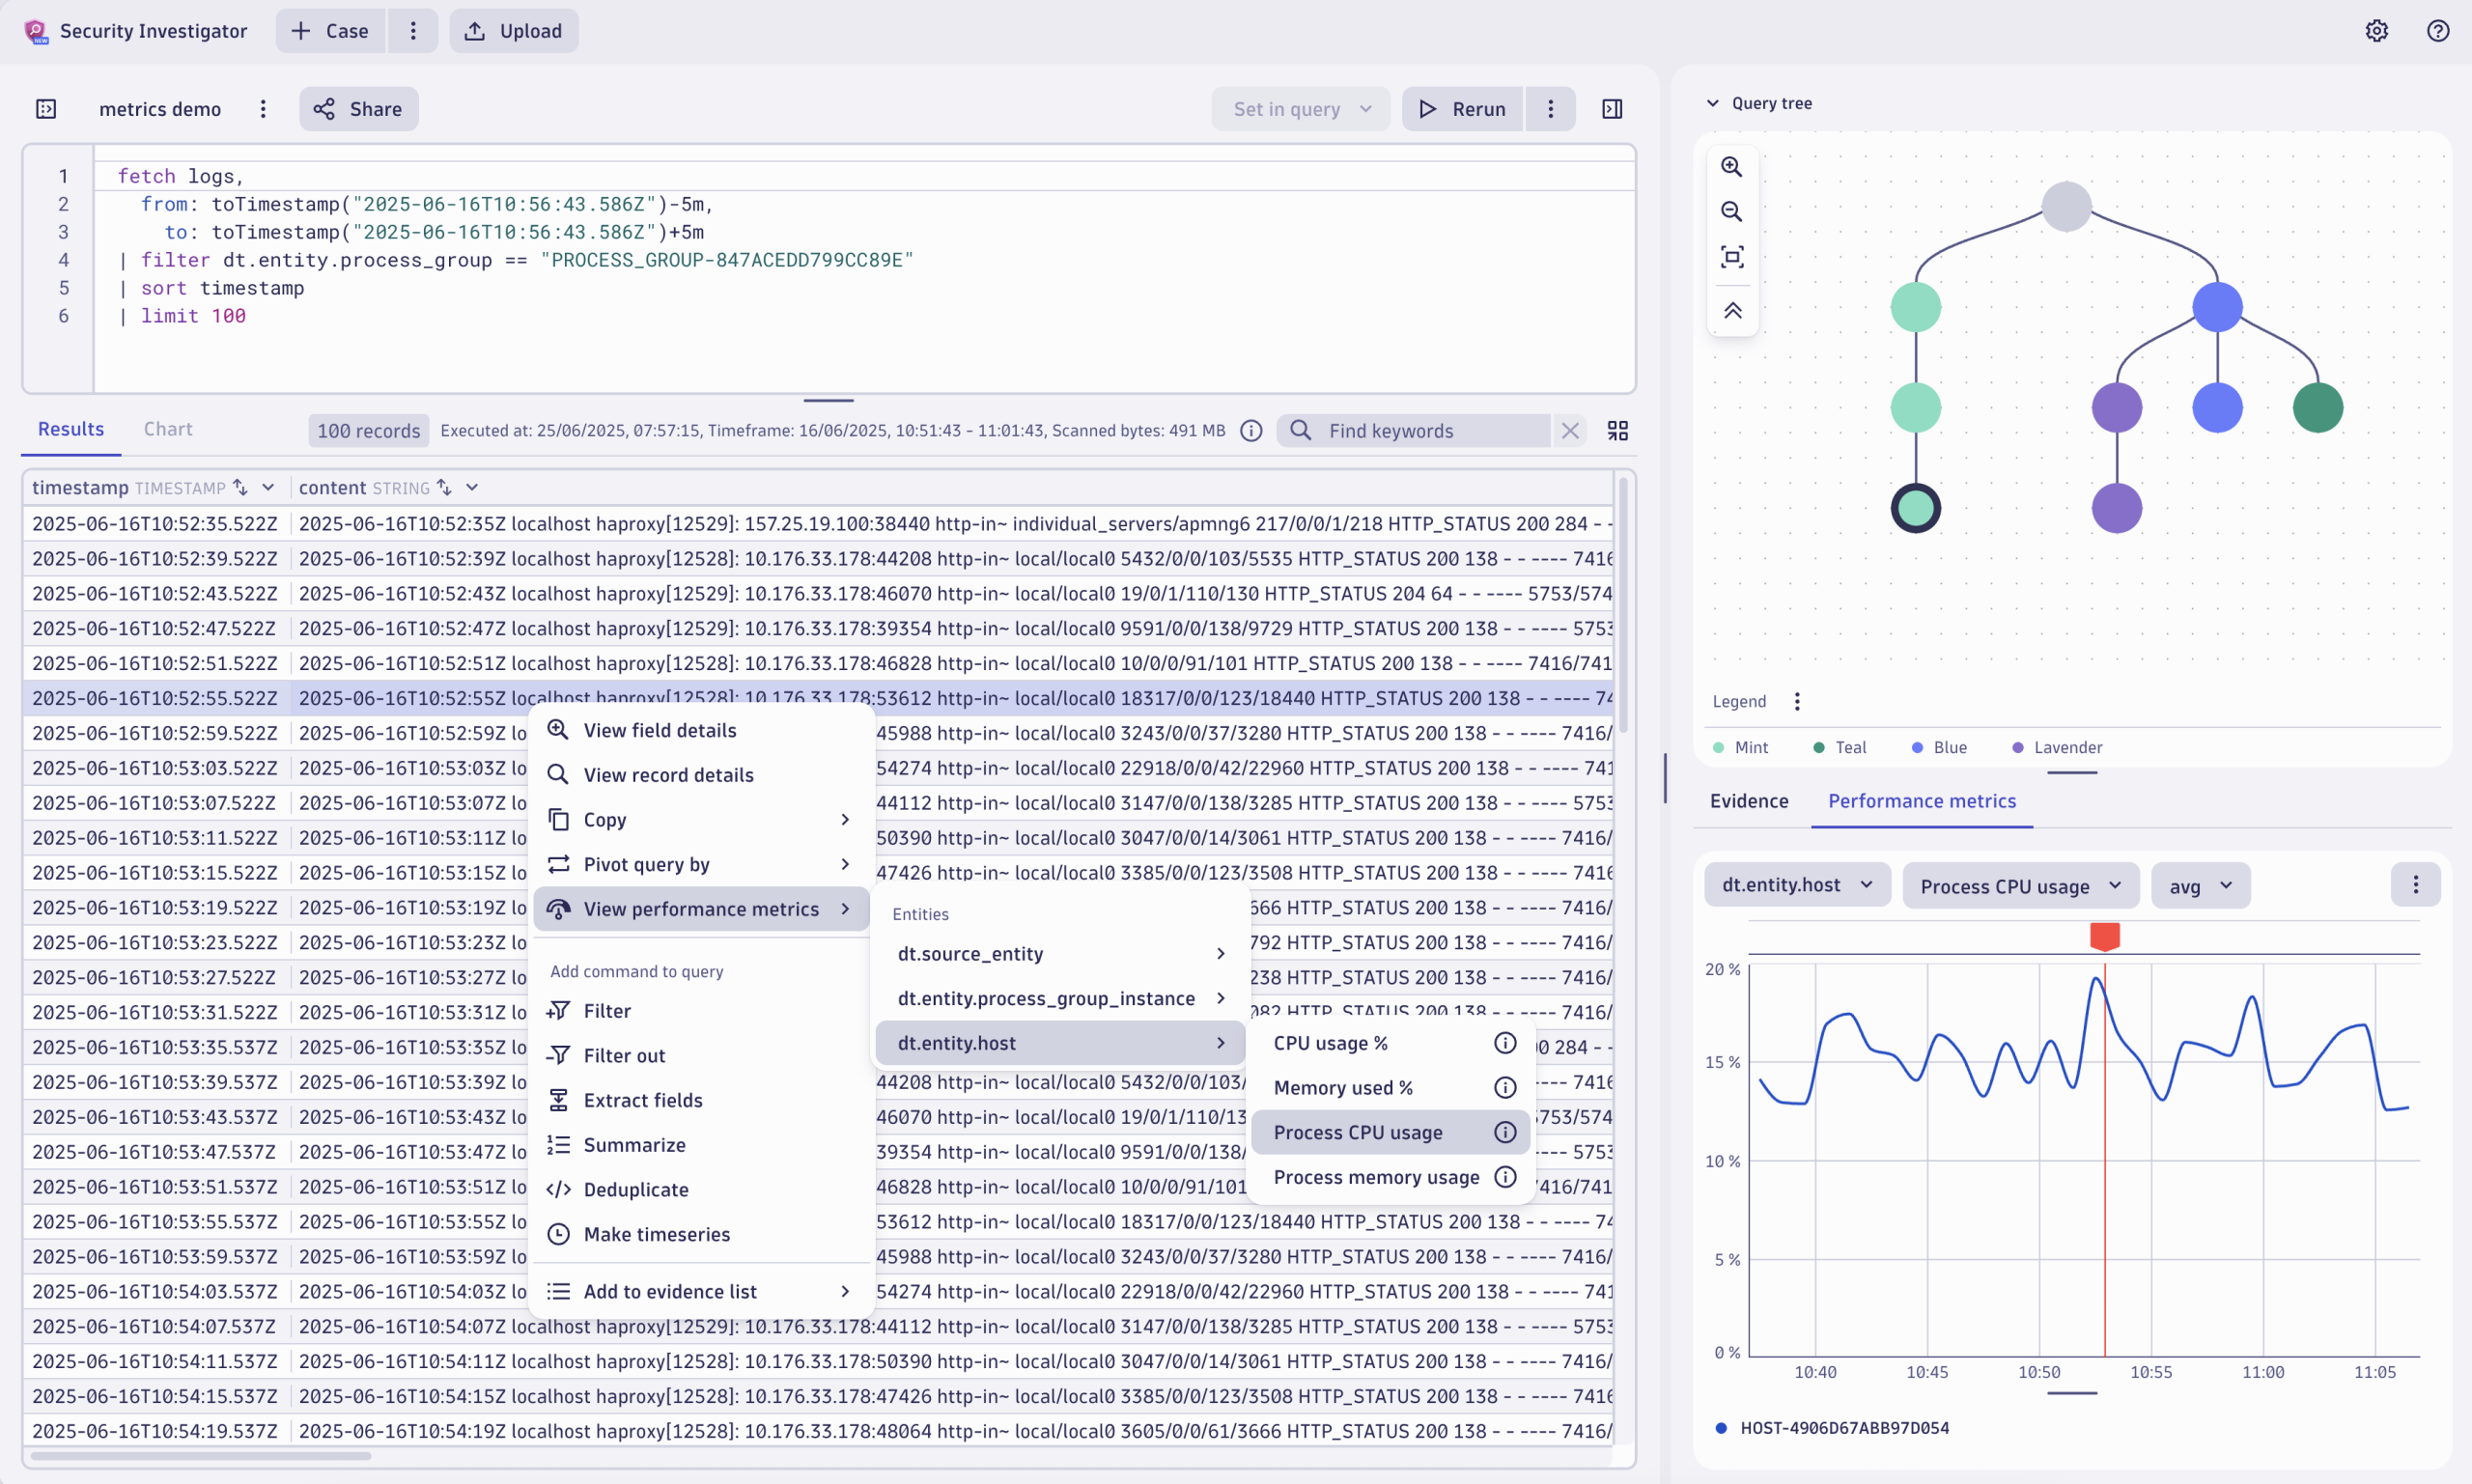
As a result, you can see the CPU utilization chart from the specific pod around the time of the log record in the context of your investigation next to your logs. You can modify the aggregation function or change the visible metric for the pod, if needed. 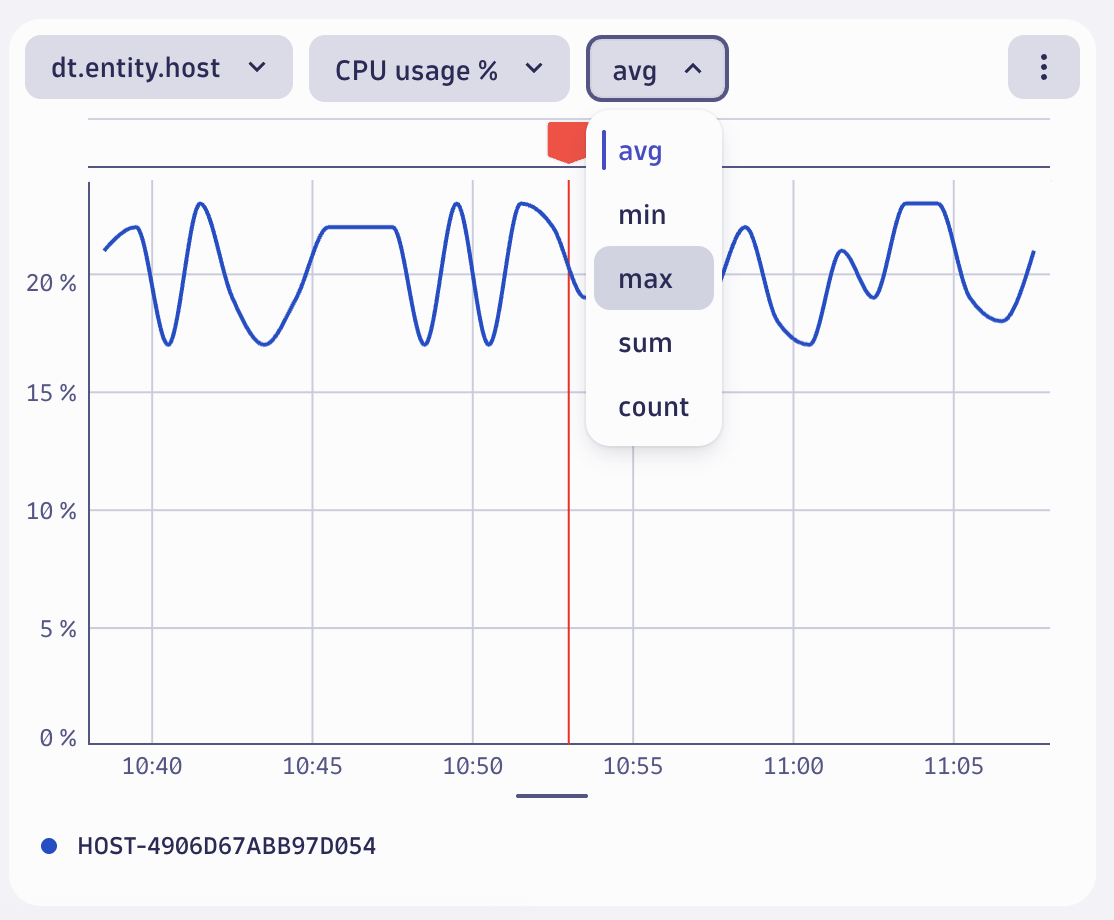
The red indicator on the chart shows the selected log record’s timestamp from your results table. If you choose any of the other log records in the results table, the red indicator will change its position on the chart, enabling you to update the CPU utilization chart with your log-analysis context.
Persisted throughout the case
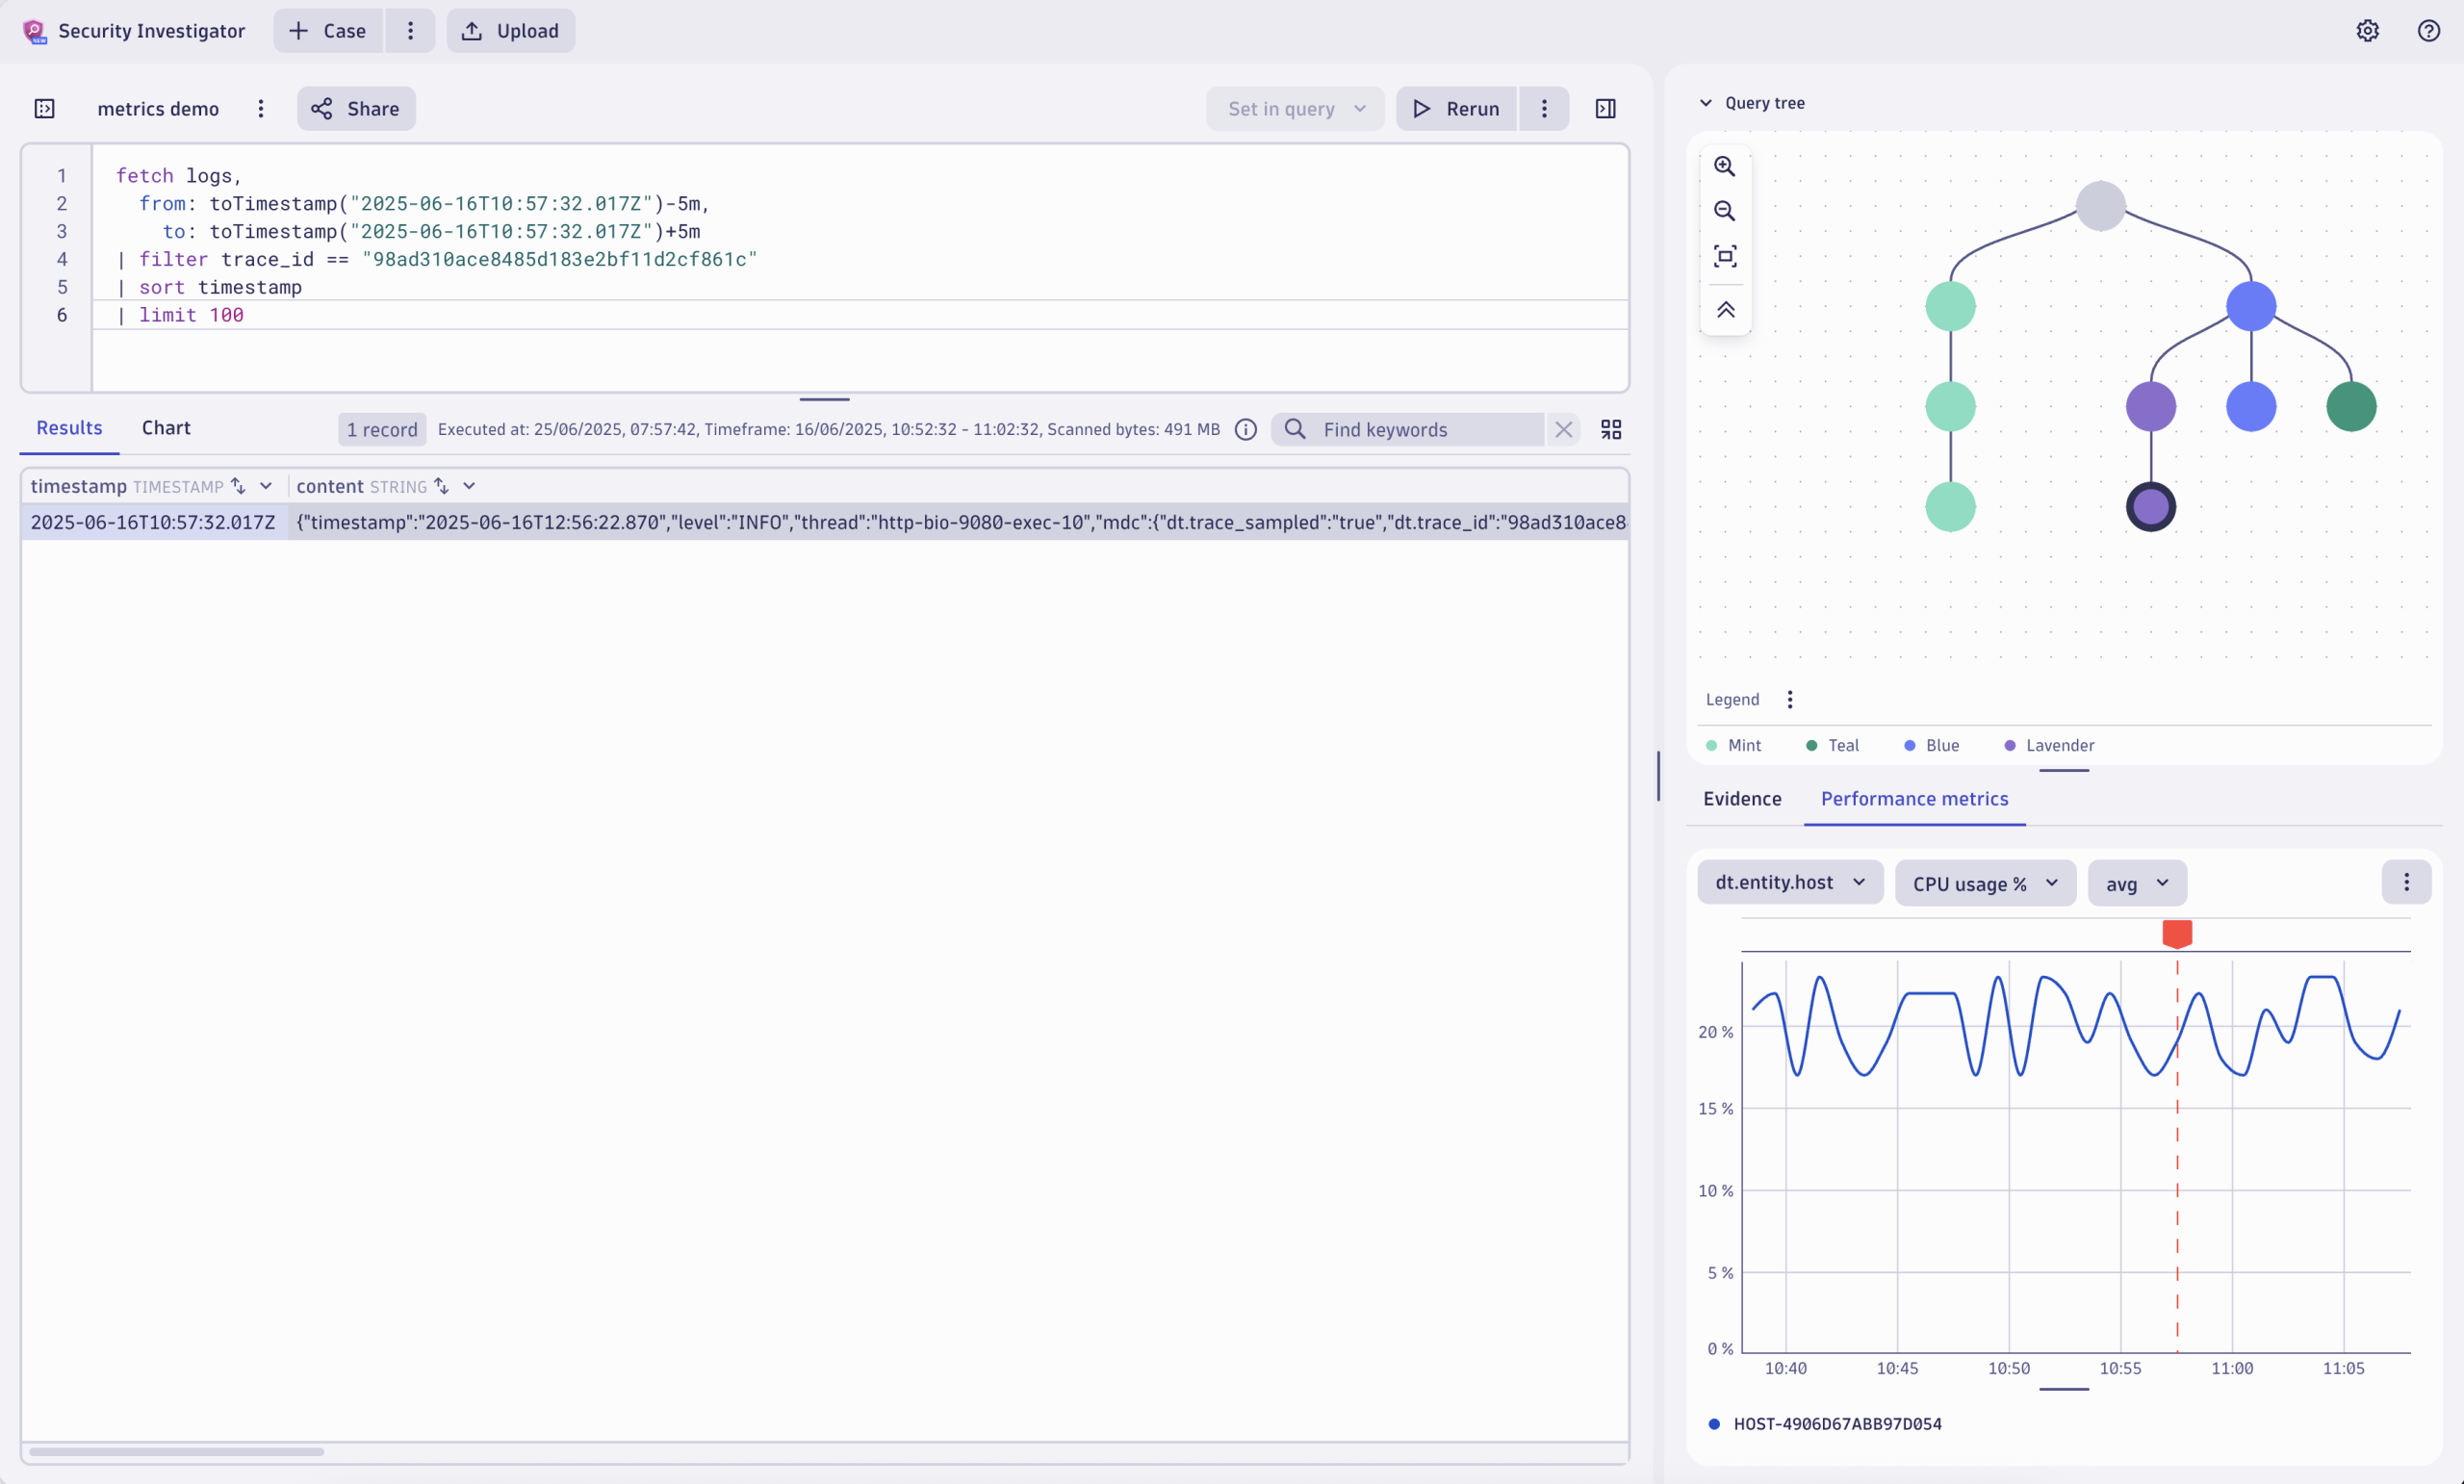
When navigating to other query nodes in your query tree, you can still see the CPU utilization chart, enabling you to analyse other logs in the same context. For example, you might want to analyze your network flow logs from the same period and see how some network requests from the same time might be connected to the pod’s CPU usage. Selecting network flow events moves the red indicator’s position on the chart (shown as a dashed line due to different entity values).
Get started
Visit the Dynatrace Playground to see performance metrics in action or learn more about how performance metrics add relevant context to your security investigations in Dynatrace Documentation.


Looking for answers?
Start a new discussion or ask for help in our Q&A forum.
Go to forum