

This series covers recent Dynatrace releases and updates, focusing on what’s new, what’s changed, and how these recent enhancements can benefit you and your organization. Each post covers newly available capabilities and where to explore them.
This edition focuses on July changes practitioners can use now: faster service and database troubleshooting, connected frontend and backend investigations, simpler onboarding, centralized fleet operations, and workflow improvements.
If you want to see them in action, head over to our Release Radar launchpad on the Dynatrace Playground.
Services helps make endpoint and dependency troubleshooting faster
The Services app gives application teams two ways to help speed up investigations.
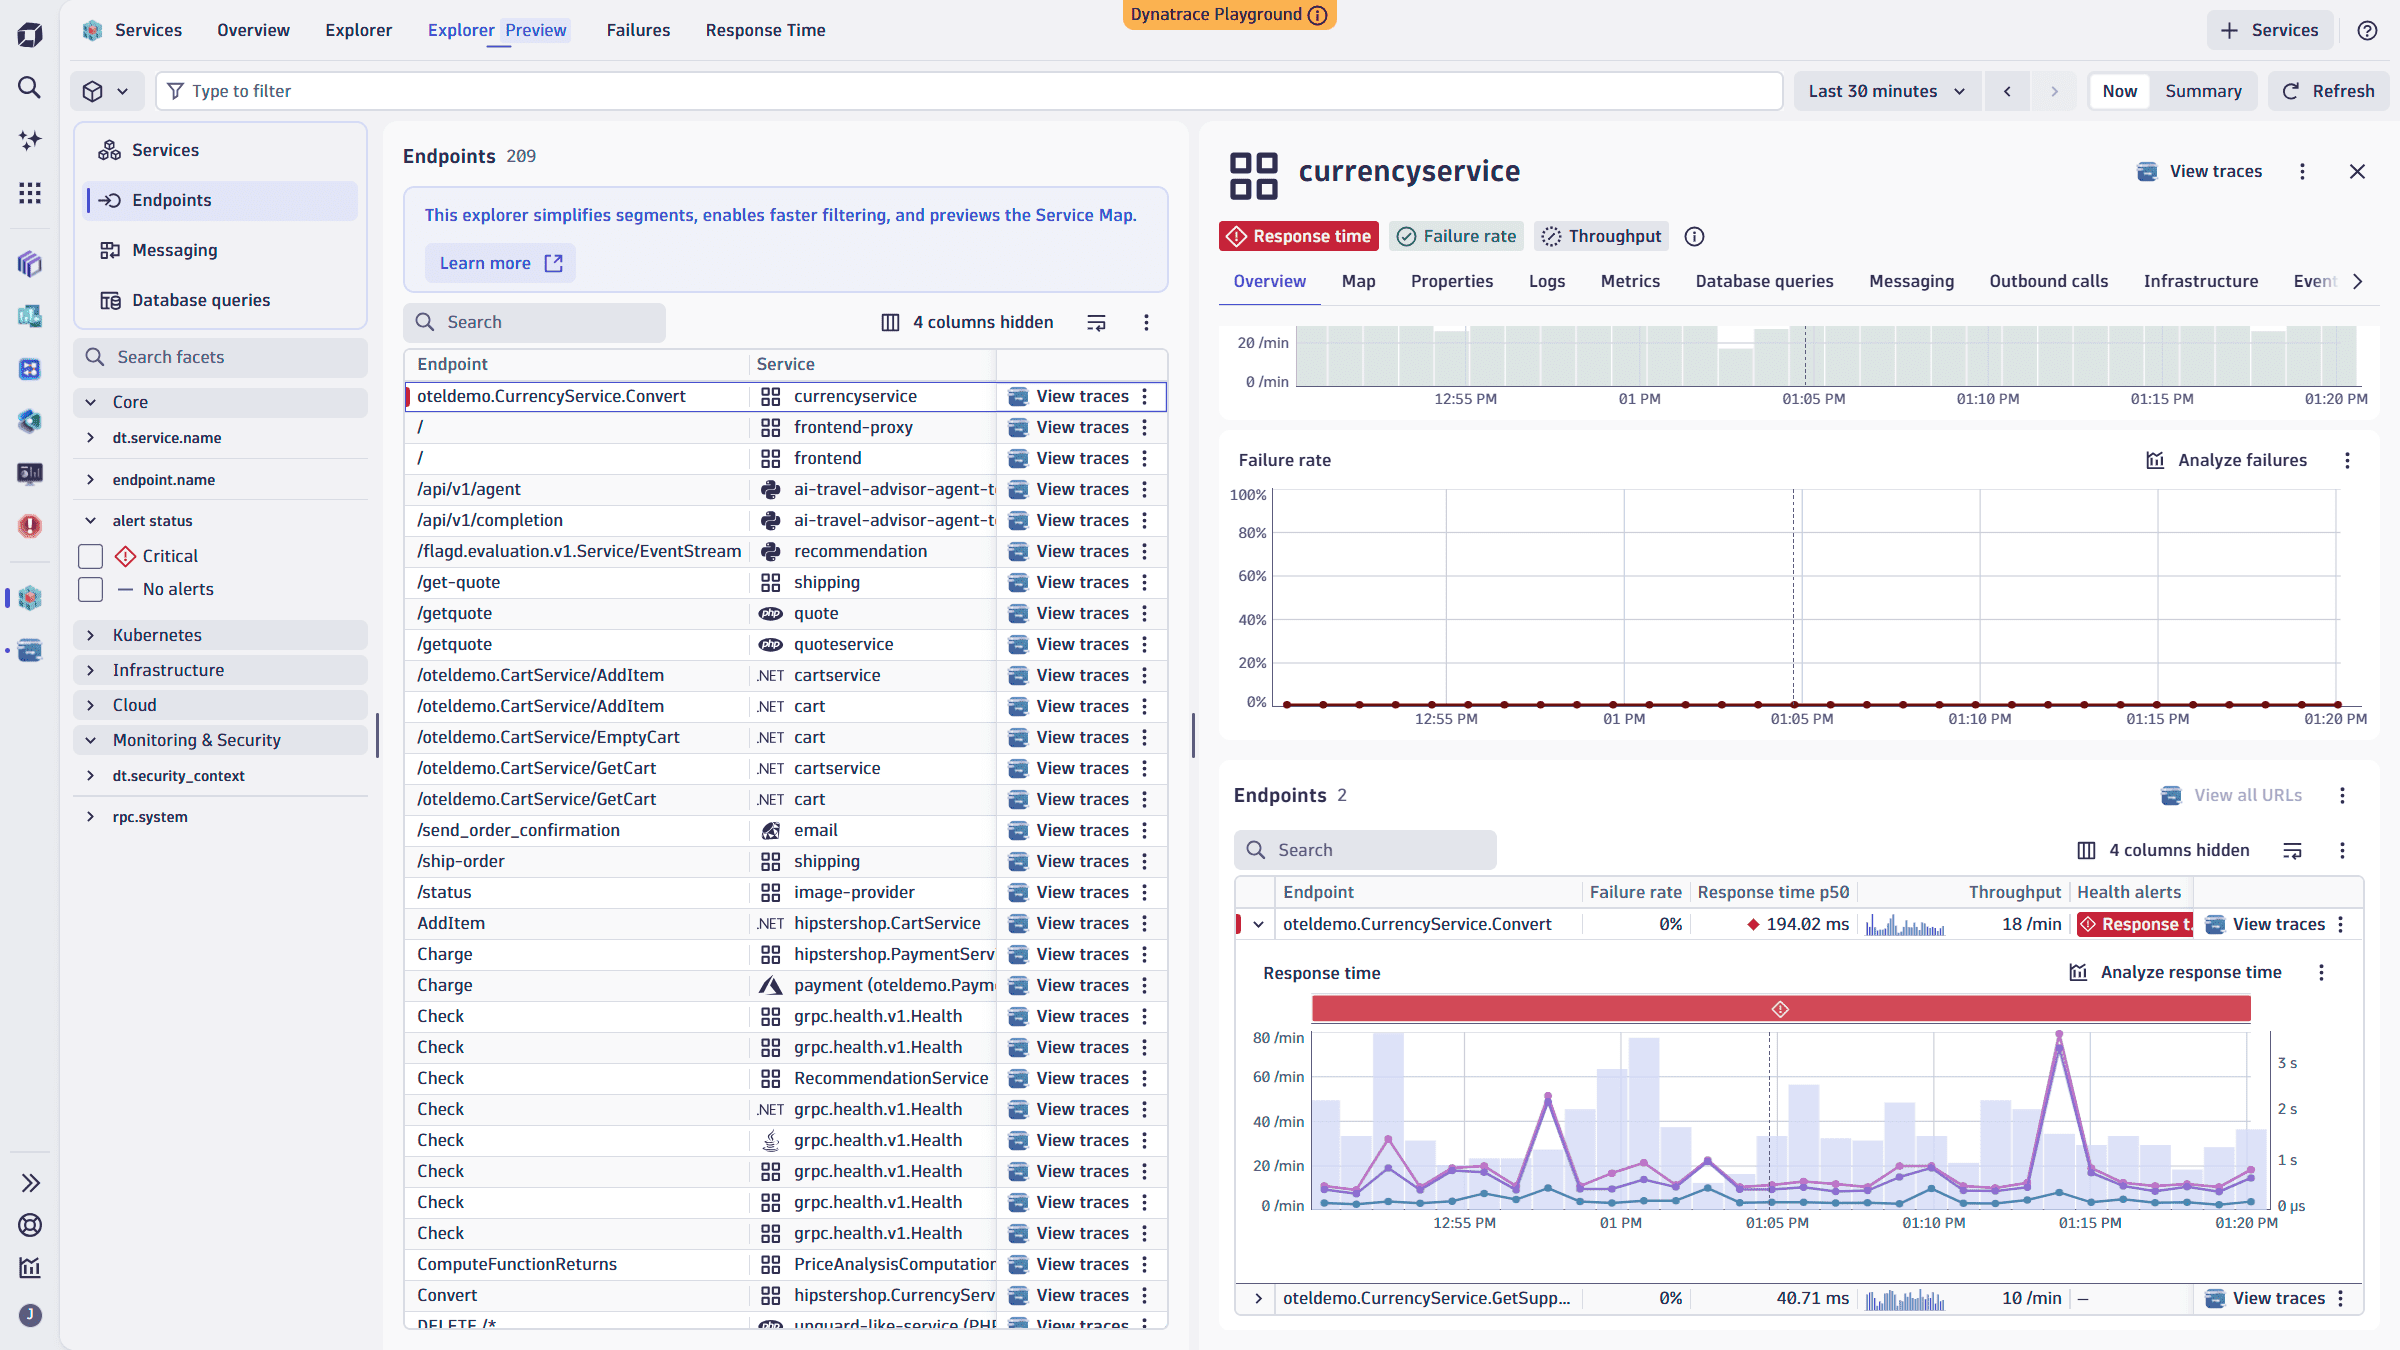
The new Endpoints view shows failure rate, response time, throughput, and health across all service endpoints. Filter by cloud provider, Kubernetes cluster, HTTP status code, and other fields, then open the relevant distributed traces directly.
Service Map shows upstream frontends, downstream dependencies, health states, and live rate, errors, and duration (RED) metrics.
The Service Map shows upstream frontends, downstream services, databases, and queues on one screen. Health states distinguish active problems from downstream impact. Each node links to Distributed Tracing, Logs, Databases, or Frontends with context preserved.
Digital Experience helps correlate user actions, sessions, and traces
Digital Experience adds more context to frontend investigations.
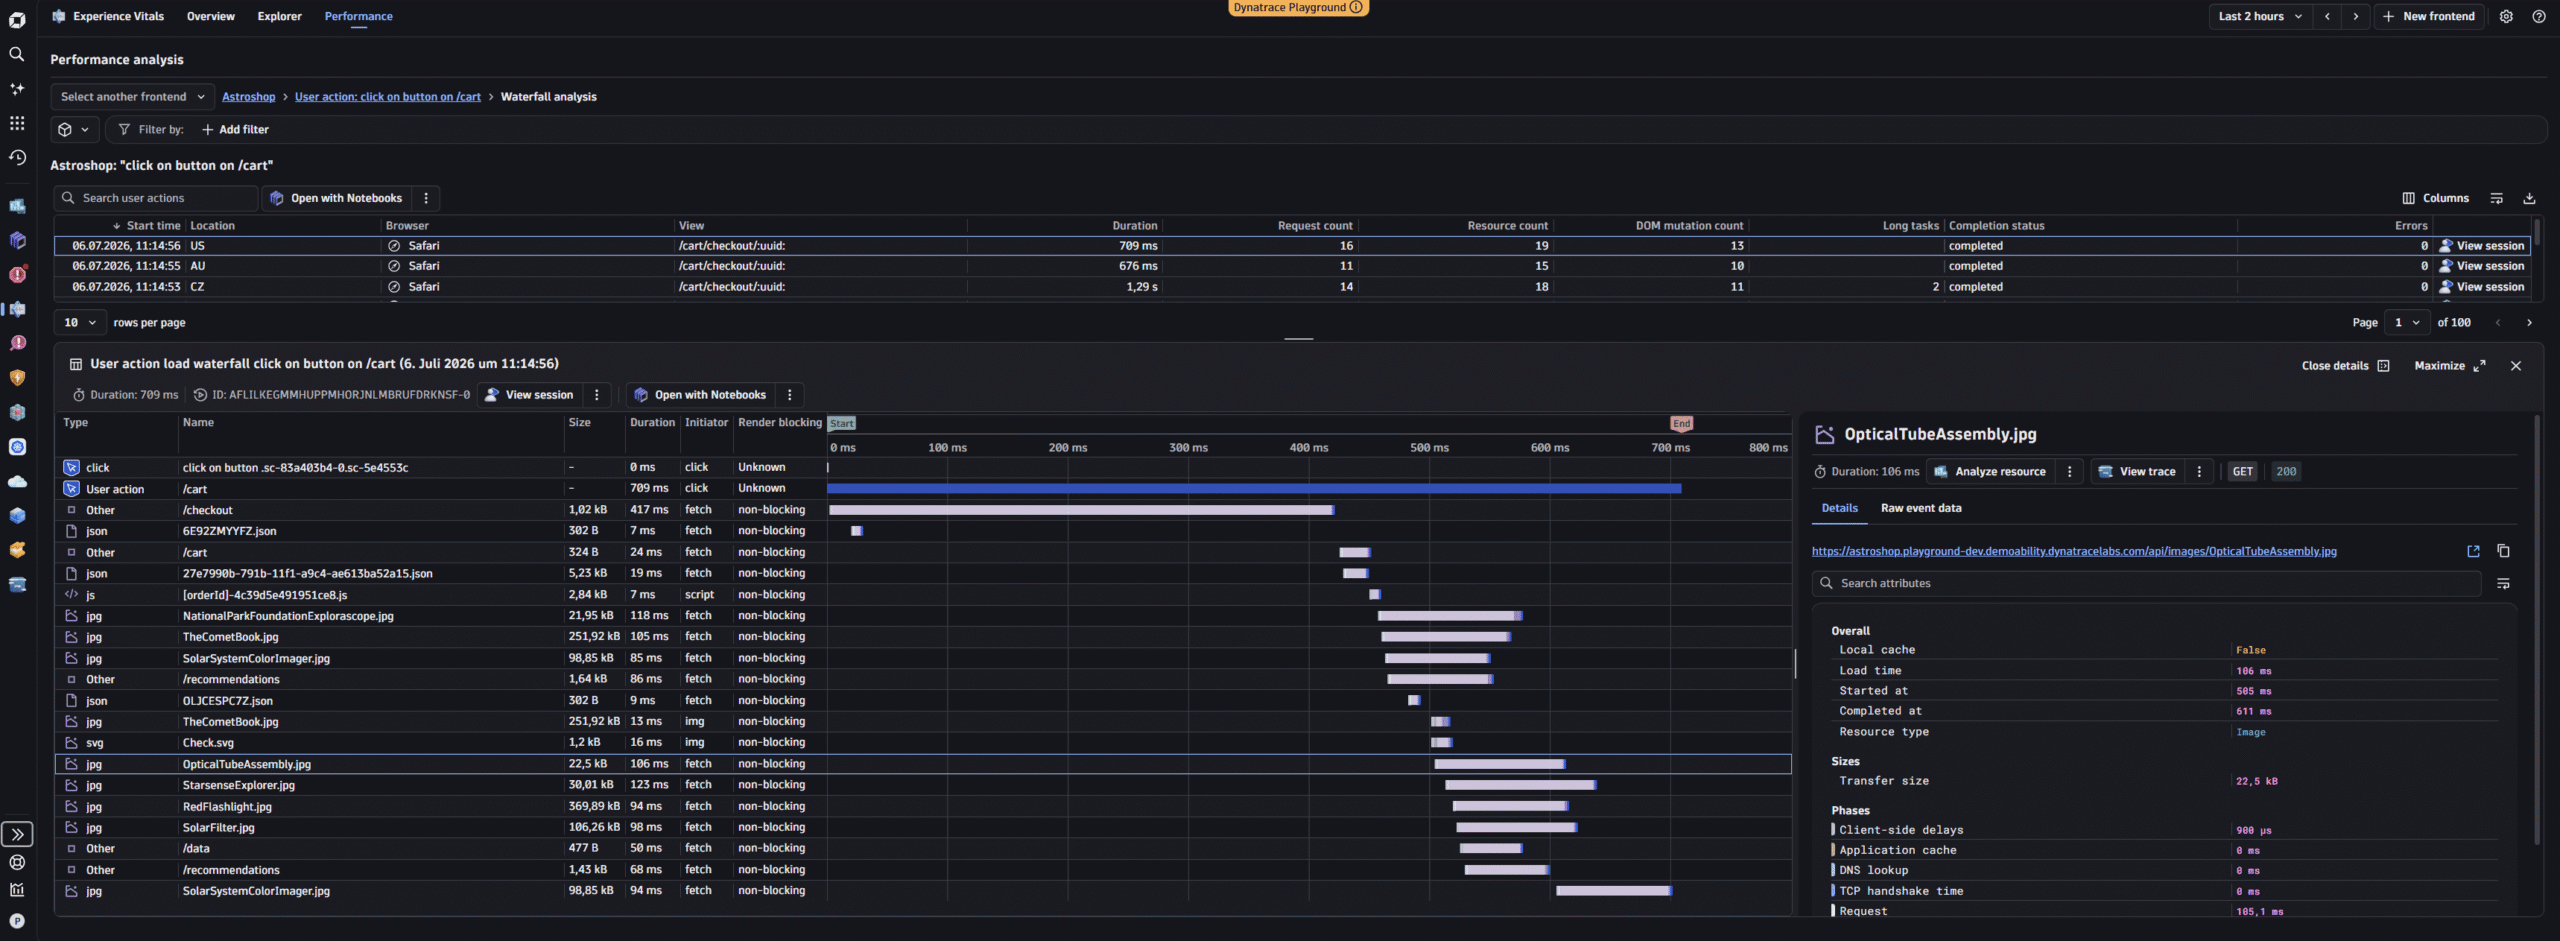
User action analysis gives web and mobile actions a consistent model. Experience Vitals shows action counts and duration, with drilldowns into details, sessions, errors, waterfalls, and traces.
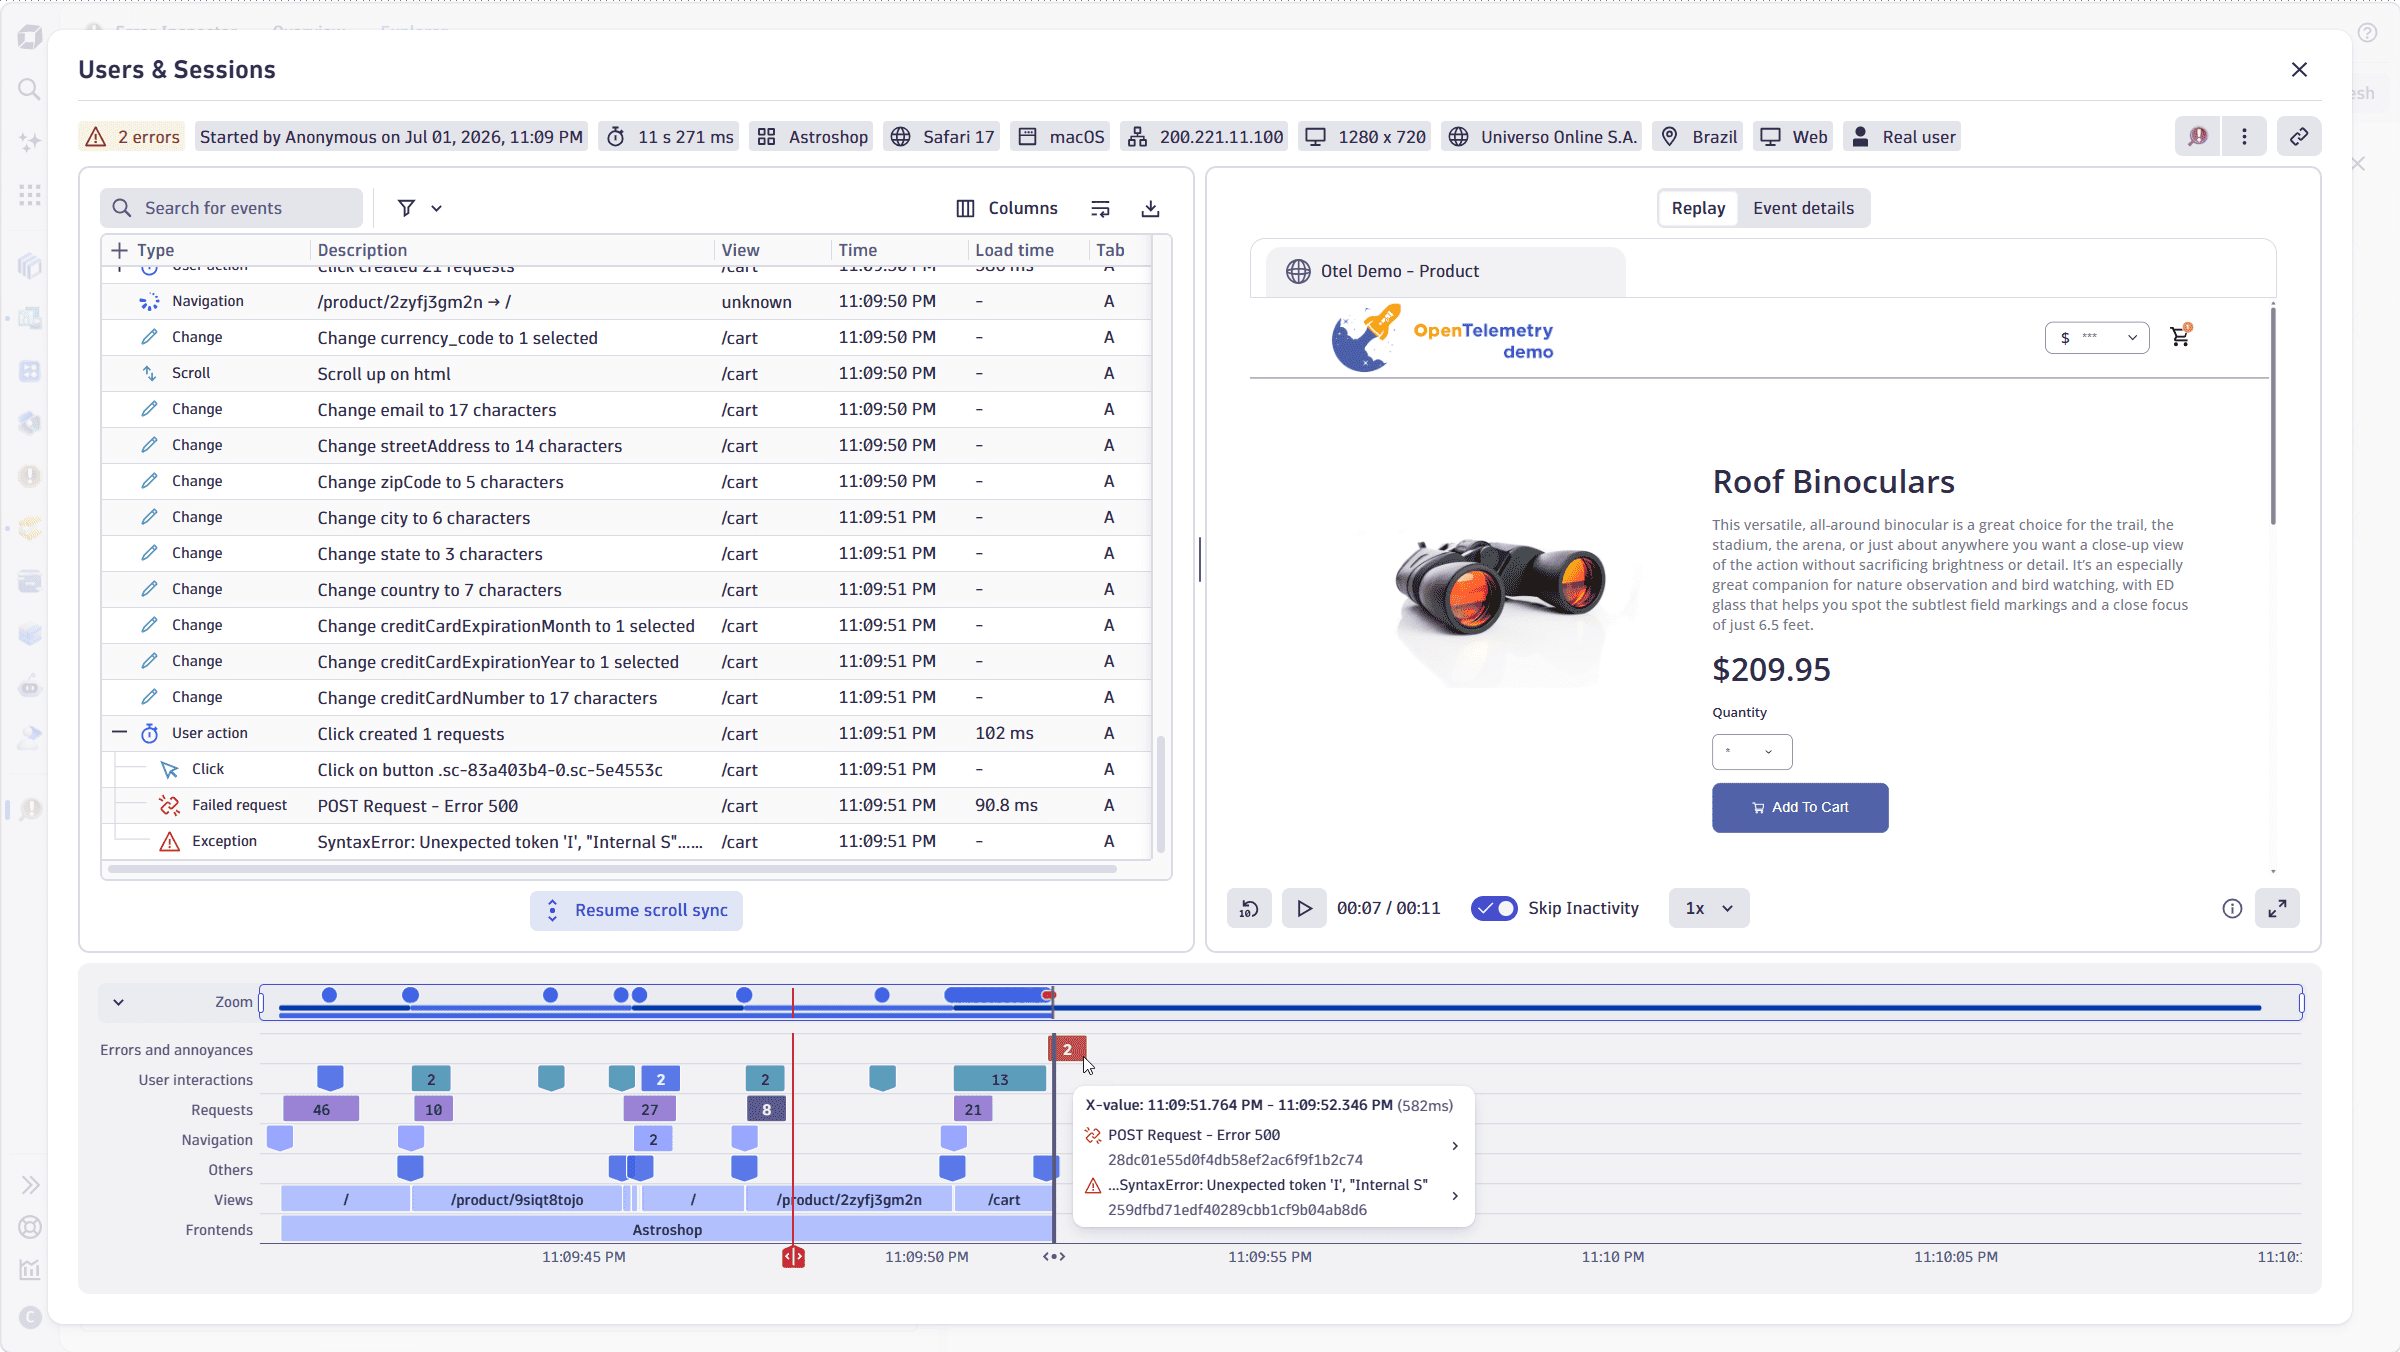
Session Replay on Grail is generally available. Users & Sessions connects recordings, event markers, filters, and raw events for web, iOS, and Android applications.
Frontend to backend linking and vice versa
Dynatrace provides bidirectional linking between frontend experience data and backend traces.
From frontend to backend, Dynatrace Real User Monitoring (RUM) adds W3C traceparent and tracestate headers to outgoing requests from monitored browser and mobile apps. The backend continues that trace context, linking user events and sessions to the corresponding distributed traces. This established workflow also supports backends instrumented with OpenTelemetry, even when OneAgent is not used on the server side. Teams can use trace-context links to investigate related services and spans.
Explore related frontend user events and sessions directly in Distributed Tracing.
From backend to frontend, Distributed Tracing spans show related user events and sessions in the span panel. Links open Users & Sessions, Experience Vitals, or Error Inspector. The workflow supports OneAgent and OpenTelemetry.
Together, these links create a continuous investigation path between frontend behavior and backend execution. Teams can move from user impact to the responsible service, or from a backend symptom to the affected user experience, without rebuilding context manually.
Databases adds deeper PostgreSQL and MySQL analysis
The Databases app adds deeper PostgreSQL and MySQL analysis.
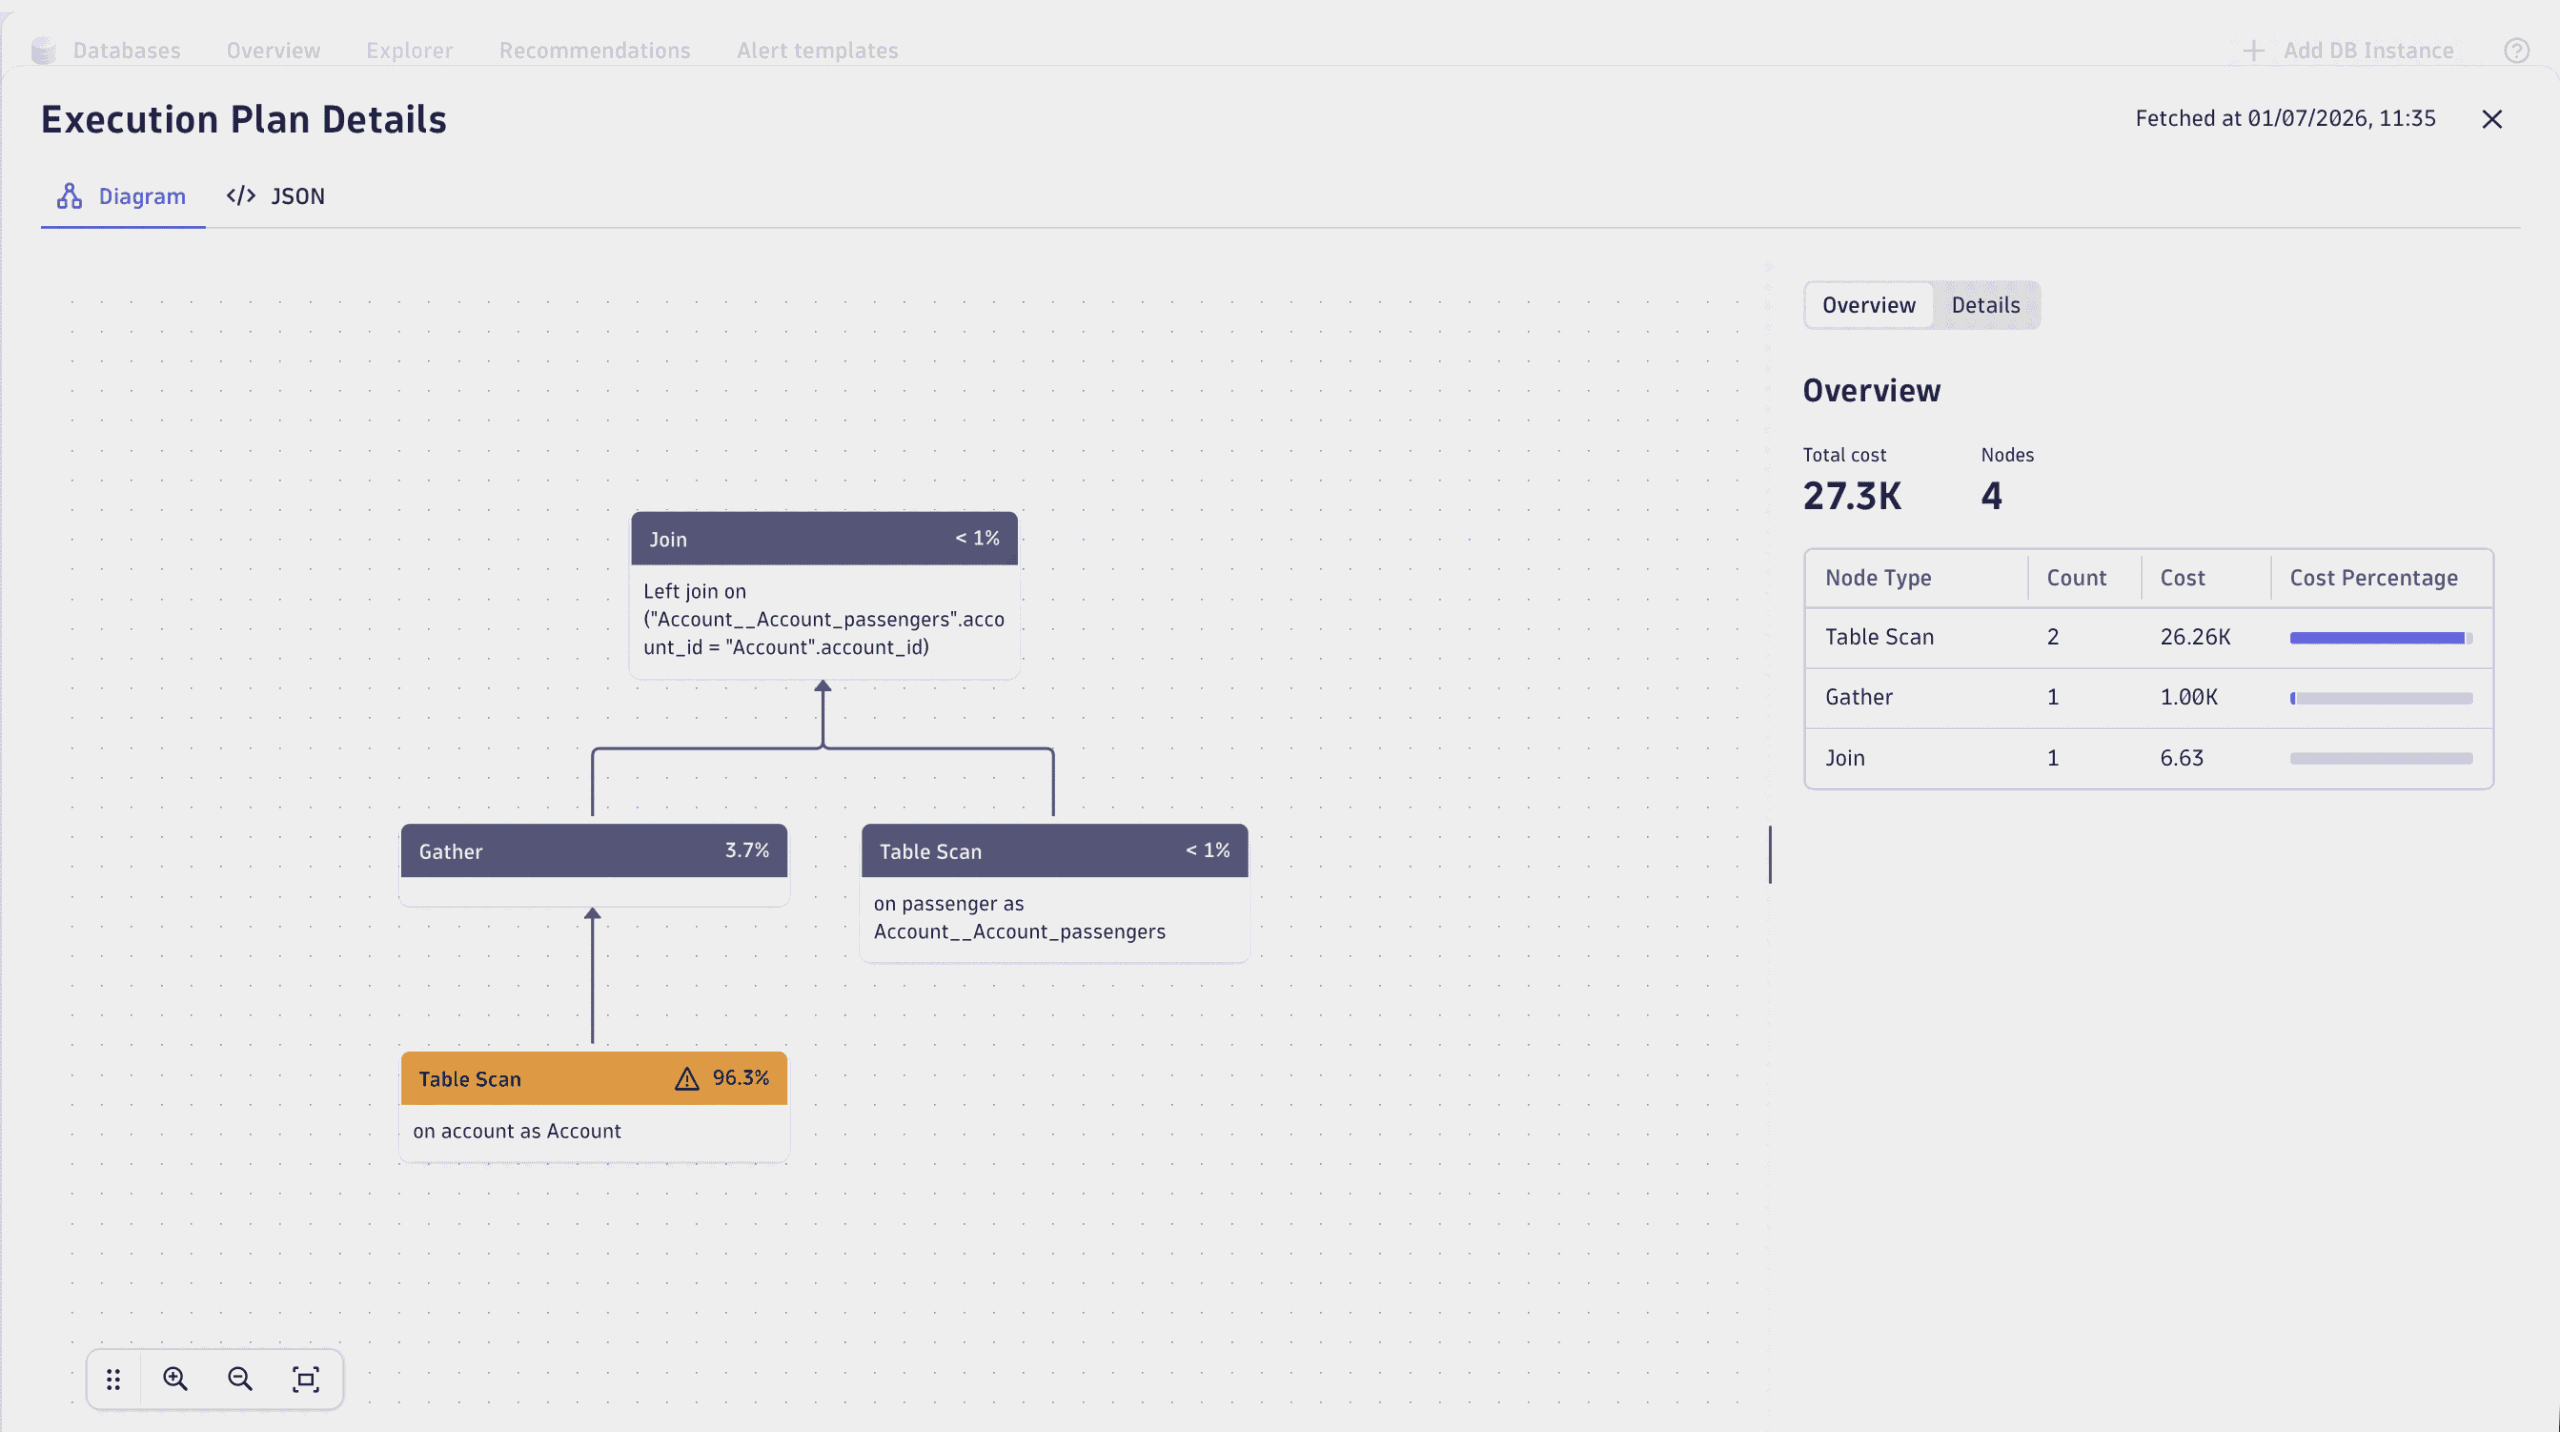
Query execution plans are now visualized in an interactive view. Instead of reading a raw plan, teams can see how a query runs to help spot common problems such as full table scans, expensive joins, and large sorts.
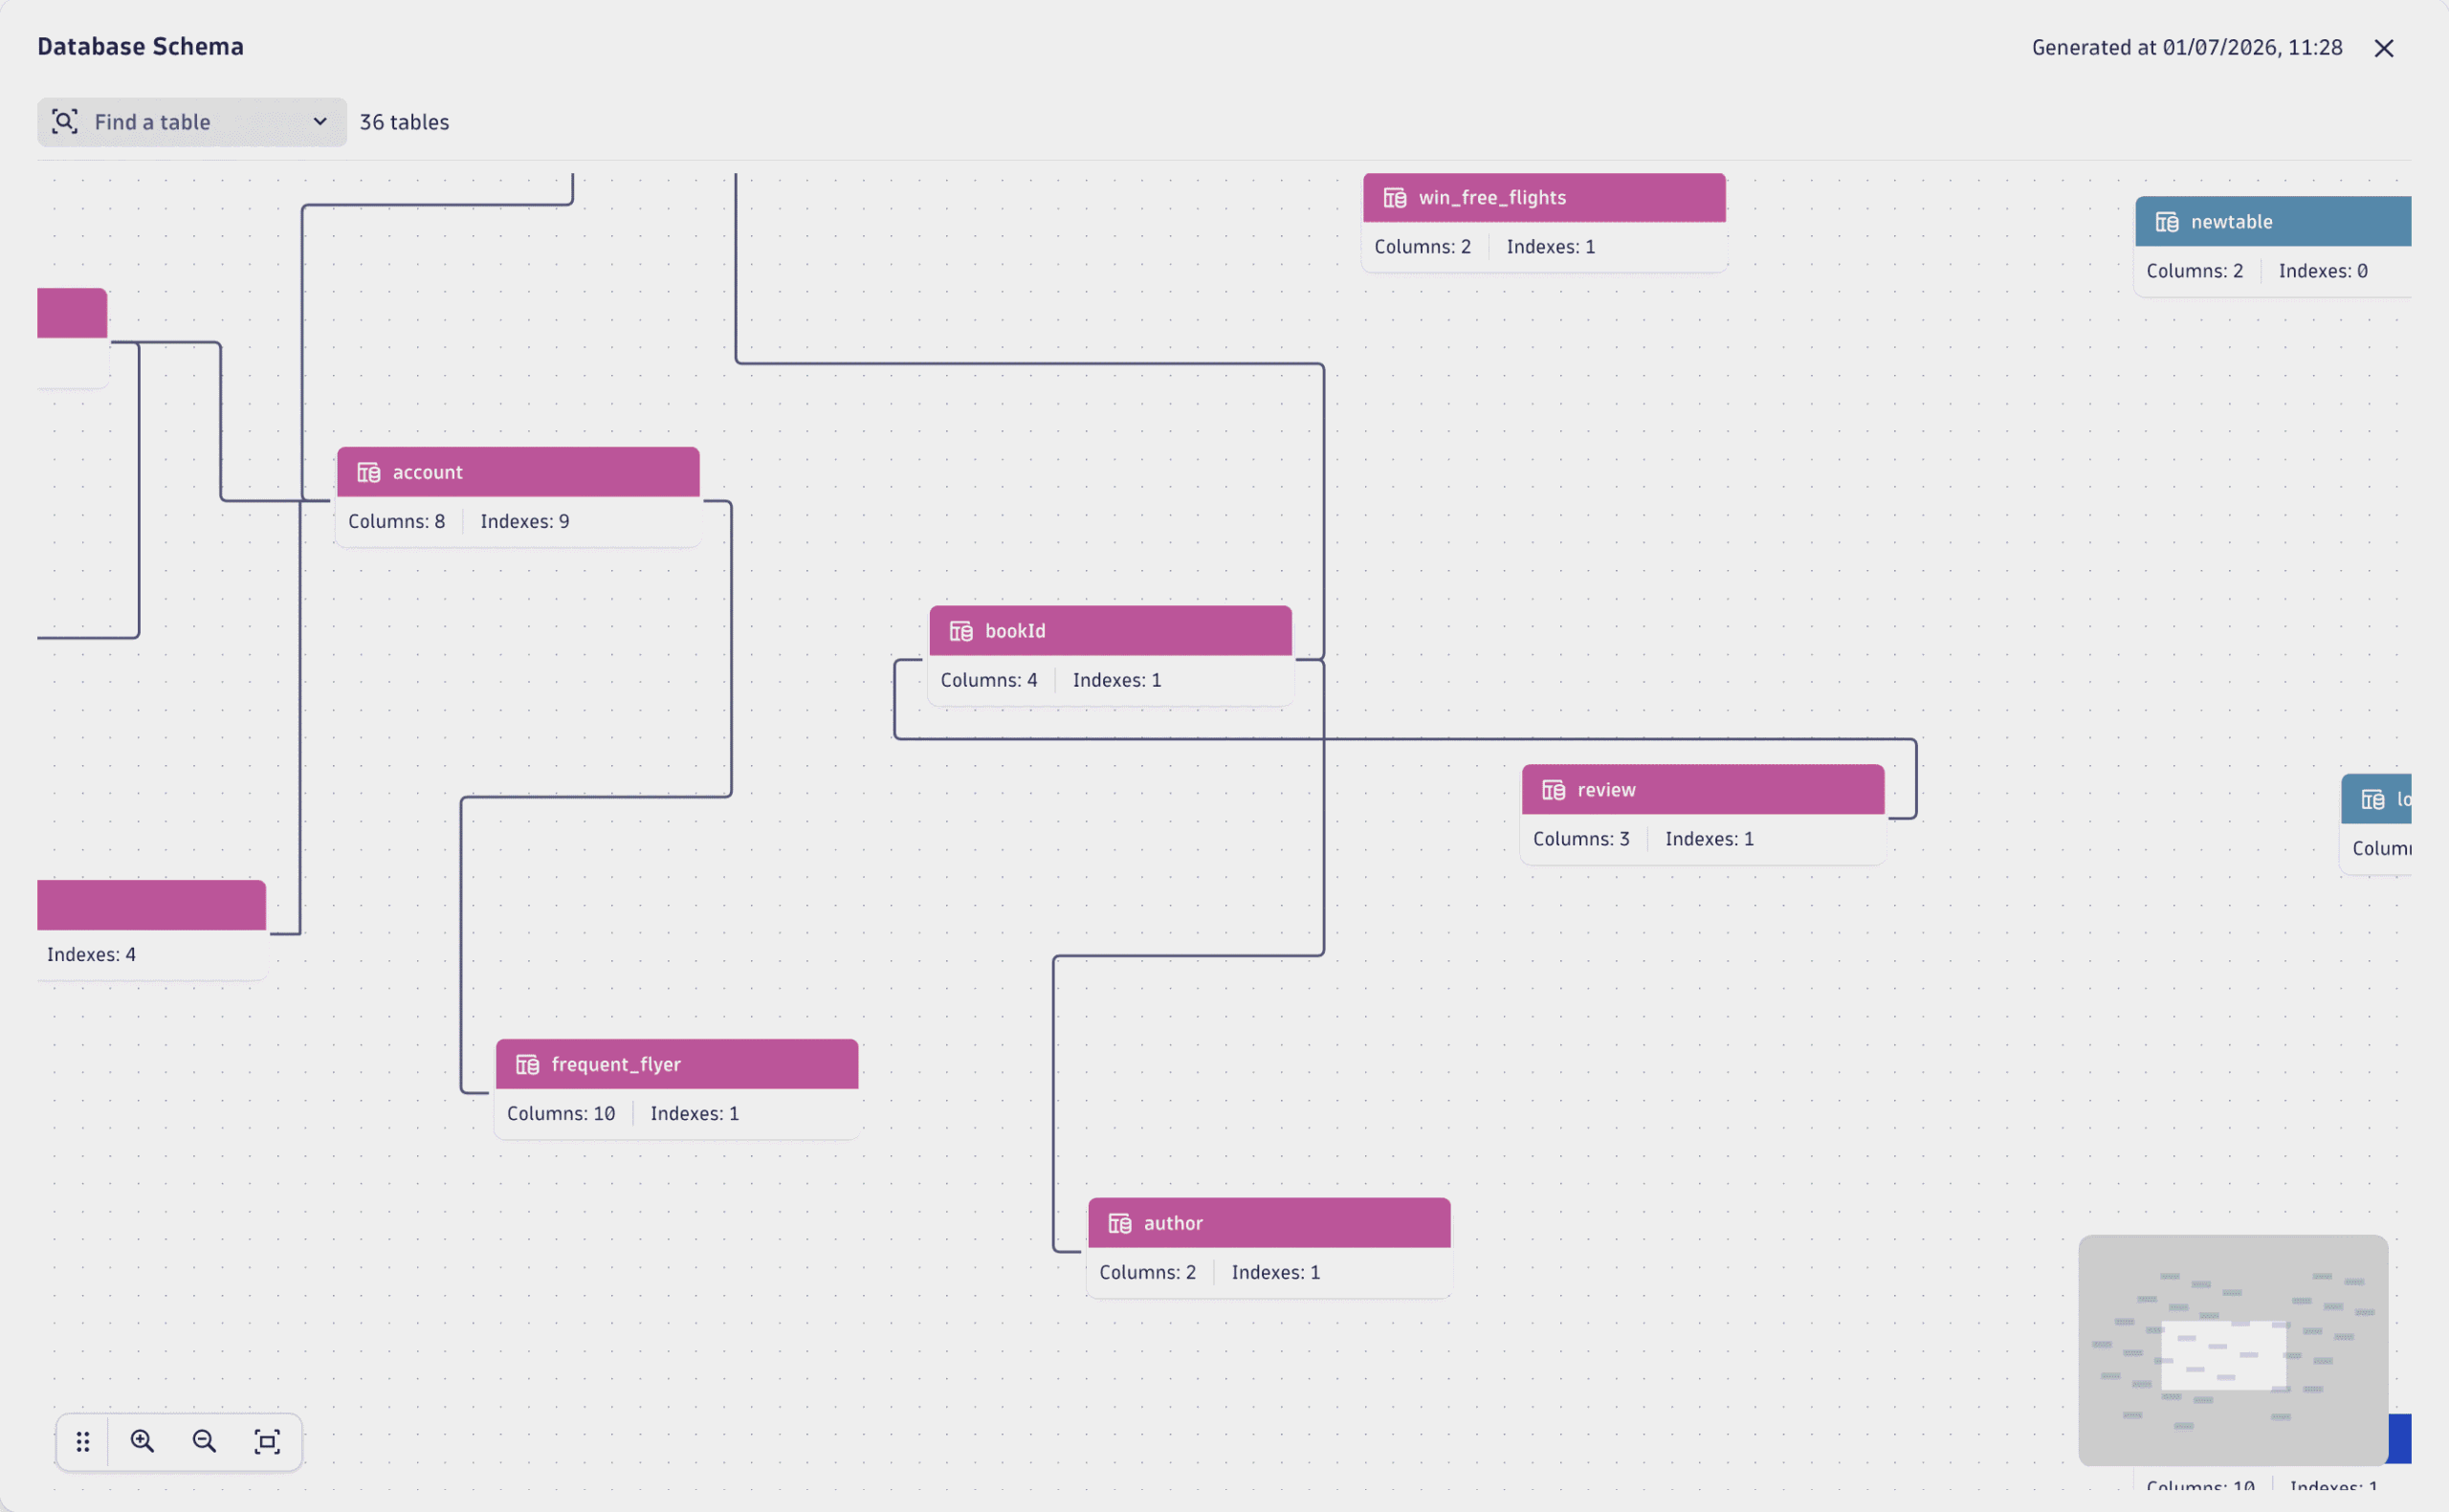
Schema visualization shows database structures, relationships, and performance signals. Table and index metrics add size, row count, read and write activity, index usage, and growth trends. Active Connections Analysis adds a Connections & Blocking view with concurrent connections, query details, wait groups, and application context.
QuickStart and dtwiz make onboarding faster
QuickStart and the dtwiz CLI can help setup new environments in minutes, allowing users to see real telemetry right away.
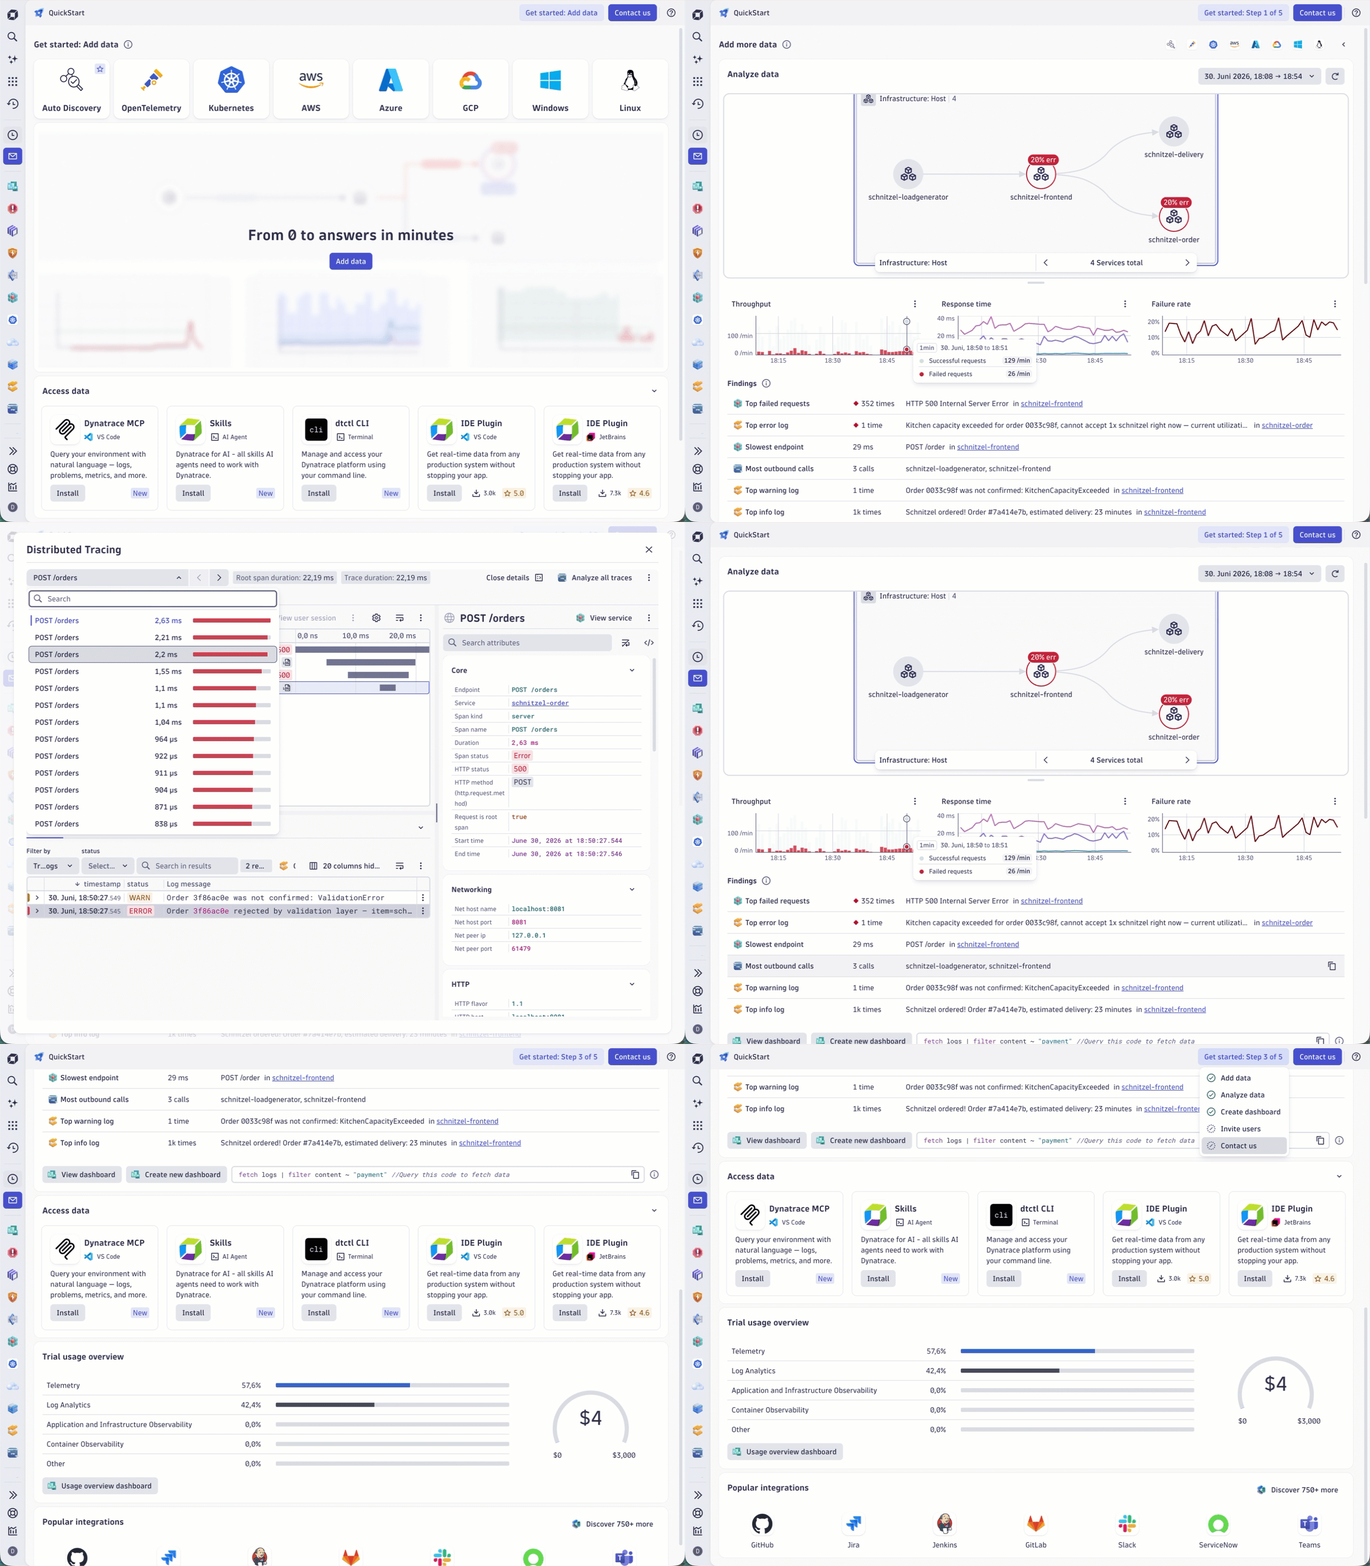
QuickStart guides setup, shows the connected stack, and links directly to topology, metrics, traces, and logs.
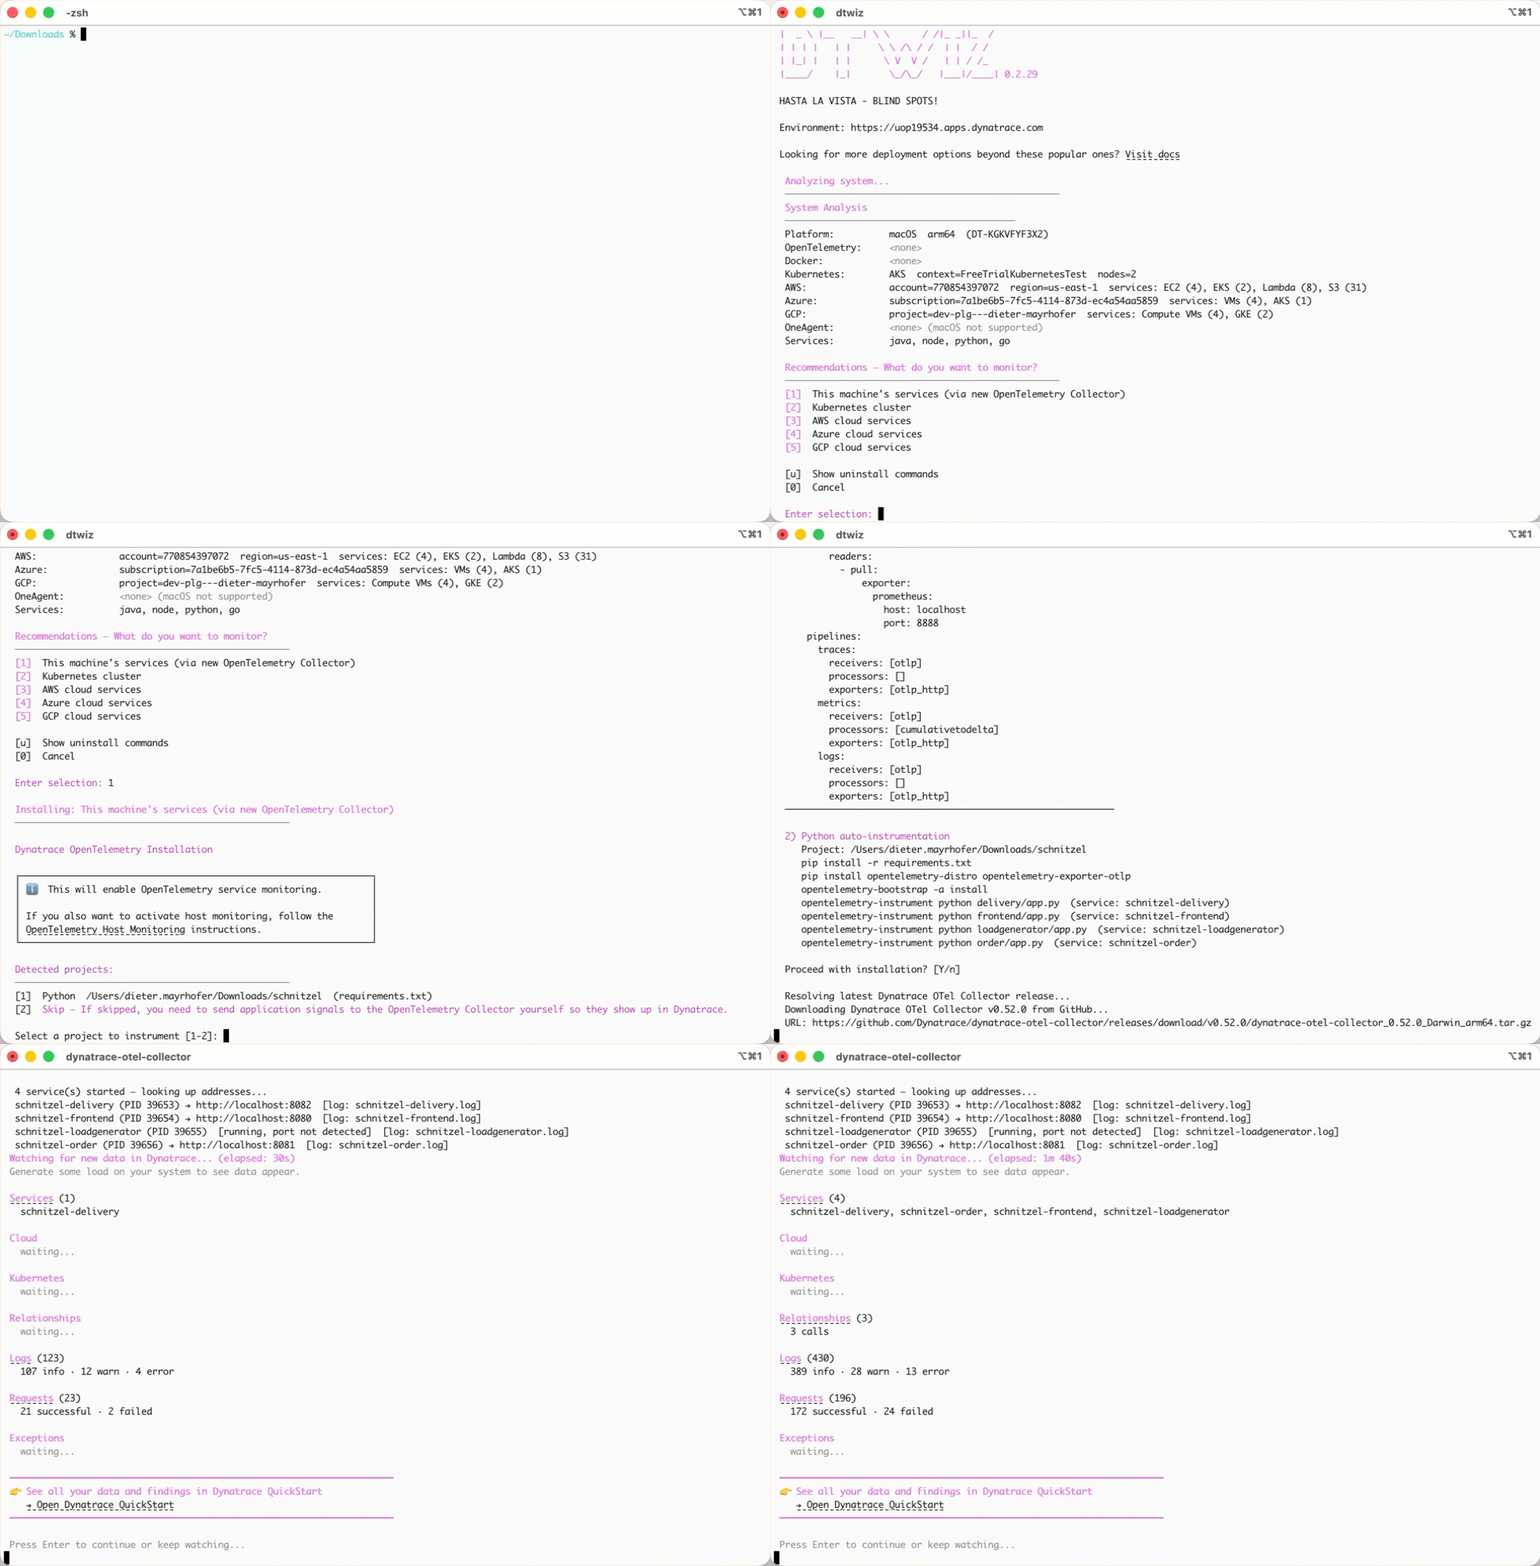
dtwiz can detect supported components in the local environment, selects an ingest method, and confirms incoming data with live watch mode. It supports OpenTelemetry, Kubernetes, AWS, Azure, GCP, and Windows or Linux hosts.
Fleet Management provides a centralized management interface for OneAgent and ActiveGate operations
Fleet Management is now available as the central place to manage Dynatrace edge components at scale.
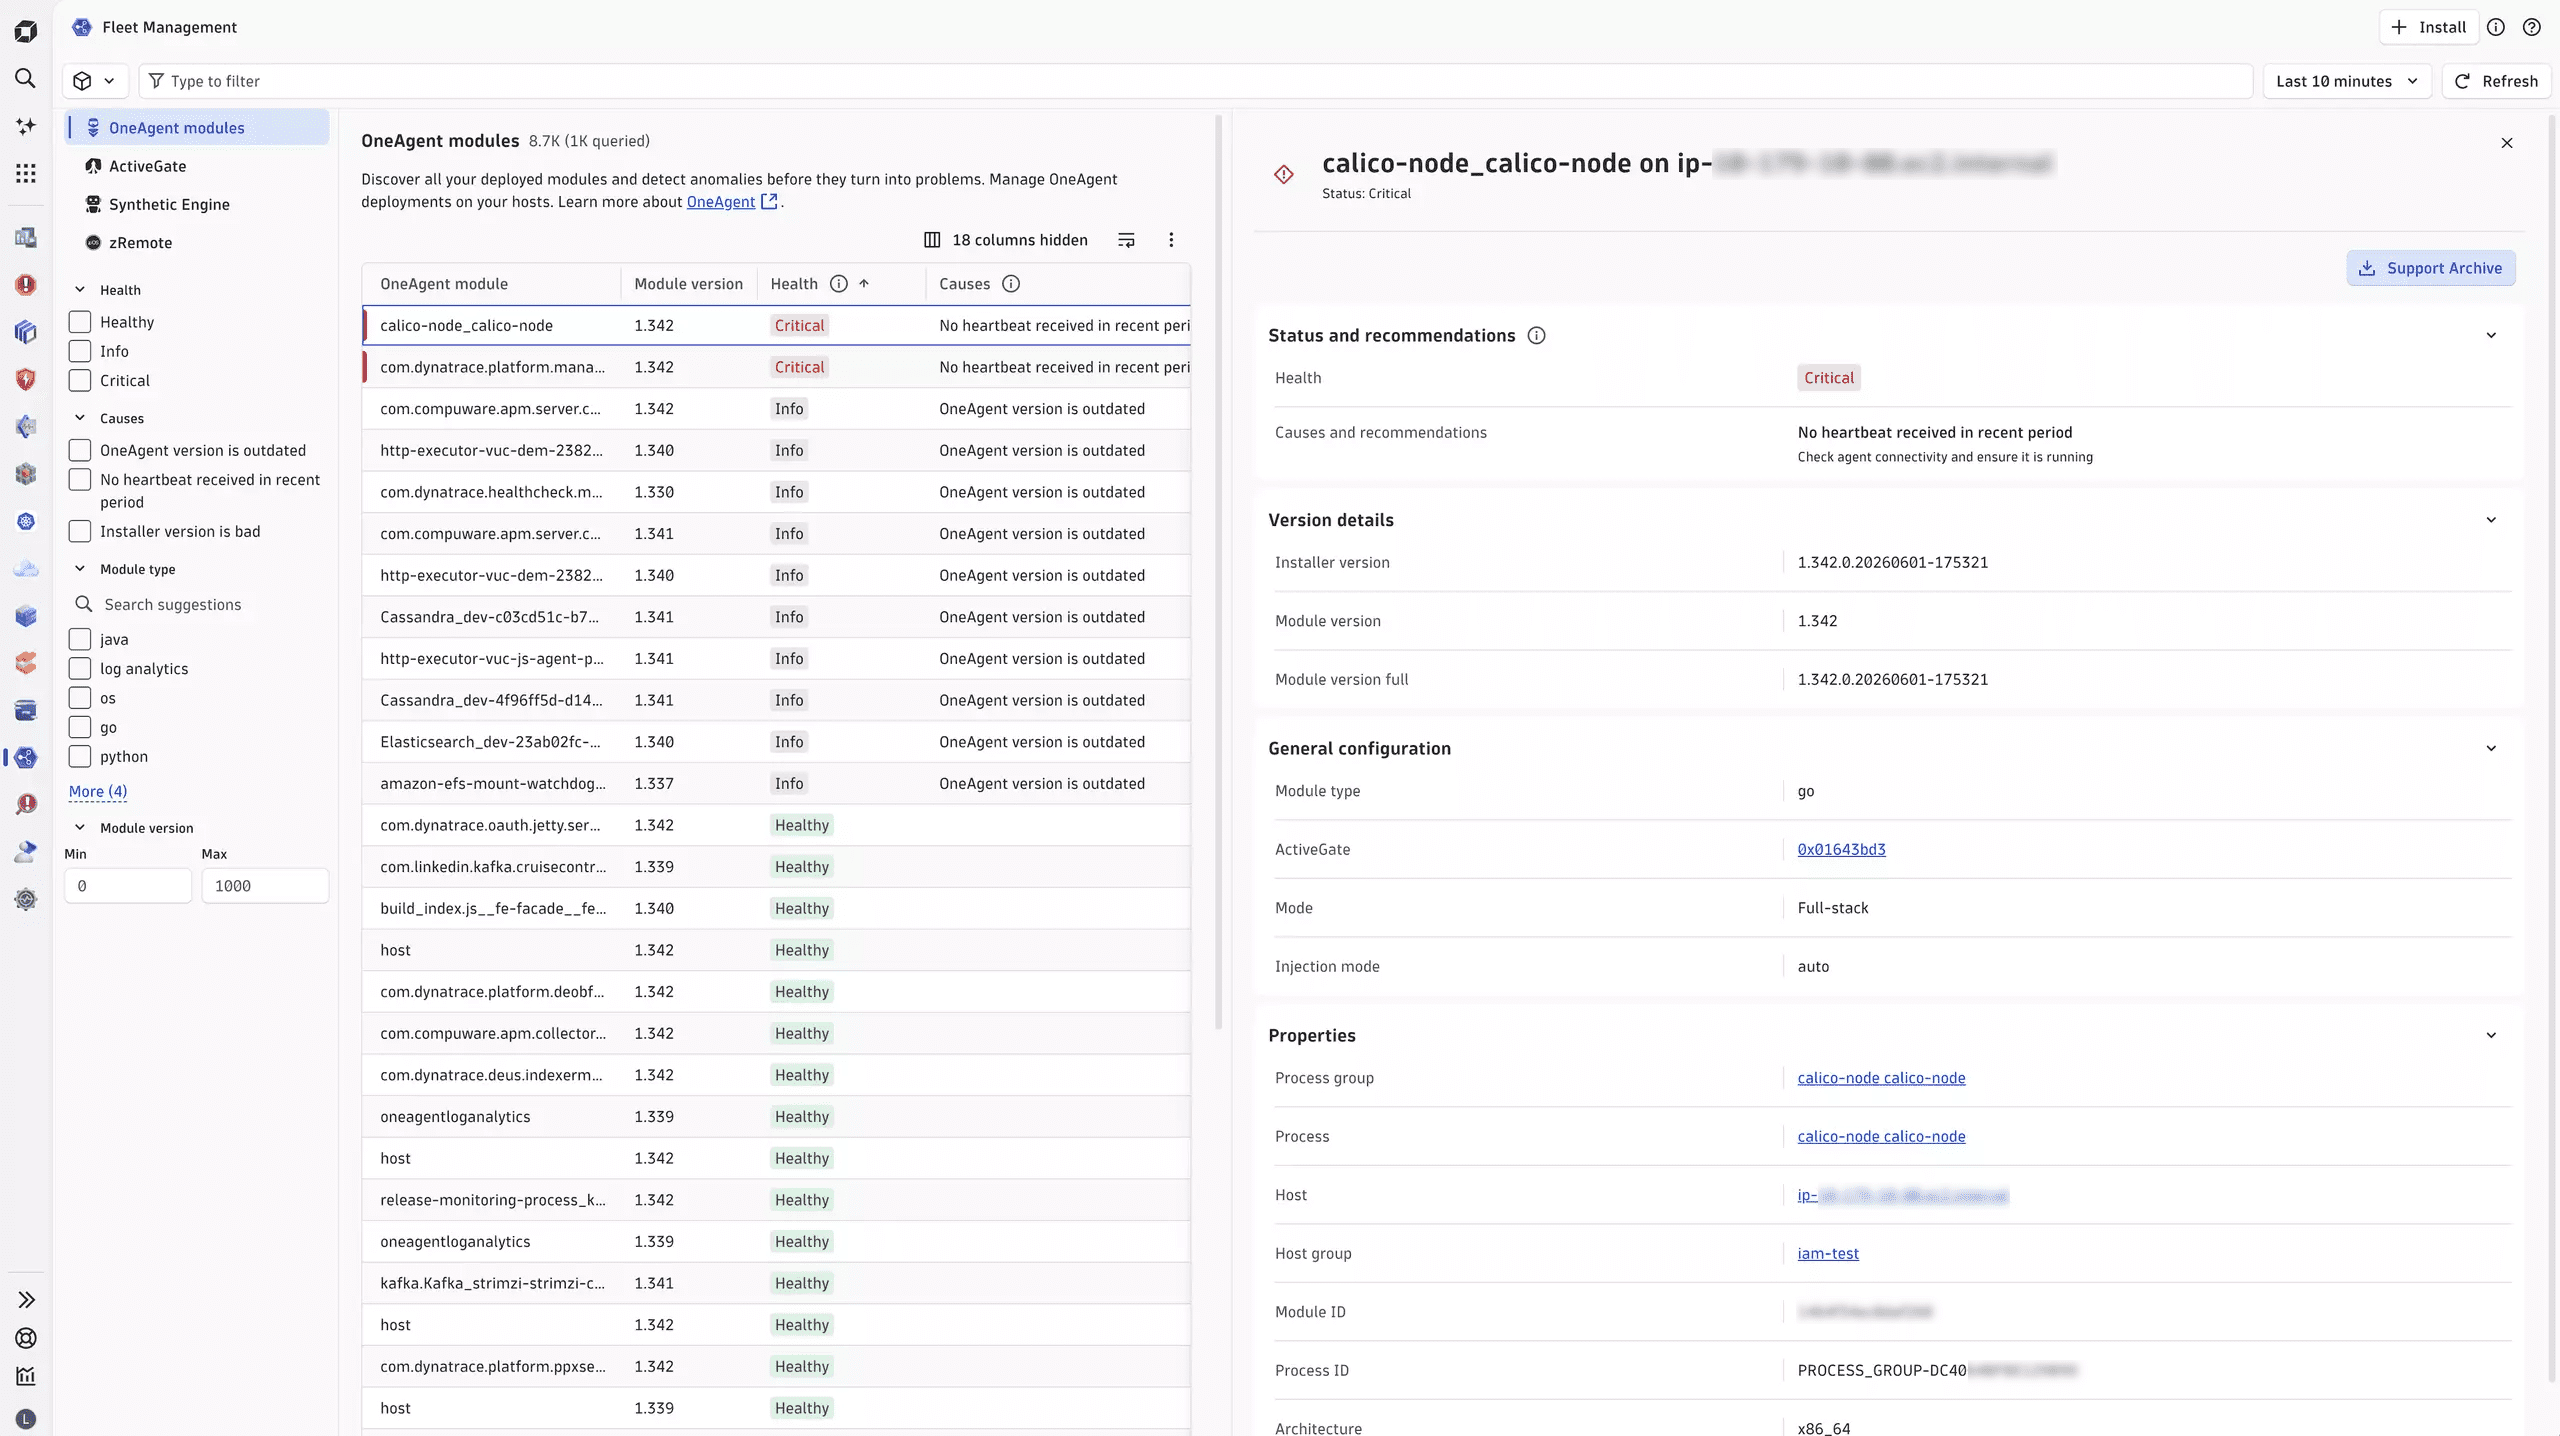
Administrators can monitor health and deployment status for OneAgent and ActiveGate, troubleshoot component issues, manage network zones, schedule updates, and use fleet data in dashboards and workflows. OneAgent module health is also queryable with Dynatrace Query Language (DQL).
ActiveGate operations get the same type of update controls that OneAgent already has. You can choose target versions, define update windows, use environment defaults, and override settings for specific ActiveGates. Manually managed ActiveGates expose an Update now action for the selected target version.
Performance, drilldowns, and navigation improvements
Infrastructure & Operations introduces navigation and context enhancements:
- Smartscape Explorer loads large topologies faster.
- Network devices and interfaces appear in topology, preview, and inventory views.
- Network inventory opens entity details directly.
- Process details show Ruby metrics alongside z/OS properties.
- Inventory shows security status instead of vulnerability counts and supports primary tag filters.
- App-only hosts state their monitoring scope clearly.
Keyboard navigation works across Logs, Traces, Services, and QuickStart: L opens Logs, T opens Traces, S opens Search, F opens the filter bar, and Esc closes the active panel or overlay.
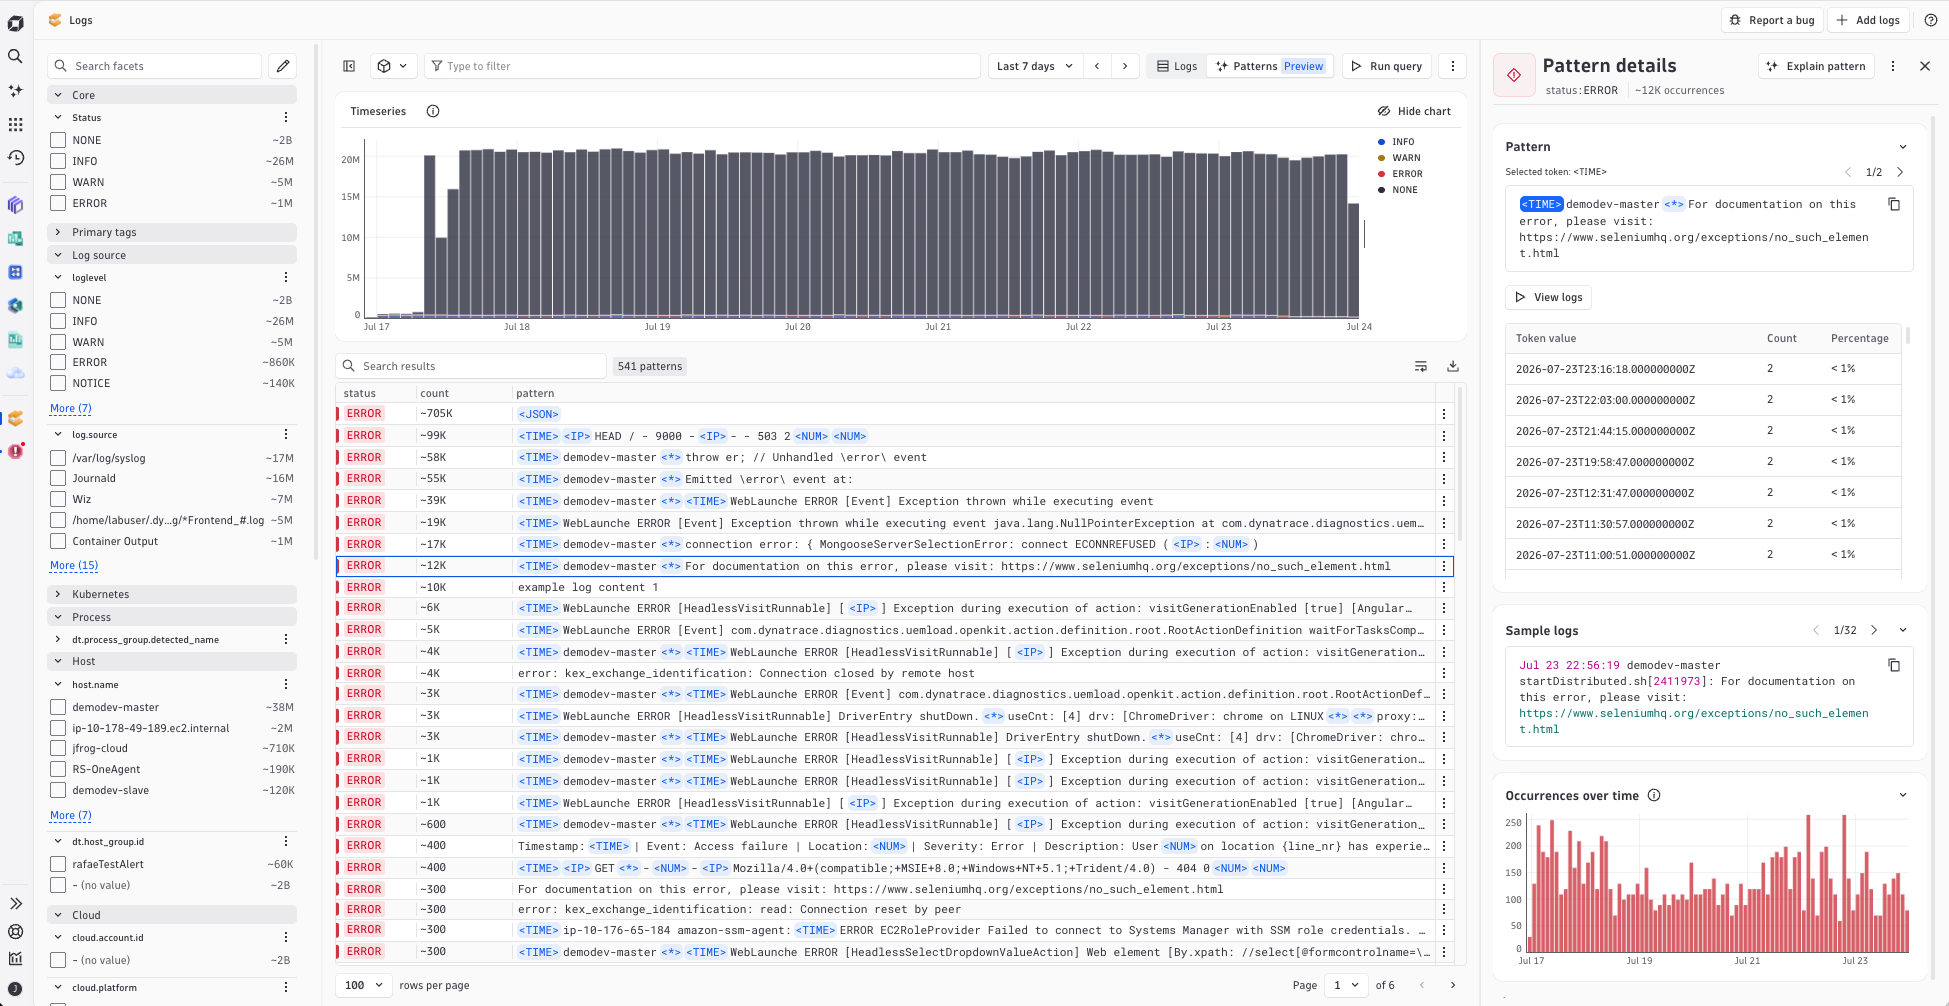
Log Pattern Analysis shows token counts and values together, uses color-coded status and log-level chips, and makes patterns and sample logs easier to read and expand.
Navigation and analysis fixes add descriptive browser titles, preserve back and forward history across QuickStart, Logs, Services, and Traces, clarify Failure Analysis empty states, and improve stack-trace counts, expansion, and copy actions.
Why these changes matter
The July releases introduce capabilities intended to streamline investigation and operations workflows. Practitioners can find endpoint failures, follow context between frontend and backend, analyze database bottlenecks, onboard data sources, and manage OneAgent and ActiveGate fleets with fewer steps.
These changes are designed to help users move from detection to investigation more efficiently.

Looking for answers?
Start a new discussion or ask for help in our Q&A forum.
Go to forum