
Phenisys, a French IT consulting firm and Premier Dynatrace® Sales Partner, has been dedicated to IT observability and application observability for over 20 years. Their deep expertise in performance optimization—through audits, strategic consulting, and seamless implementation—has led to the development of a powerful Dynatrace app that allows users to diagnose a Microsoft Teams call in just three clicks.
Over one million organizations use Microsoft Teams as their default communication platform, resulting in a significant surge in user numbers to over 320 million worldwide in 2024. As such, MS Teams has its own set of challenges in terms of triaging, troubleshooting, and diagnosing disruptions. Phenisys has answered that challenging call and built an intricate Microsoft Teams Observability app that can help organizations answer questions like “Are you getting the best Microsoft Teams experience?”, or “Would you even know if you weren’t getting the best experience?”
Various challenges with effective Microsoft Teams observability include:
- The wide variety of potentially impacted components, for example, a network outage, an issue with a local device, or a larger outage.
- The spread of teams and employees that would potentially be included in the diagnosing and troubleshooting process, for example, SREs, IT Ops, helpdesk, or network teams.
- Native tools and data can be limited, making the correlation of user experience with potential backend issues complex.
Phenisys addresses these challenges with an app that combines AI-powered analysis, enriched metrics, and contextual data—giving teams fast and actionable insights.
In this blog post, you’ll learn how to utilize the deeply integrated features to diagnose any Microsoft Teams call issue in only three clicks:
- Identify the troublesome call (by user name or call ID)
- Review the call’s waterfall timeline for abnormalities
- Diagnose the root cause of the issue(s)
Streamlined insights into Microsoft Teams performance
For the ingenuity and potential impact of their app, Phenisys was awarded first place in the 2024 Dynatrace® Partner App Competition, where partners were challenged to utilize Dynatrace AppEngine to solve real-world customer use cases. With recent statistics showing around 2.7 billion virtual meeting minutes every day (equivalent to over 5,000 years), this is certainly a high-demand use case.
Key features include:
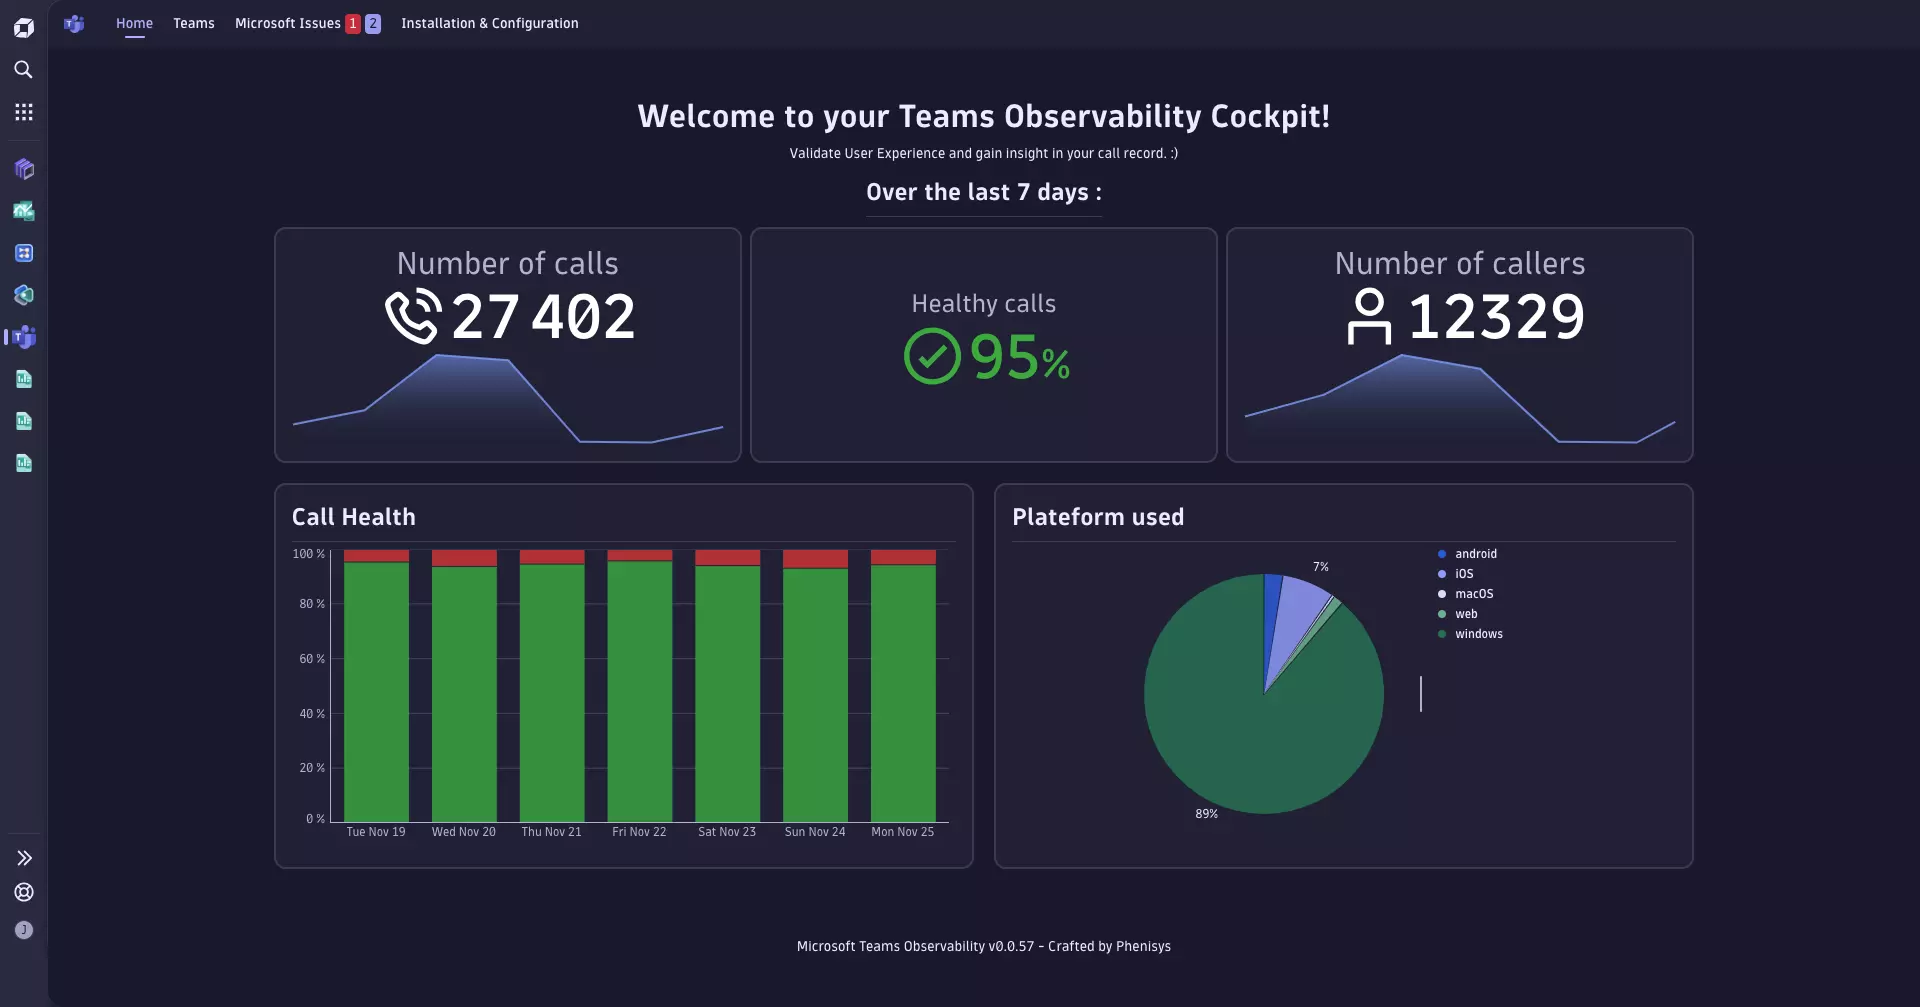
- Home page
Surface call-quality trends across your organization to proactively address issues before they escalate to ensure low downtime and improved user satisfaction. - Site overview page
Pinpoint performance hotspots and recurring issues globally across your locations to streamline troubleshooting and prioritize your investments in infrastructure. - Call diagnostics page
Isolate problematic calls and empower support teams to resolve issues without escalation to cut MTTR and support costs. - Call record overview page
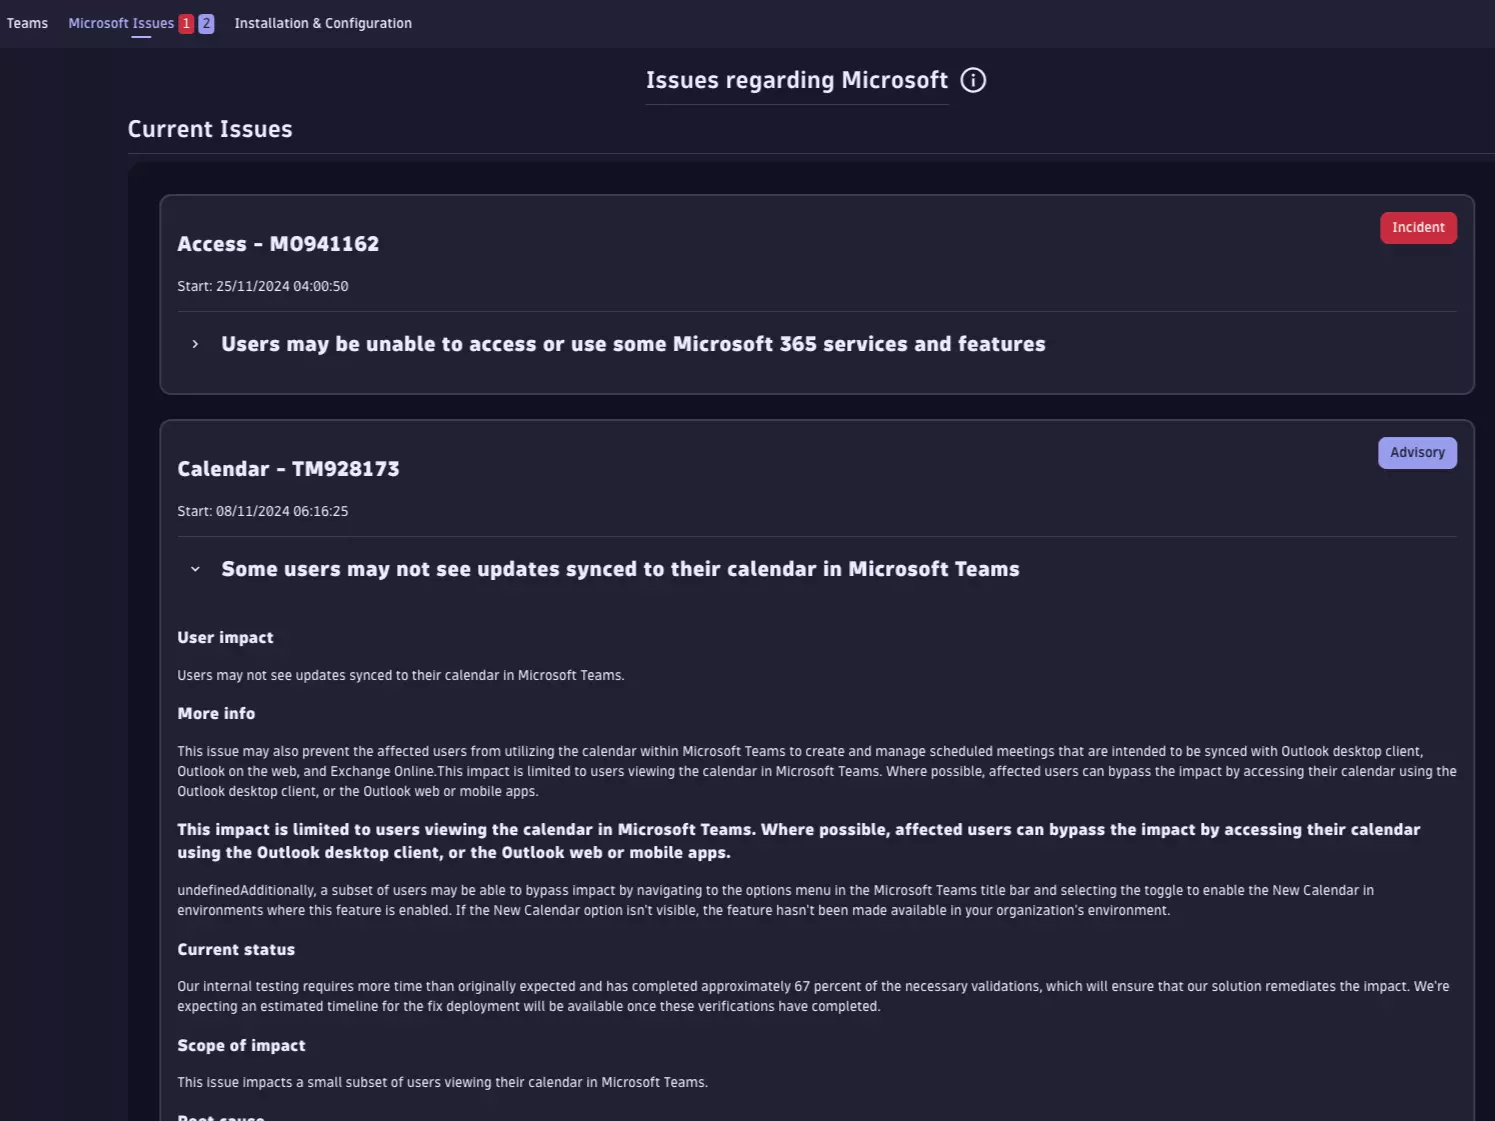
Gain full visibility into user impact and root cause in minutes, allowing faster MTTR and better communication with affected teams. - Microsoft issues page
Stay ahead of service disruptions with real-time visibility into Microsoft-reported issues, tailored to your tenant, allowing you to inform users and adjust operations proactively. - Configuration page
Adjust app settings to your organization’s compliance needs and operational workflows to ensure relevance and maximum value.
Use cases
Suppose you’re on an important Teams call when you’re suddenly dropped from the call. While trying to get back in, you check with a coworker who was also on the call; they report audio issues, and someone else spams the call chat with a message stating that the screen share is frozen. As a result of this unexpectedly heavily bugged Teams call, the meeting had to be postponed, and tickets are piling up with the helpdesk.
With standard Microsoft Admin tools, the helpdesk agent can review aggregated metrics, which don’t report anything abnormal. According to the agent’s metrics, the call should have been fine, so they escalated it to the network team. Without any qualified leads, the network team has to go blind and look for possible causes. It takes two hours for someone to discover that the local WiFi router was overloaded and caused these issues. The fix is simple, but users are frustrated, and time was wasted.
With the Microsoft Teams Observability app, the same ticket can be resolved in three simple steps:
- The helpdesk agent brings up the call either by username or call ID to check available metadata and quality indicators, such as “health.”
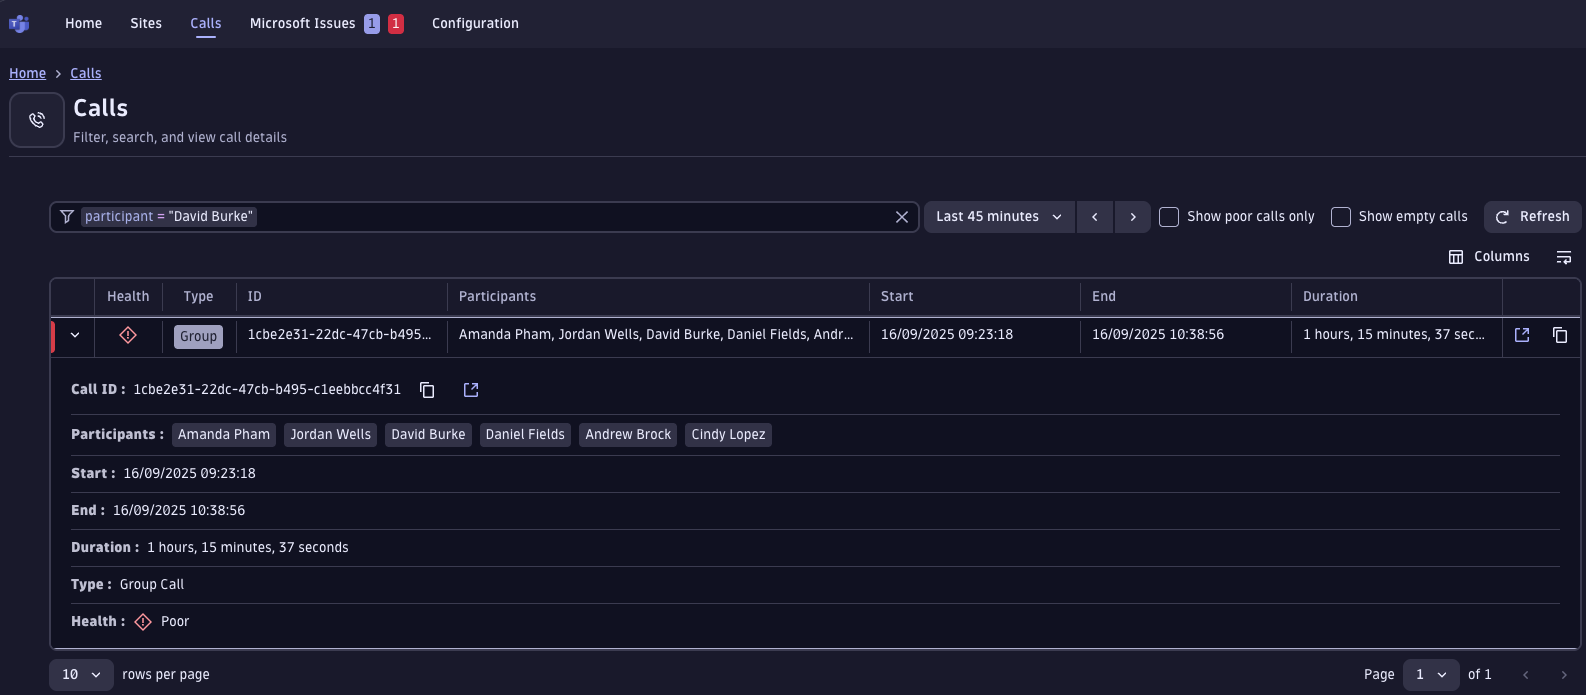
Figure 3. Easily identify the troubling call by participant names or call ID. - The agent then opens the details page to get the call timeline, including information about the performance of audio, video, and screen-sharing streams. We see a clear video degradation within the first ten minutes of the call. Thanks to the waterfall view, the agent already knows how and when the issue occurred for the user.
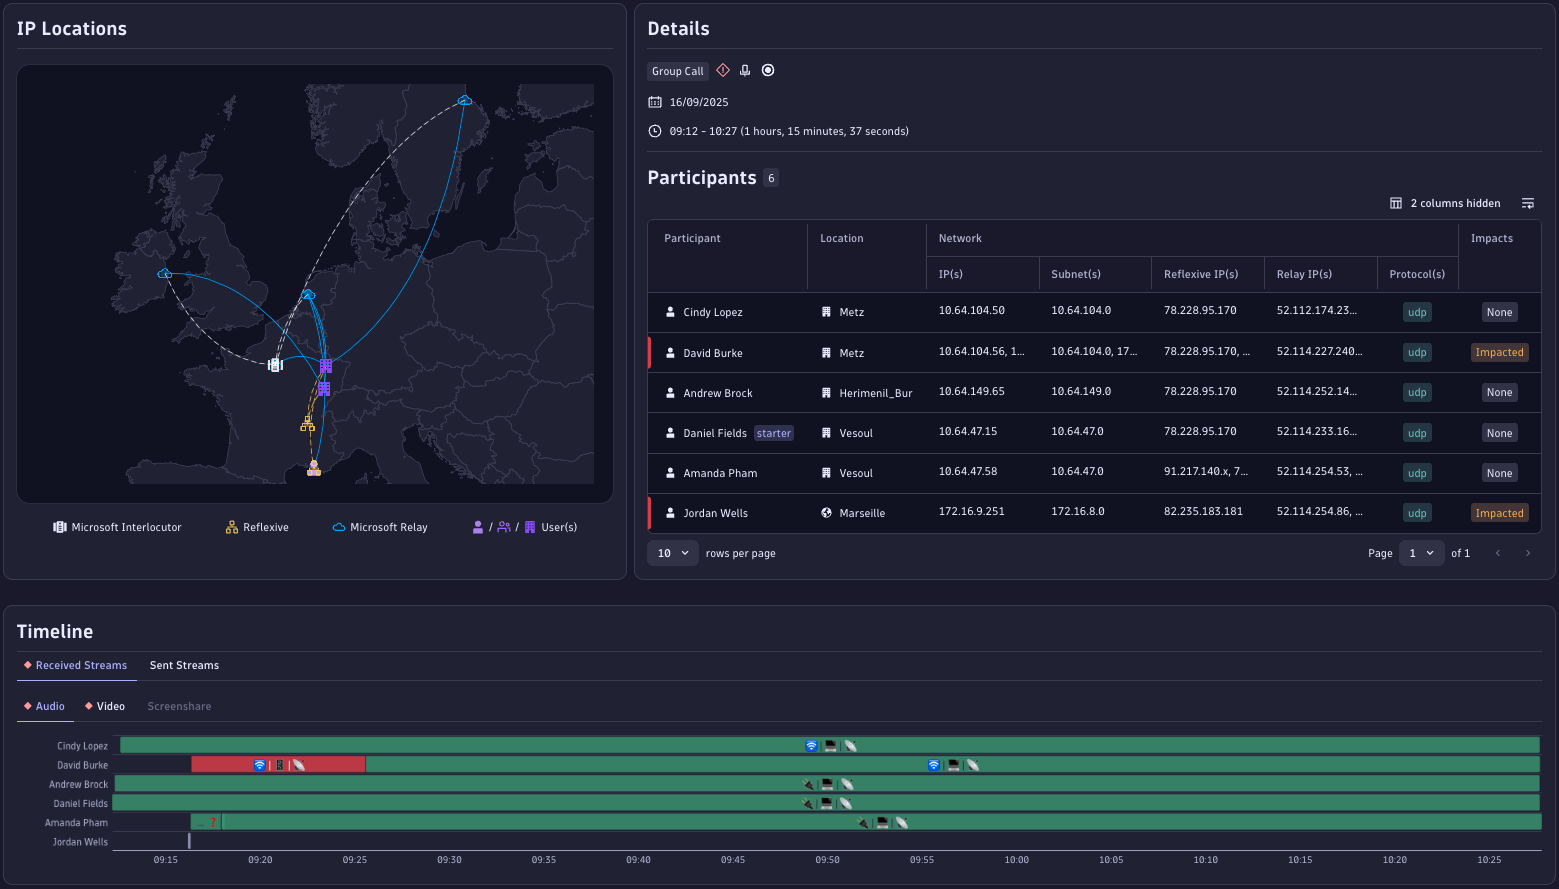
Figure 4. The waterfall view clearly shows an audio degradation early in the call. - The agent then drills into the details. All impacted users are in the same office, so network metrics are the first point of investigation. The app highlights an abnormally high latency for that office, which is not aligned with best practices recommended by Microsoft. Within a few minutes, the agent can identify a faulty WiFi access point as a root cause, providing a clear resolution path without the need for escalation.
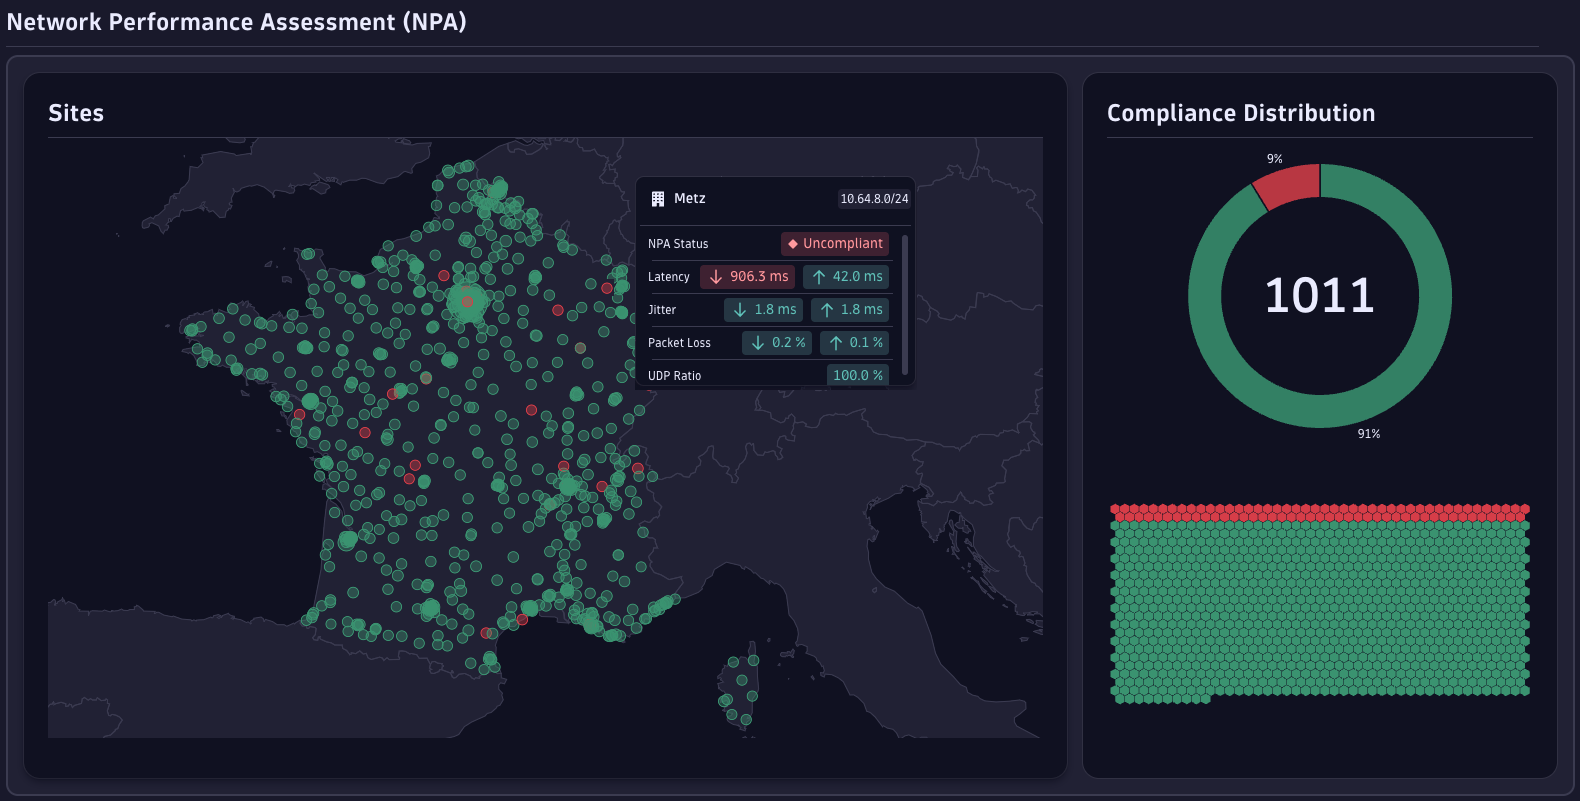
Figure 5. A drastic drop in latency is displayed front and center for the affected location on the Network Performance Assessment page.
In the end, finding the root cause of the call degradation took only three clicks and mere minutes instead of hours on a wild goose chase, and instead of escalating the issue to the network team, the helpdesk agent was able to solve this on their own.
With the Microsoft Teams Observability app, workflows for operations and helpdesk teams are transformed: no more blind troubleshooting with direct and actionable insights into metrics and root cause. Tickets are no longer a black box.
Best practices
On top of all the features available, you can get even more value out of the app by utilizing a few key features and tweaking the setup to your needs.
- Utilize pre-built dashboards! To ease users into the app experience, Phenisys provides two dashboards, tracking MS Teams versions used across devices, as well as locations and users utilizing TCP streams (since Microsoft recommends using UDP ports instead of TCP). This helps users track performance over time.
- Correlate data from different call center components! With the app’s capabilities, you can view audio attendance, call queues, PSTN, and even direct routing directly within the app.
- Adjust retention periods to your needs! The app allows you certain flexibility in data retention, which can optimize data storage and support you in your efforts to align with data privacy and compliance requirements.
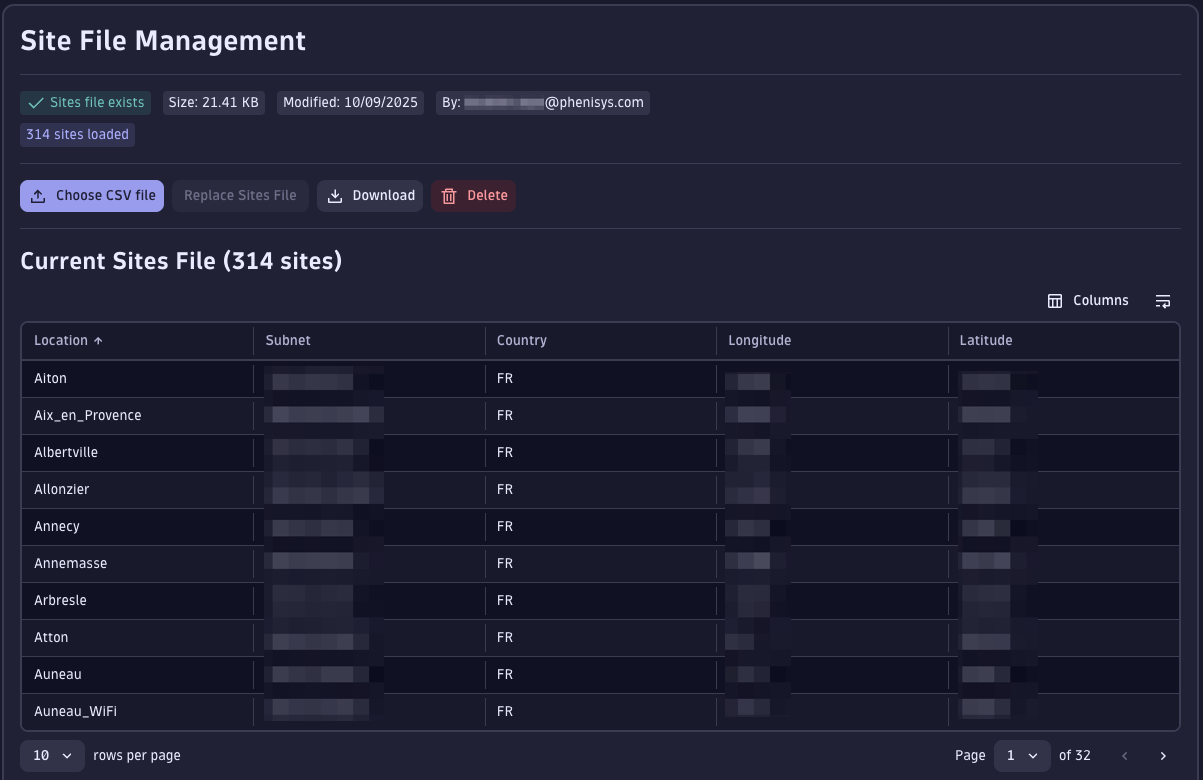
- Enrich data with context! Utilize lookup files to enrich your existing data with client context, ensuring more accurate and actionable insights.
Further reading
Get the app from the Hub:
Get in touch with Phenisys:
Other apps built by Phenisys:
Other partner blog posts:
Public videos:
- Promotional video Phenisys: Microsoft Teams Observability by Phenisys
- Dynatrace Observability Lab: Optimize Your Microsoft Teams Experience with Real-Time Insights


Looking for answers?
Start a new discussion or ask for help in our Q&A forum.
Go to forum