
When incidents occur, engineers and incident managers often lack the production visibility they need to fully understand the underlying issues and act quickly. Most tickets fail to include details about severity, impact, or next steps. This forces teams to waste time jumping between tools and manually stitching data together, delaying recovery and driving up costs.
The new Dynatrace integration with Atlassian solves this by embedding real-time production insights directly into incident management processes. Teams gain instant visibility into what’s happening, who’s impacted, and the actions required to resolve issues faster — all without the need to switch tools.
Dynatrace uniquely detects problems in real time by understanding topology, data context, and dependencies across your entire digital ecosystem. Incidents are automatically tied to underlying root causes, giving teams a complete, production-accurate, “live” picture of problem details, severity, and impact.
Dynatrace insights are now accessible in Jira Service Management through human-readable summaries generated by Atlassian Rovo. By bringing production context directly into Jira, Confluence, and Jira Service Management, you’ll accelerate response times and significantly reduce mean time to resolution (MTTR).
At Dynatrace, context is our mantra, sitting at the core of everything we do. This means more than just data enrichment: Every piece of data is automatically contextualized, and dependencies are mapped to reveal the full picture. However, context also means delivering the right data exactly when and where you need it. To do just that, Dynatrace is bringing these insights directly into Atlassian. This is not just limited to IT service management (ITSM). You can get access to contextualized insights directly within an IDE as described in our latest blog post about the new Dynatrace MCP Server.
Diagnose faster with context from production at your fingertips
Most incident tickets land on an engineer’s desk with little more than a timestamp, a vague description, or a user complaint. They rarely reveal the severity of the issue, which systems are affected, or what might be causing it. This lack of context in an ITSM workflow forces teams to spend unnecessary time digging through monitoring dashboards, chasing logs, or switching between tools just to piece together the basics of the problem.
Instead of getting frustrated, you can now instantly ask the Rovo Ops agent to identify anomalies that occurred around the incident timeframe. The agent queries Dynatrace via our MCP Server and returns the findings directly in the same browser window.
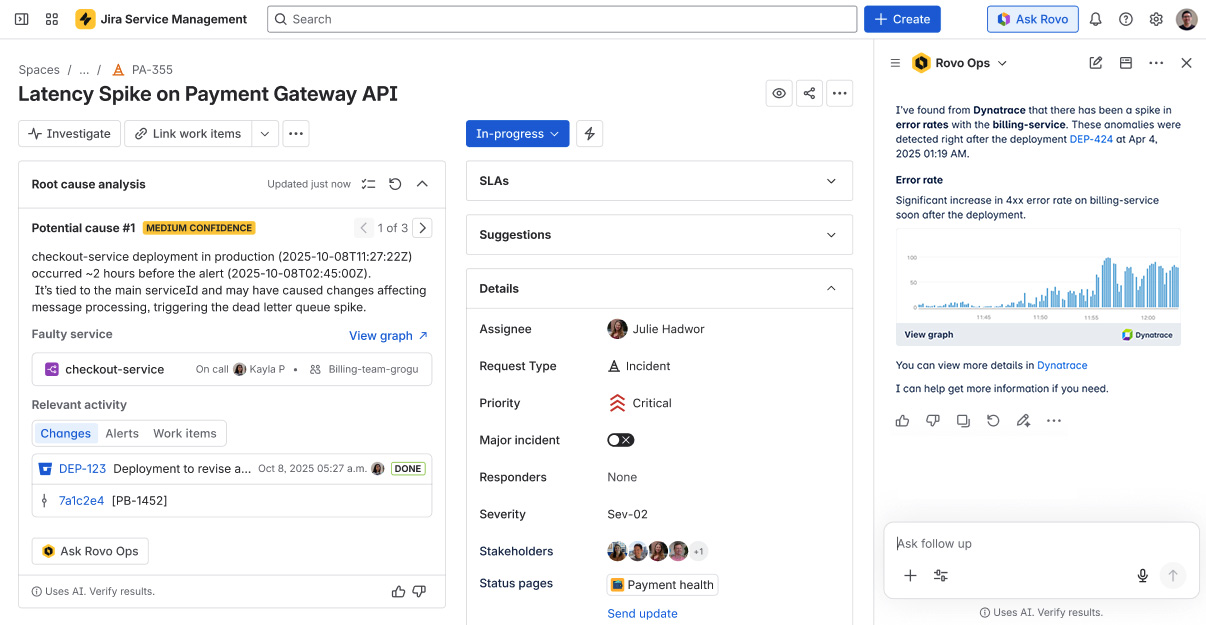
Having contextual details and alerts available directly in the ticket context means you gain immediate clarity into health, what’s wrong, the impact, and the evidence. This leads to faster diagnosis and quicker recovery, while also reducing unnecessary escalations of already-known or related issues, ensuring internal resources aren’t tied up with redundant work.
Remediate smarter with AI-driven root-cause analysis and automation
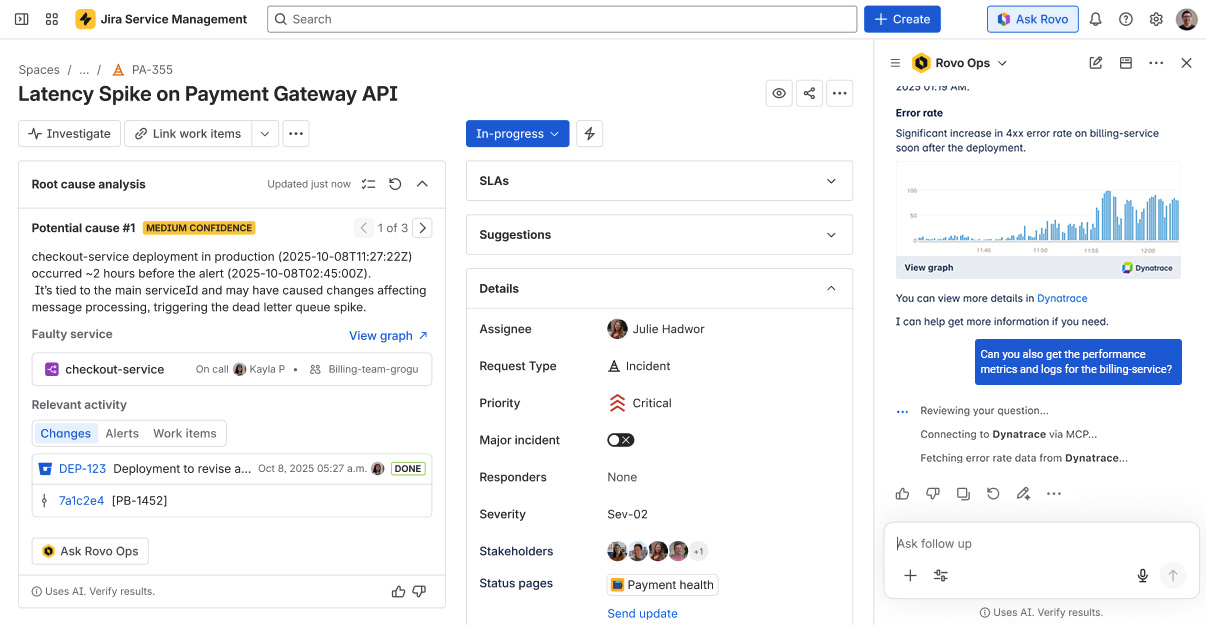
Once an incident is identified, the Rovo Ops agent utilizes Dynatrace production insights, which accelerate triage and root-cause analysis for incident managers, pinpointing the actual root cause in real time and delivering a higher level of insight and accuracy.
Rovo can now pull in Dynatrace Causal AI insights, including the precise root cause and blast radius of the issue, and combines these with Jira Service Management incident and change history. With Dynatrace contextual intelligence, Rovo delivers fact-based, AI-generated problem summaries and clear remediation recommendations, outperforming the guesswork of pure GenAI approaches.
From this point, just follow the remediation recommendation and trigger a suggested automation action in Jira Service Management, or ask follow-up questions for clarification.
Learn for the future with automated post-incident reviews
The job isn’t finished after an incident is mitigated and marked resolved in Jira Service Management, as you still need to capture what happened and determine how to prevent its recurrence. Instead of spending hours on manual write-ups, Rovo automatically triggers the post-incident review (PIR) process.
In the auto-generated PIR, Rovo surfaces all of the relevant details and history, from the root cause to detected anomalies, all of which are enriched by Dynatrace AI-driven insights. This provides a complete, time-ordered view of the incident, which is combined with Jira Service Management context attributes like assignees, tags, outage duration, and related change logs. With this context, the agent generates a draft PIR. Inside the PIR, you’ll find monitoring charts showing the status before, during, and after the incident, a clear summary of the cause, and a pre-filled prevention plan. All that’s left for you to do is review, refine, and finalize the PIR.
The automatically documented PIRs act as built-in retrospectives, helping teams continuously mature their operations. They also feed insights back into Rovo to sharpen its future recommendations.
Transform how you work, beyond incident management
These are just a few examples of what’s now possible through the extended Dynatrace + Atlassian integration. We’ll continue to explore deeper integrations to make your troubleshooting journey even more efficient in the future.
Imagine directly following up on investigations from within Rovo, with seamless drill-downs into Dynatrace® Apps, or surfacing related post-mortem information and runbooks stored in Jira or Confluence to SREs when investigating an issue in Dynatrace.
And the potential impact goes well beyond incident management. By bringing reliable, real-time production truth into daily workflow and connecting that truth directly to business outcomes, more teams and roles can fundamentally transform the way they work, harnessing the full power of agentic AI.
- Get instant release validation: Developers can query Rovo for pre- and post-deployment failure rates, SLOs, and outcome metrics, allowing them to release with confidence, roll back faster when needed, and validate hypotheses with real data.
- Make decisions based on outcomes: Product managers can ask Rovo or Davis CoPilot® to analyze the impact of a new feature or release by investigating KPI shifts such as user engagement or a drop in check-outs.
- Speed up triage based on business impact: Support engineers working on Jira tickets see Dynatrace insights related to the root cause, blast radius, affected applications, and services. These insights are enriched with further details on user and business impact, allowing engineers to perform instant impact analysis before assigning tickets.
- Run smarter daily stand-ups: Development teams receive ready-made summaries, including exceptions, user analysis, and deployment reports from the last 24 hours, providing relevant insights into what’s actually happening in production.
Start benefiting from deeper integrations with Dynatrace as your trusted foundation for agentic AI
Dynatrace delivers a deep, causation-based understanding of your live digital systems, providing the precise, reliable insights that enterprises can trust as a foundation for agentic AI.
Ready to see how Dynatrace and Atlassian work together and benefit from adopting agentic AI concepts? Then dig deeper into the new possibilities using our remote MCP Server and experience how real-time production context makes your operations more efficient.
See our documentation to learn more about how to connect the Dynatrace MCP Server.

Looking for answers?
Start a new discussion or ask for help in our Q&A forum.
Go to forum