Today’s digital marketplace is data-driven—nearly all business decisions are now based on insights gleaned from end-user data. Every action performed by your customers while using your application can provide insight into how well your application is performing and meeting your customers’ needs. Dynatrace analyzes all user session data and reveals its insights for you automatically, thereby enabling you to provide optimal user experience to your customers and promote the success of your digital business.
To help you gain easy access to your application’s end-user data, Dynatrace proudly announces the release of user session queries, a powerful feature that enables you to dive deep into your customers’ user session data.
Put your data to use by running powerful queries
User session queries can be used to create charts that visualize insights that you can leverage to improve the experience of your applications, and, thereby, the value of your business.
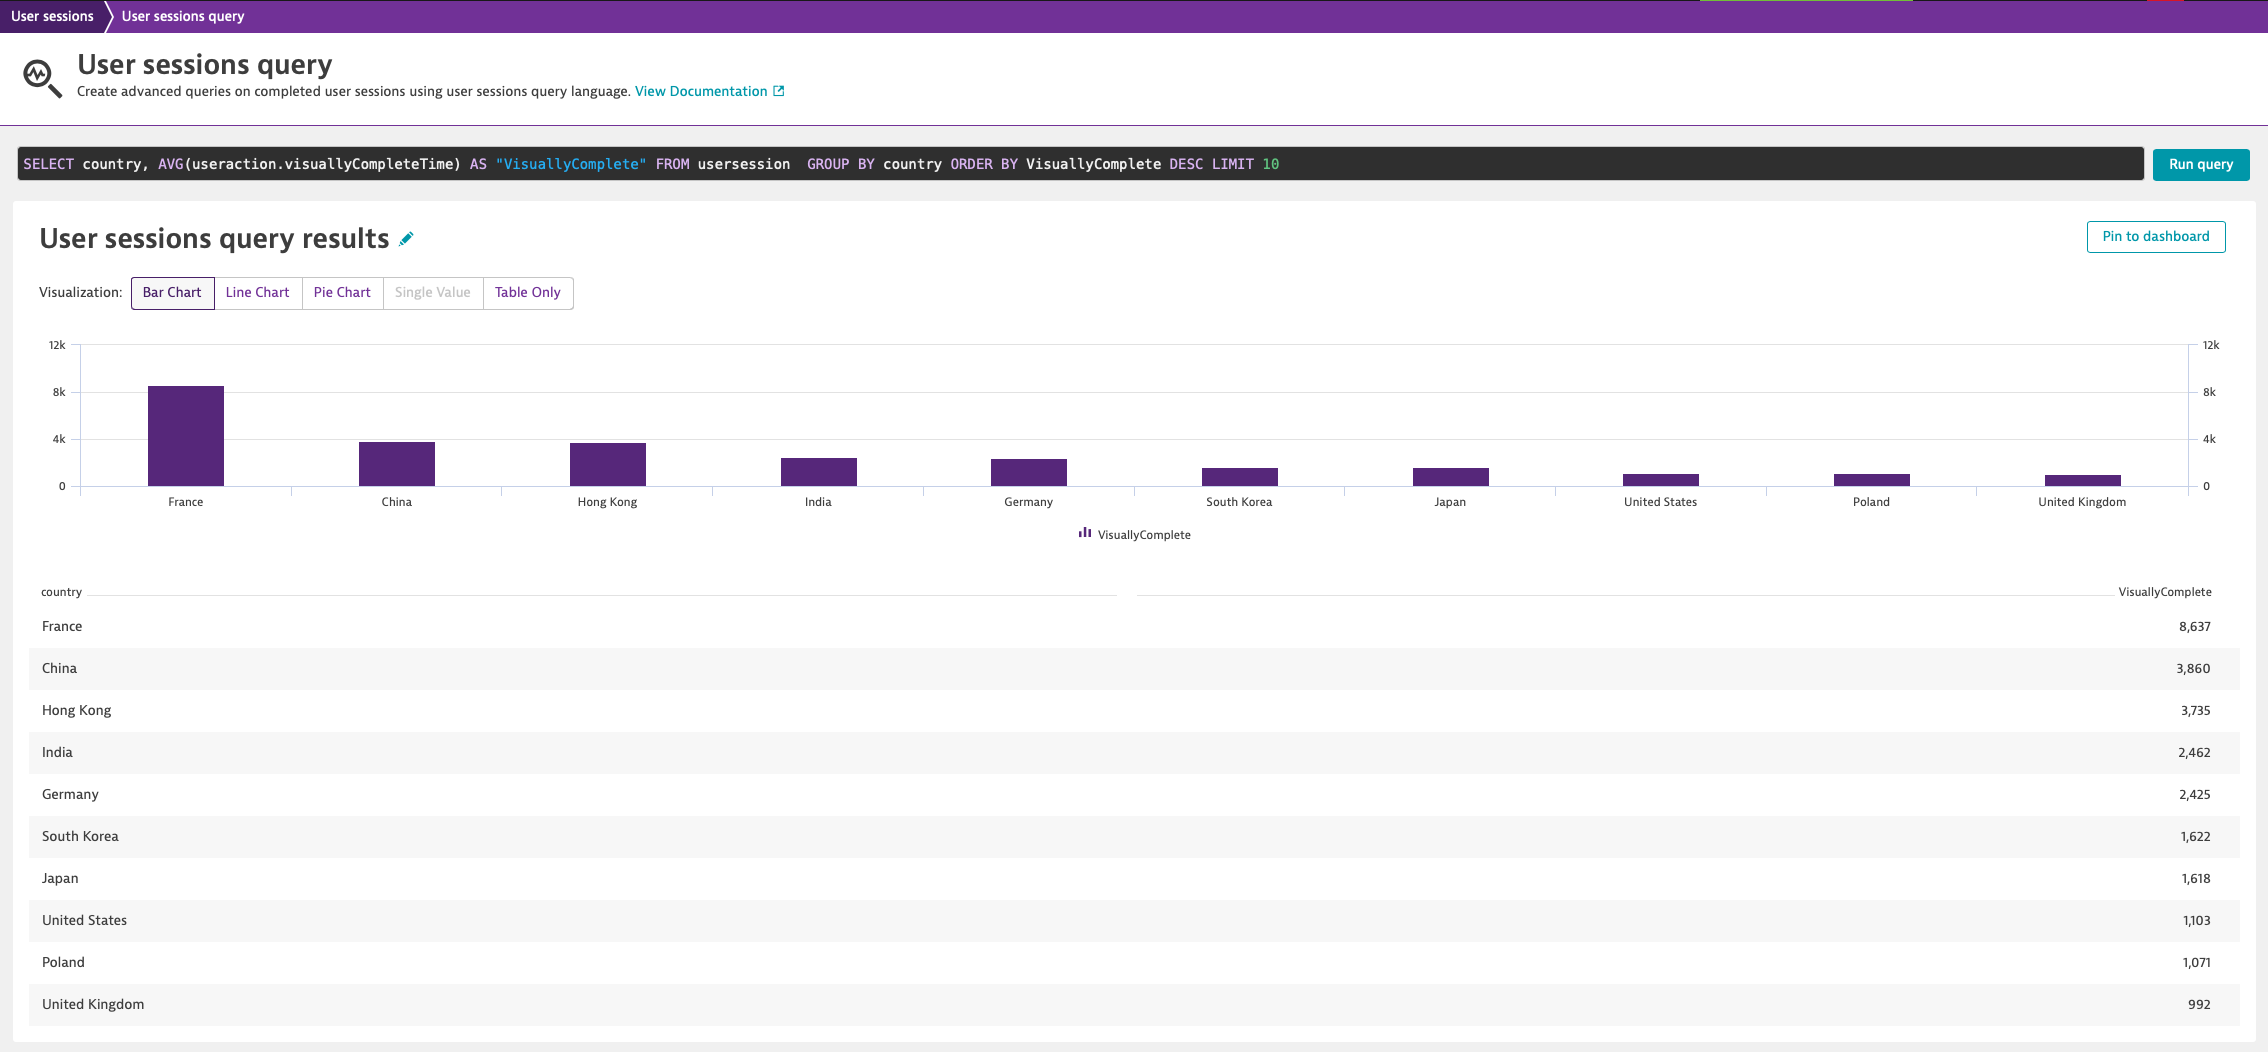
By using Dynatrace User Session Query Language, an easy-to-learn SQL-like query language, you can find the exact user session data that you need to better understand the performance of your application. Fetching the correct data is made easier with auto-completion and suggestions based on query syntax. You can segment, aggregate, or simply list the sessions and actions that match your search criteria.
User session queries can even be used in use cases where advanced filtering options, such as multiple filters or persistent filtering across analysis views, are required.
And when you want to keep track of the monetary values and conversion goals that are key to the success of your business, you can construct queries based on the unique values of the individual user session properties that have been defined for your environment.
Visualize data with custom charts and graphs
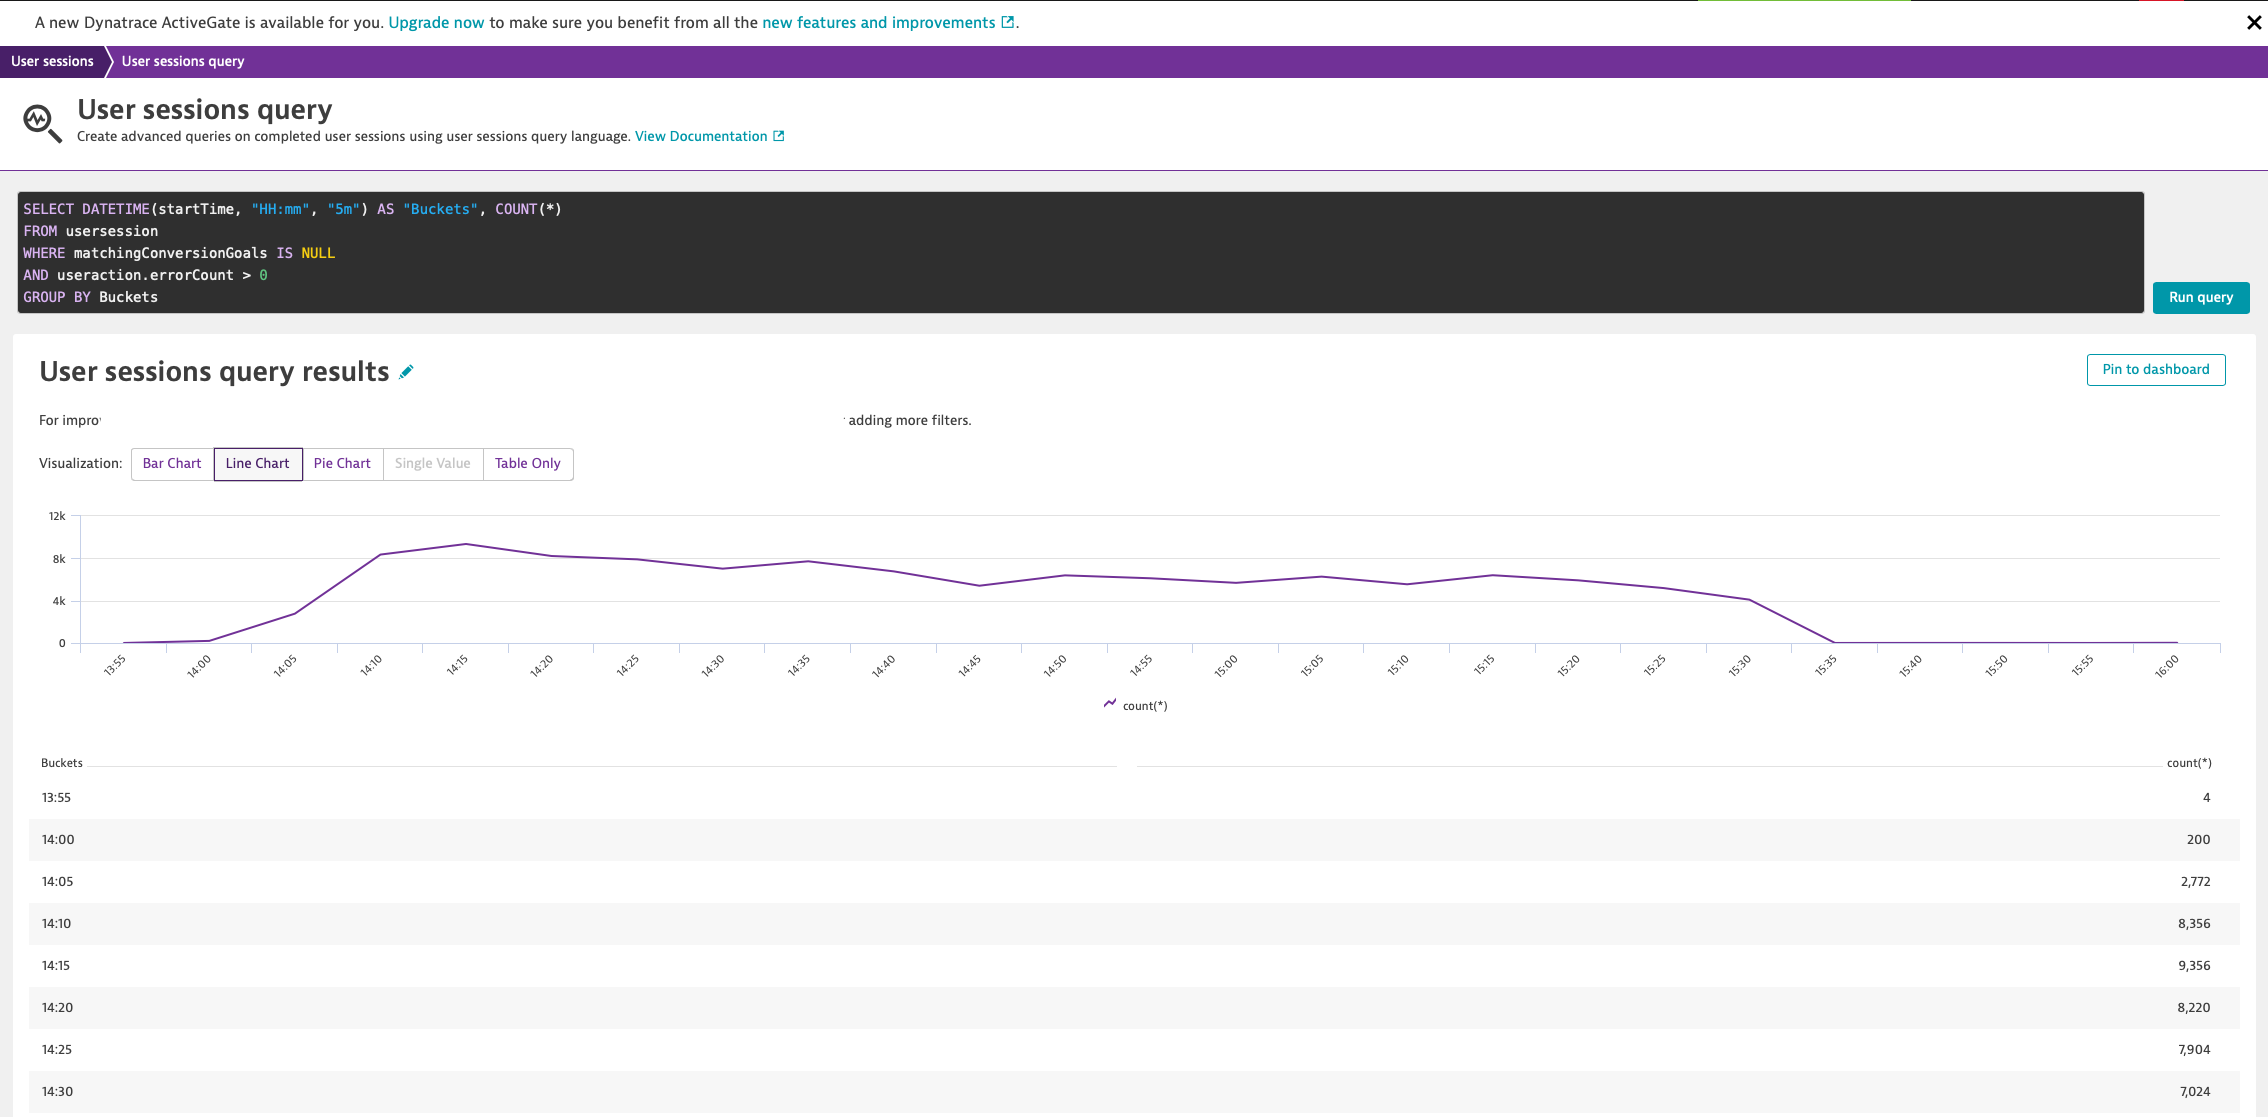
So that you can leverage the power of user-session data at the highest possible level, user session queries provide you with the ability to not only find the data you need but also to visualize the data in the form that best meets your needs. You can choose to view user session data in a variety of graph and charts types. You can even view your data in its raw form.
Here are a few visualization options:
- Important metrics such as the sum or average of sales and the number of new or returning users can best be viewed as a single-value chart.
- To explain the evolution of an event, such as the change in error count over time, consider using a line chart.
- To view the geographical distribution of errors by country (and see which are the highest contributing countries), use a pie chart.
- Bar charts are ideal for viewing the top 10 countries that have the most user sessions. This helps you better understand where your users are located.
Data at your fingertips
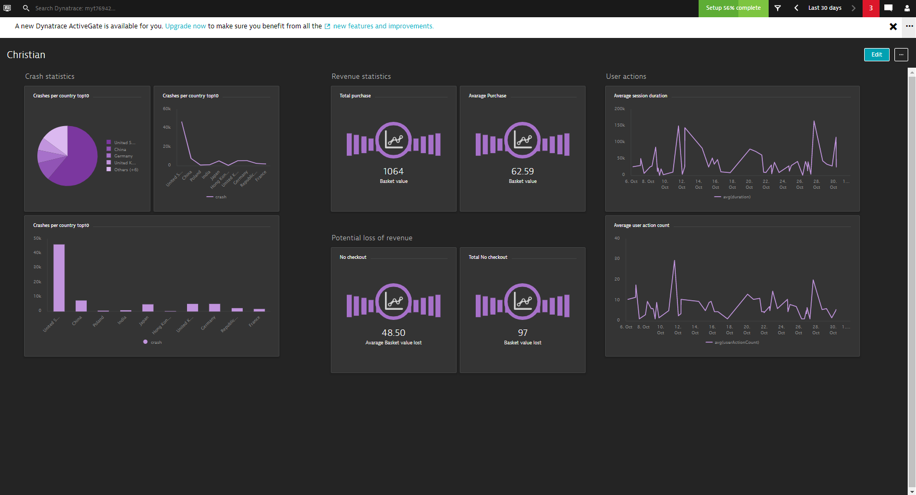
Any chart or visualization you generate based on a user session query can be pinned to a dashboard in the form of a dedicated tile. This means that, with just a glance at your Dynatrace dashboard, you can quickly see the data that’s most important to the success of your business. You can pin charts to any dashboard alongside other tiles to arrive at the layout that best serves your business requirements (see example below).
Interested?
Awesome! The Early Access Program (EAP) for User session queries begins in March 2019. The EAP is open to all current and prospective Dynatrace customers. If you wish to participate, please register yourself.



Looking for answers?
Start a new discussion or ask for help in our Q&A forum.
Go to forum