
Dynatrace Blog
Modern cloud done right. Innovate faster and compete more effectively in the digital age.


Dynatrace loves OpenTelemetry
Dynatrace Cloud Security Posture Management elevates cloud security with real-time compliance across hyperscalers

Catching up with OpenTelemetry in 2025

Dynatrace Hub: Extend the power of Dynatrace

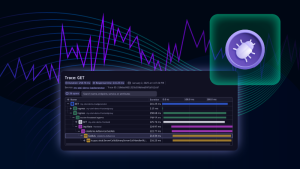
The anatomy of broken Apache Struts 2: A technical deep dive into CVE-2024-53677

Business process observability: An IT solution to a business challenge
Ingest and enrich AWS Security Hub findings with Dynatrace

Dynatrace Managed release notes version 1.308

Observability as Code: DIY with Crossplane

Celebrating innovation: Top Custom Solutions from the 2024 Dynatrace Partner App Competition

Dynatrace loves OpenTelemetry
Extension management made simple with the new Dynatrace Extensions
Better together: Why OpenTelemetry and Dynatrace make a winning combination

OneAgent release notes version 1.307

What’s new in Dynatrace SaaS version 1.308

Power Dashboarding, Part I: Start your exploration journey with Dashboards
Debug complex performance issues in production with ease

Dare to debug production with Dynatrace Live Debugger
Dynatrace Observability for Developers saves time with real-time data

Powerful exploratory analytics for AI-driven insights

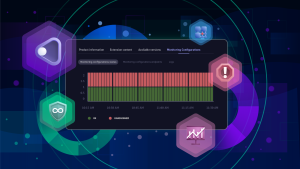
Get the most from Network Availability Monitoring on Dynatrace Managed

Dynatrace Cloud Security Posture Management elevates cloud security with real-time compliance across hyperscalers

Davis CoPilot expands: Get answers and insights across the Dynatrace platform

Discover the new Dynatrace Runtime Vulnerability Analytics experience

Advancing AIOps: Preventive operations powered by Davis AI