
The new Data explorer makes it easy to calculate metrics that deliver more relevant and actionable dashboard insights for IT and business teams.
Metrics matter. As objective measurements, they allow us to make data-driven decisions. But without complex analytics to make sense of them in context, metrics are often too raw to be useful on their own. To achieve relevant insights, raw metrics typically need to be processed through filtering, aggregation, or arithmetic operations. This is especially true when the goal is to present information to non-technical users, but all technical teams can benefit from aligning raw metrics with higher-level KPIs and SLOs. Think of the KPIs that measure your team’s performance, your SRE SLOs, or how Google Search rankings are influenced by Core Web Vitals; these measurements are derived from multiple raw metrics, processed into actionable insights.
Often referred to as calculated metrics (see Adobe Analytics and Google Analytics), such metric processing takes one or more existing metrics as input to create a new user-defined metric. For example, you might transform the count-based metric “form submissions” into a rate to report form submissions per hour. You can also calculate form rejection rate by dividing form rejections by form submissions. Metric calculations help you design custom dashboards that meet the requirements of specific teams.
Examples of metric calculations
Let’s look at a simple business use case. To reduce the customer churn rate, an insurance company’s marketing team wants to increase enrollment in their autopay program. They’ve set an enrollment goal of 75% for new policies. The metric autopay.selected counts autopay enrollments, and the metric policies.bound counts new policies—yet, on their own, these metrics are neither glanceable nor actionable without some additional processing. To solve this, the marketing team calculates autopay enrollment—(autopay.selected)/(policies.bound)—to create a dashboard tile directly aligned with their business goal.
Metric calculations also provide alerting and automation value. Consider the example 75% enrollment-in-autopay goal as an SLO. What if the business owner wishes to receive an alert when the rate falls below 70%, or when the rate deviates from a learned baseline? Metric calculations make it easy to define such relevant and actionable alerts.
Here are other examples to spur your imagination:
- Convert currencies. You can convert foreign currencies, either by assigning fixed conversion rates or by importing conversion rate metrics.
- Assign goal values. You can assign a dollar value to any conversion goal—registrations, downloads, quote requests, etc.—and report the results of an ad campaign. If you import campaign cost metrics, you could also report the campaign’s ROI.
- Combine metrics. You may track revenue metrics from multiple payment providers or offer different conversion options; you can combine these into a single revenue or conversion metric.
The Data explorer
Dynatrace provides numerous built-in metrics, many of which are already calculated—such as Conversion rate. You can now calculate your own metrics for display using metric selector transformations and metric expressions. Applying an API-first approach, Dynatrace recently made these transformations and expressions available through the Metrics API v2, extending your reach into distant corners of your IT ecosystem.
With the update to Dynatrace version 1.222, you can now use the new Data explorer interface to interactively build, test, and create your own metric calculations—right on your dashboards. With the Data explorer, you not only get to explore your metrics with minimal effort, you can also dive deeper to customize your query code.
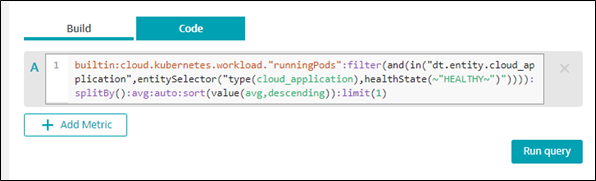
In the Data explorer example below, we transform the Running pods metric by averaging the pod count and filtering by health state. The Build interface simplifies creating new metric calculations by allowing you to select from available metrics, aggregations, dimensions, and filters.
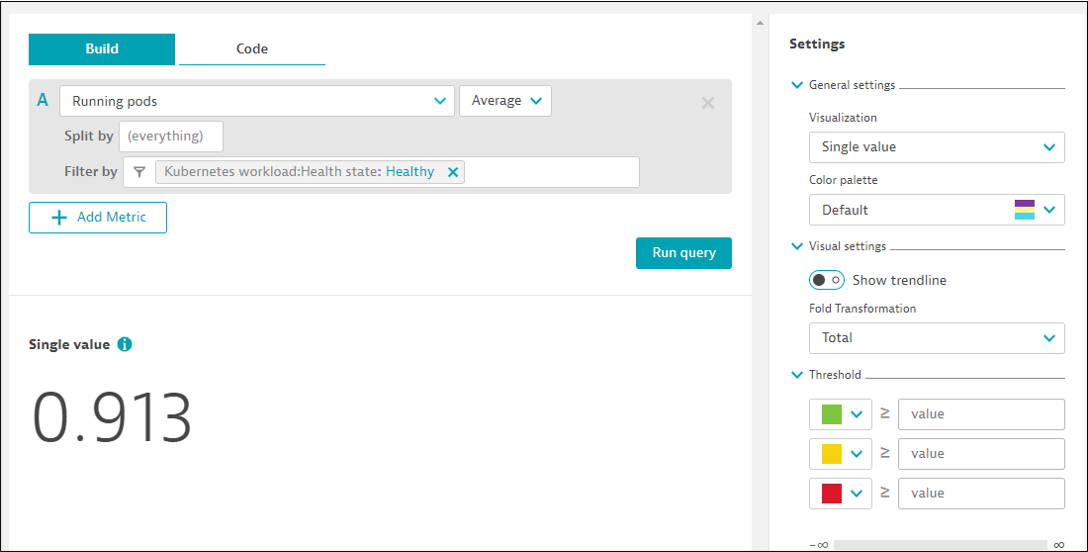
The Code tab displays the resulting query. Here you can modify the Build results to take advantage of the vast range of available transformations and expressions.
Presentation matters
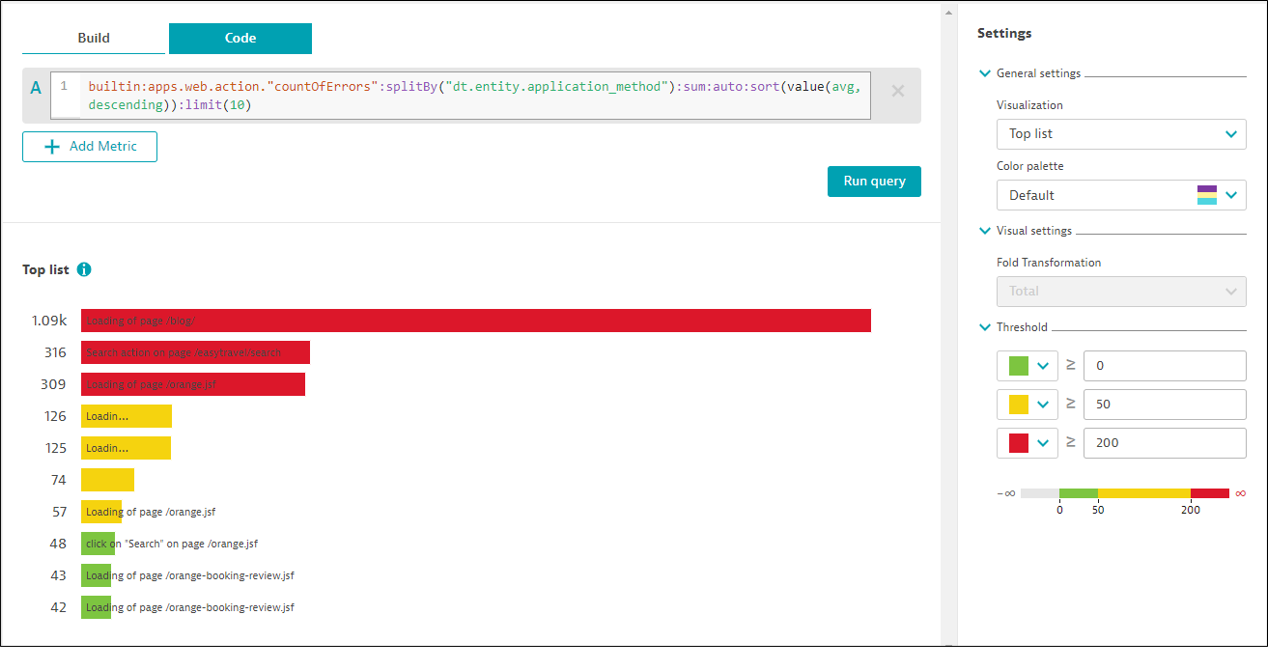
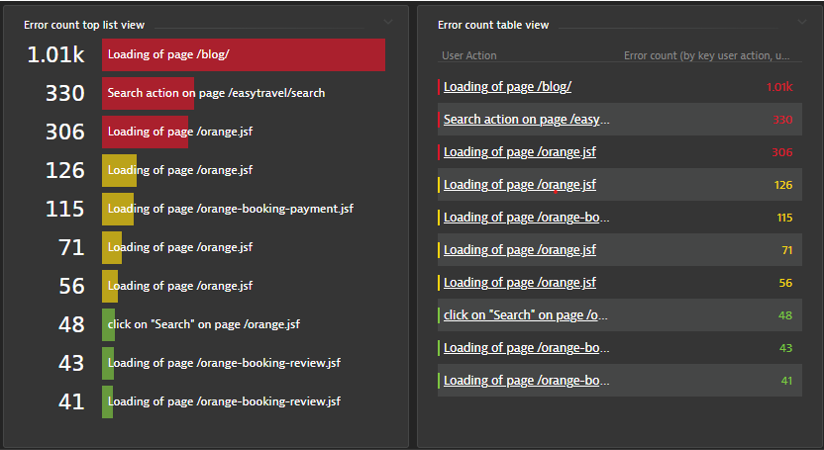
You might want to enhance your metrics for presentation on dashboards with intuitive data visualization and possibly a custom color palette. Custom threshold colors can make charted metrics more glanceable, while table data or lists can speed drilldown analysis. The simple query below lists user actions sorted by error counts. Choosing a Top list visualization displays a glanceable bar graph; choosing a Table visualization displays each user action in the dashboard table tile with links to user-action details.
Making metric calculations easy
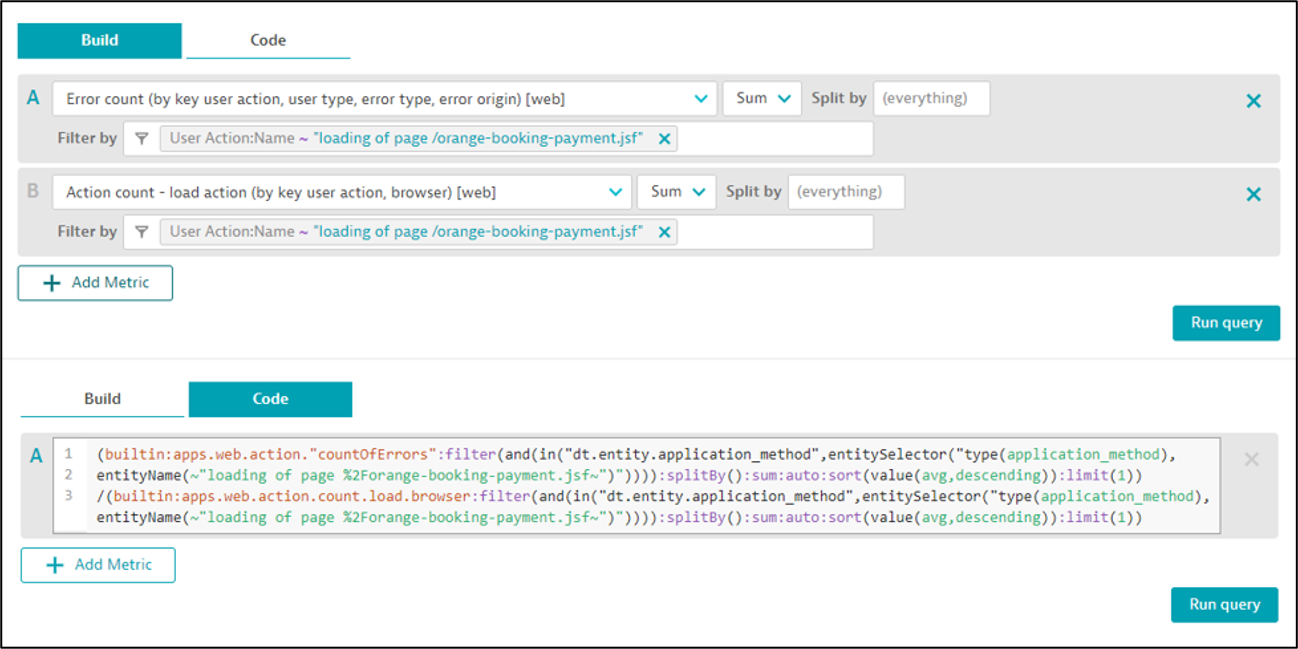
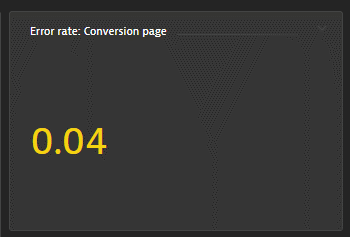
Let’s look at a case where we want to display the error rate for a conversion page. The metrics we have available are Action count and Error count. We know that simple counts fail to tell a complete story, so we’ll calculate a new metric to report the conversion page error rate. The query code below divides the error count by the action count and filters for the page name. We’ve assigned thresholds to color code the resulting dashboard tile. Note that this code was created with almost no typing; the Build tab was used to create the two distinct metric queries, then the Code tab was used to join the queries with a metric expression. (The second screenshot below shows the resulting dashboard tile.)
What’s next?
There are many use cases for metric calculations. Consider some of the ways you’d like to represent the health or status of a business goal or IT state at your organization. You’ll likely arrive at a few discrete metrics that can be transformed into a new metric that is both actionable and glanceable.
In the next blog post of this series, we’ll dive deeper into metric expressions and alerting. In the meantime, give the new Data explorer a try and let us know what you think.
Note: Custom charts will be deprecated in favor of the new Data explorer charts—and we will let you know when you need to take any action. Meanwhile, we encourage you to try the Data explorer, benefit from more powerful visualizations, and let us know if anything is missing before we move over. Converting your deprecated charts to the new functionality is automatic. For more information, see the Data explorer documentation.


Looking for answers?
Start a new discussion or ask for help in our Q&A forum.
Go to forum