
Dynatrace and Postman announced an expansion of their technology alliance to bring real-time observability directly into AI-assisted API workflows with the launch of Postman’s Agent Mode. With the Dynatrace MCP Server now available in Postman’s MCP Catalog, developers can securely connect Agent Mode to trusted Dynatrace telemetry and production context without leaving the Postman environment. By connecting Postman Agent Mode with Dynatrace, developers can move beyond validating API responses to understanding how those APIs behave in real systems, under real load, and across real dependencies. The result is faster insight, fewer blind spots, and greater confidence that APIs perform as expected when it matters most.
What Agent Mode can do with Dynatrace observability data
Once connected with Dynatrace MCP Server, Postman’s Agent Mode works with real runtime data rather than just API requests and responses. When an API test fails or behaves unexpectedly, the agent can correlate the behavior with Dynatrace telemetry such as service metrics, traces, logs, and detected anomalies.
This allows developers to quickly understand whether an issue is caused by the API itself or by what’s happening behind it, such as a slow dependency, a failing backend service, or a recent change impacting runtime behavior. Because this context comes directly from Dynatrace, developers can ask follow‑up questions in natural language and get answers grounded in production data. All of this happens inside the Postman workflow, without switching tools or manually querying observability dashboards.
The result is a faster feedback loop: APIs can be tested, validated, and debugged with awareness of how they actually behave in live environments, not just how they respond in isolation.
Explore Dynatrace use cases with Postman
This integration is most valuable in situations where API behavior needs to be understood in the context of how systems actually run, not just how endpoints respond in isolation.

Common scenarios
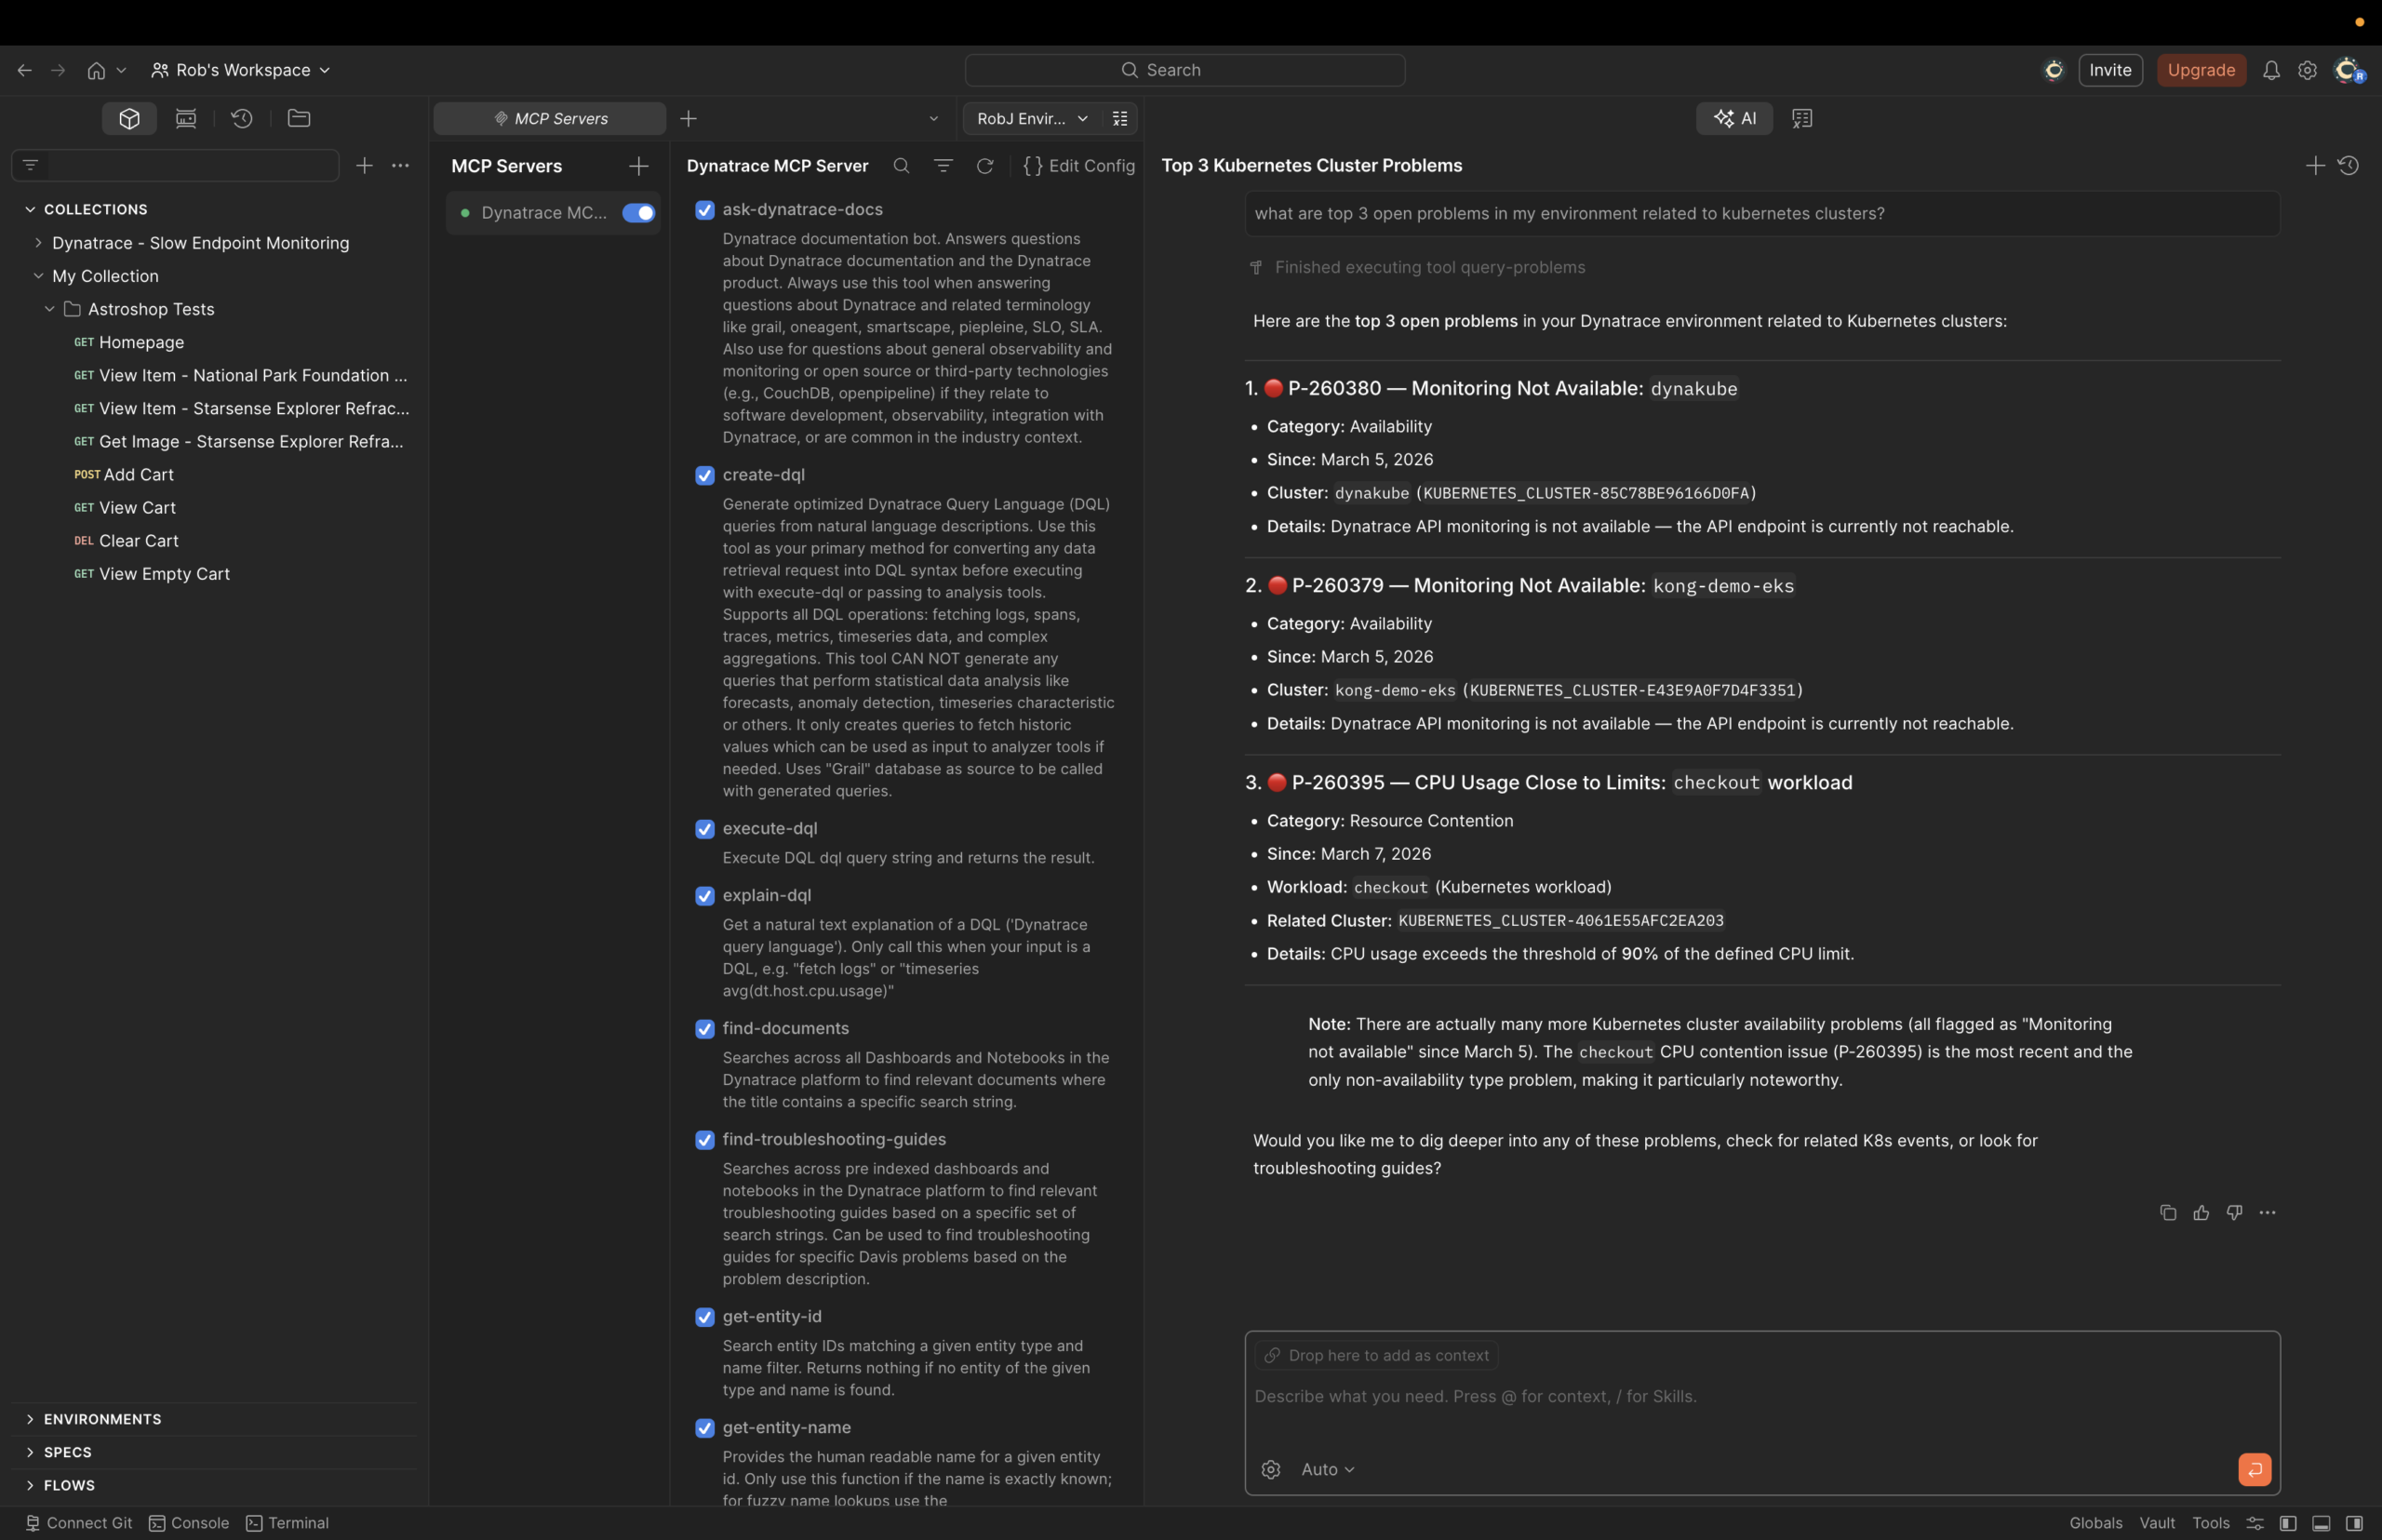
Instantly check Dynatrace environment health in Postman
Quickly connect Dynatrace as an MCP server in Postman, set up environment variables, and use natural language prompts to get a real-time overview of open problems in your monitored environment. This streamlines troubleshooting by surfacing actionable issues directly in Postman, saving you time and reducing context switching.
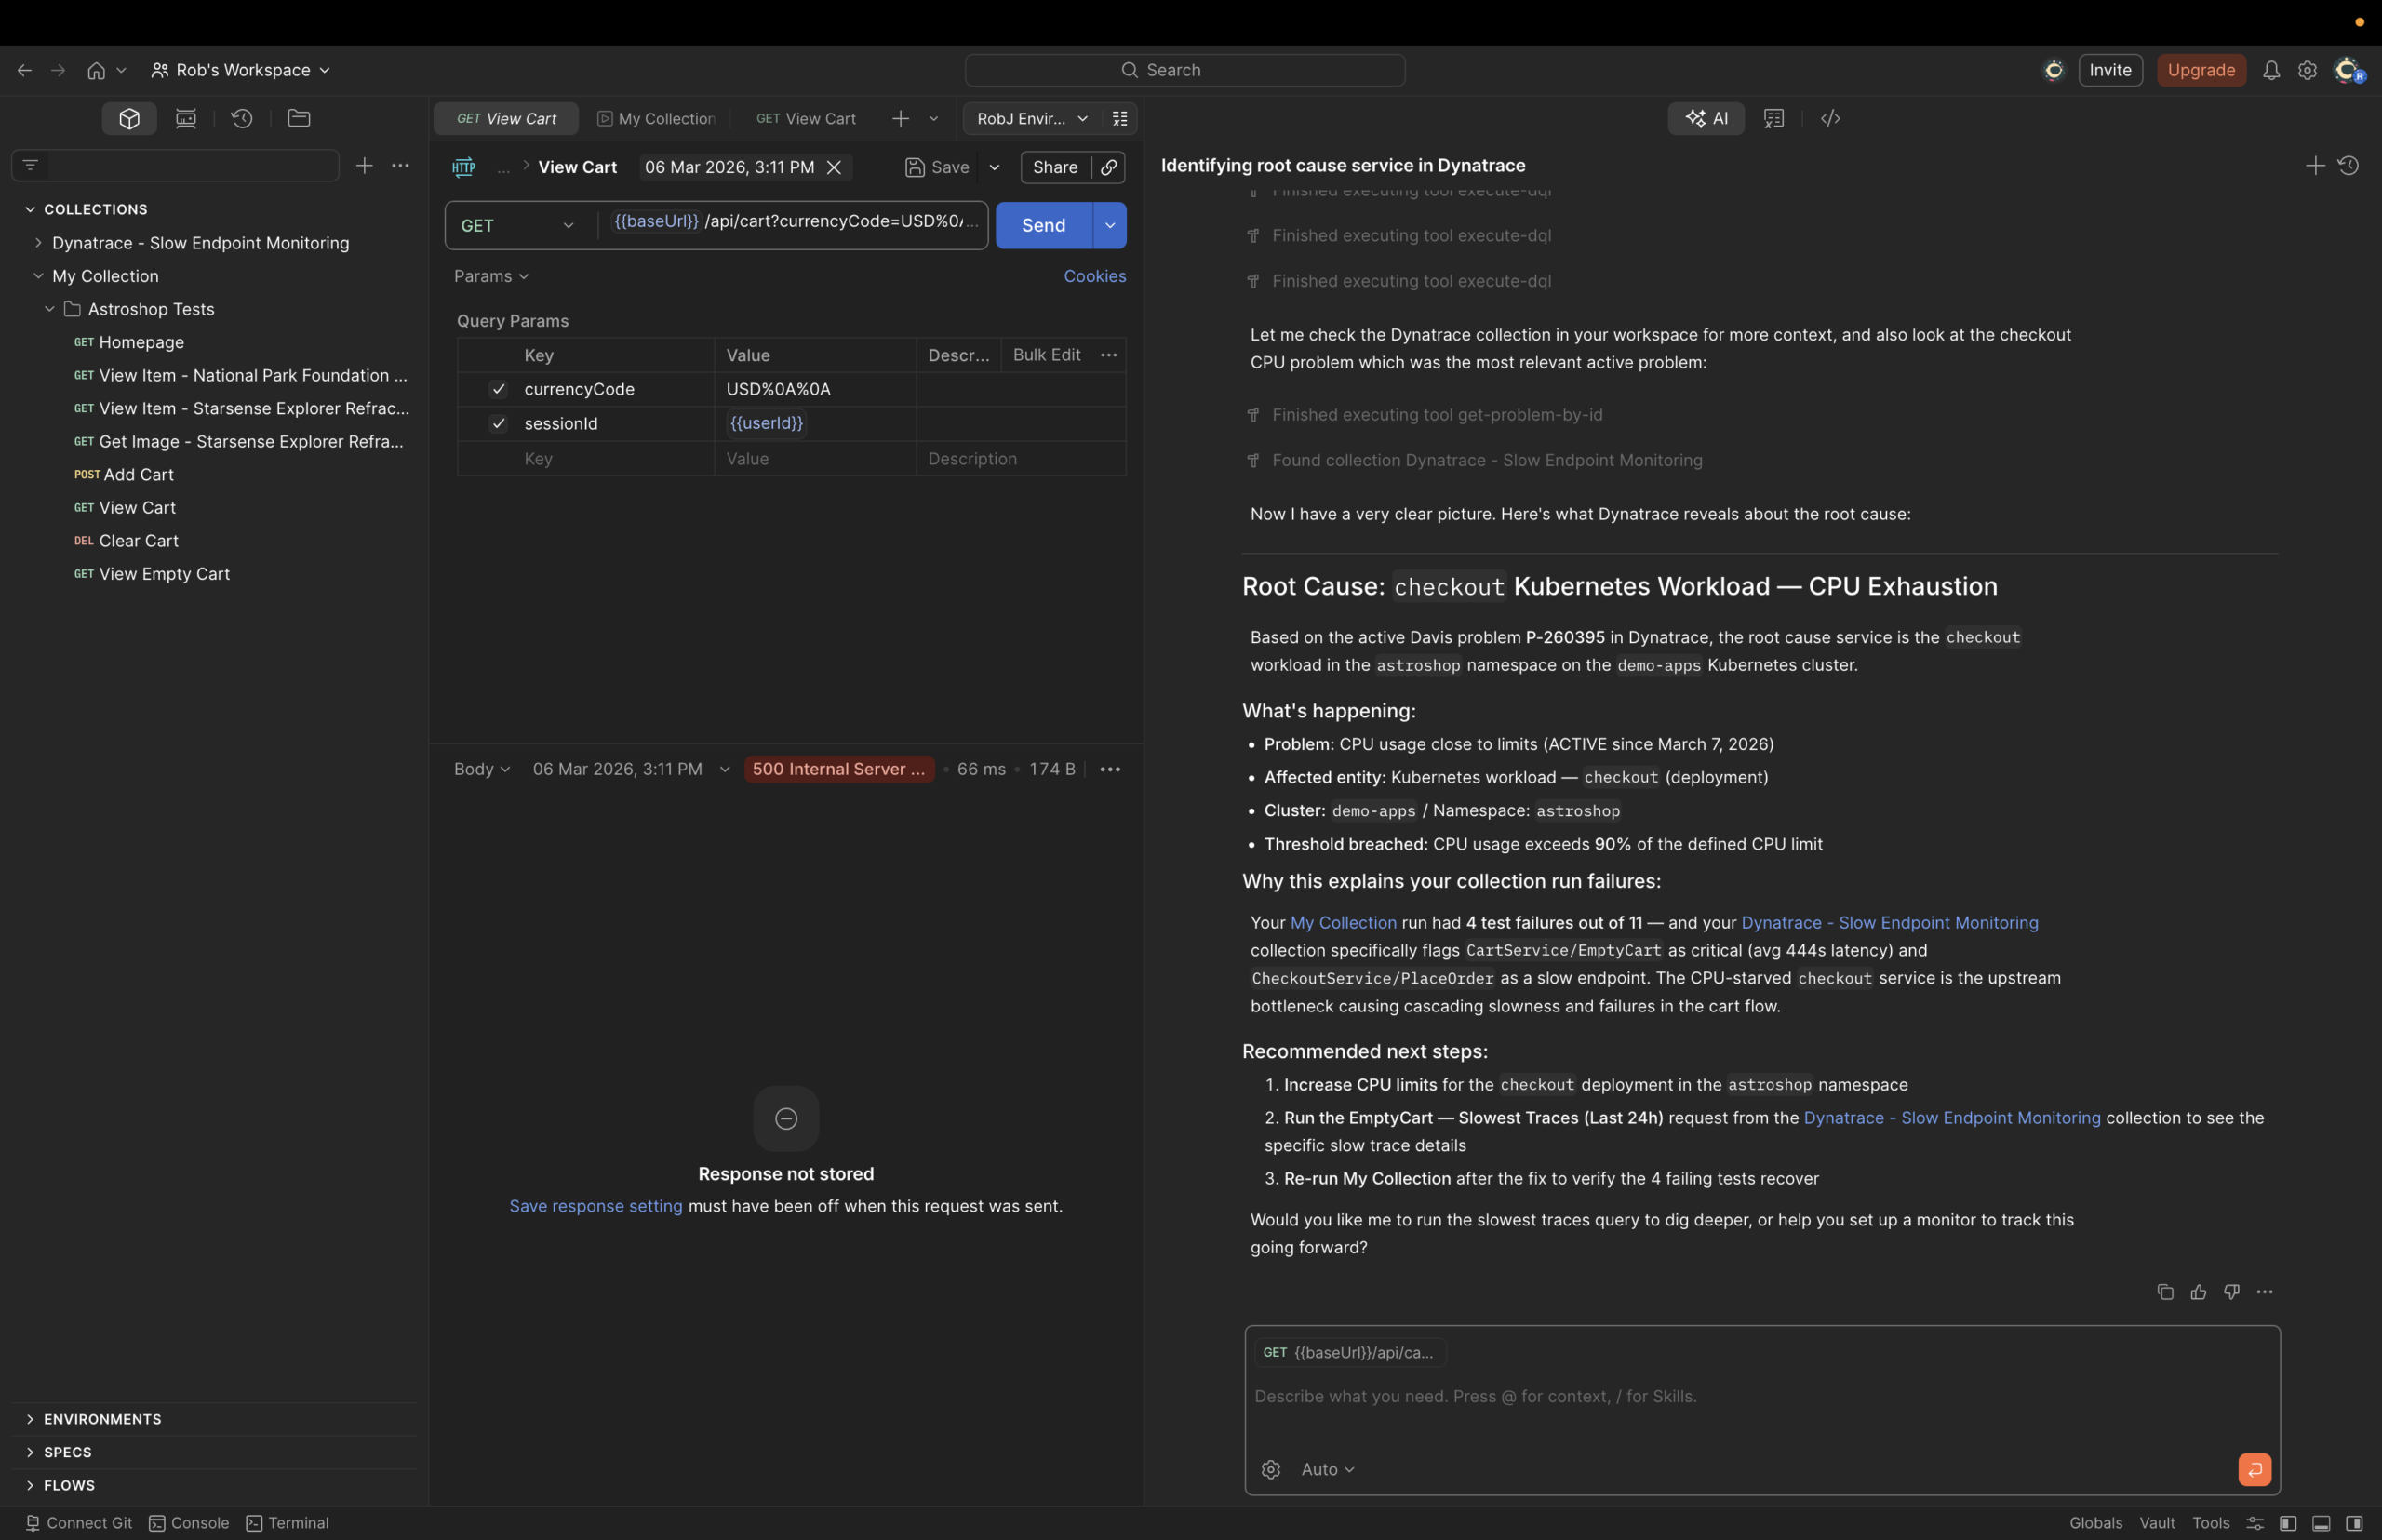
Diagnose and resolve API failures with Dynatrace insights
By running API tests and intentionally triggering failures, you can leverage the MCP server to pinpoint the root causes of errors, such as backend issues or logic bugs, using the real-time insights from Dynatrace. This empowers developers and testers to quickly distinguish between code and infrastructure problems, accelerating debugging and improving application reliability.
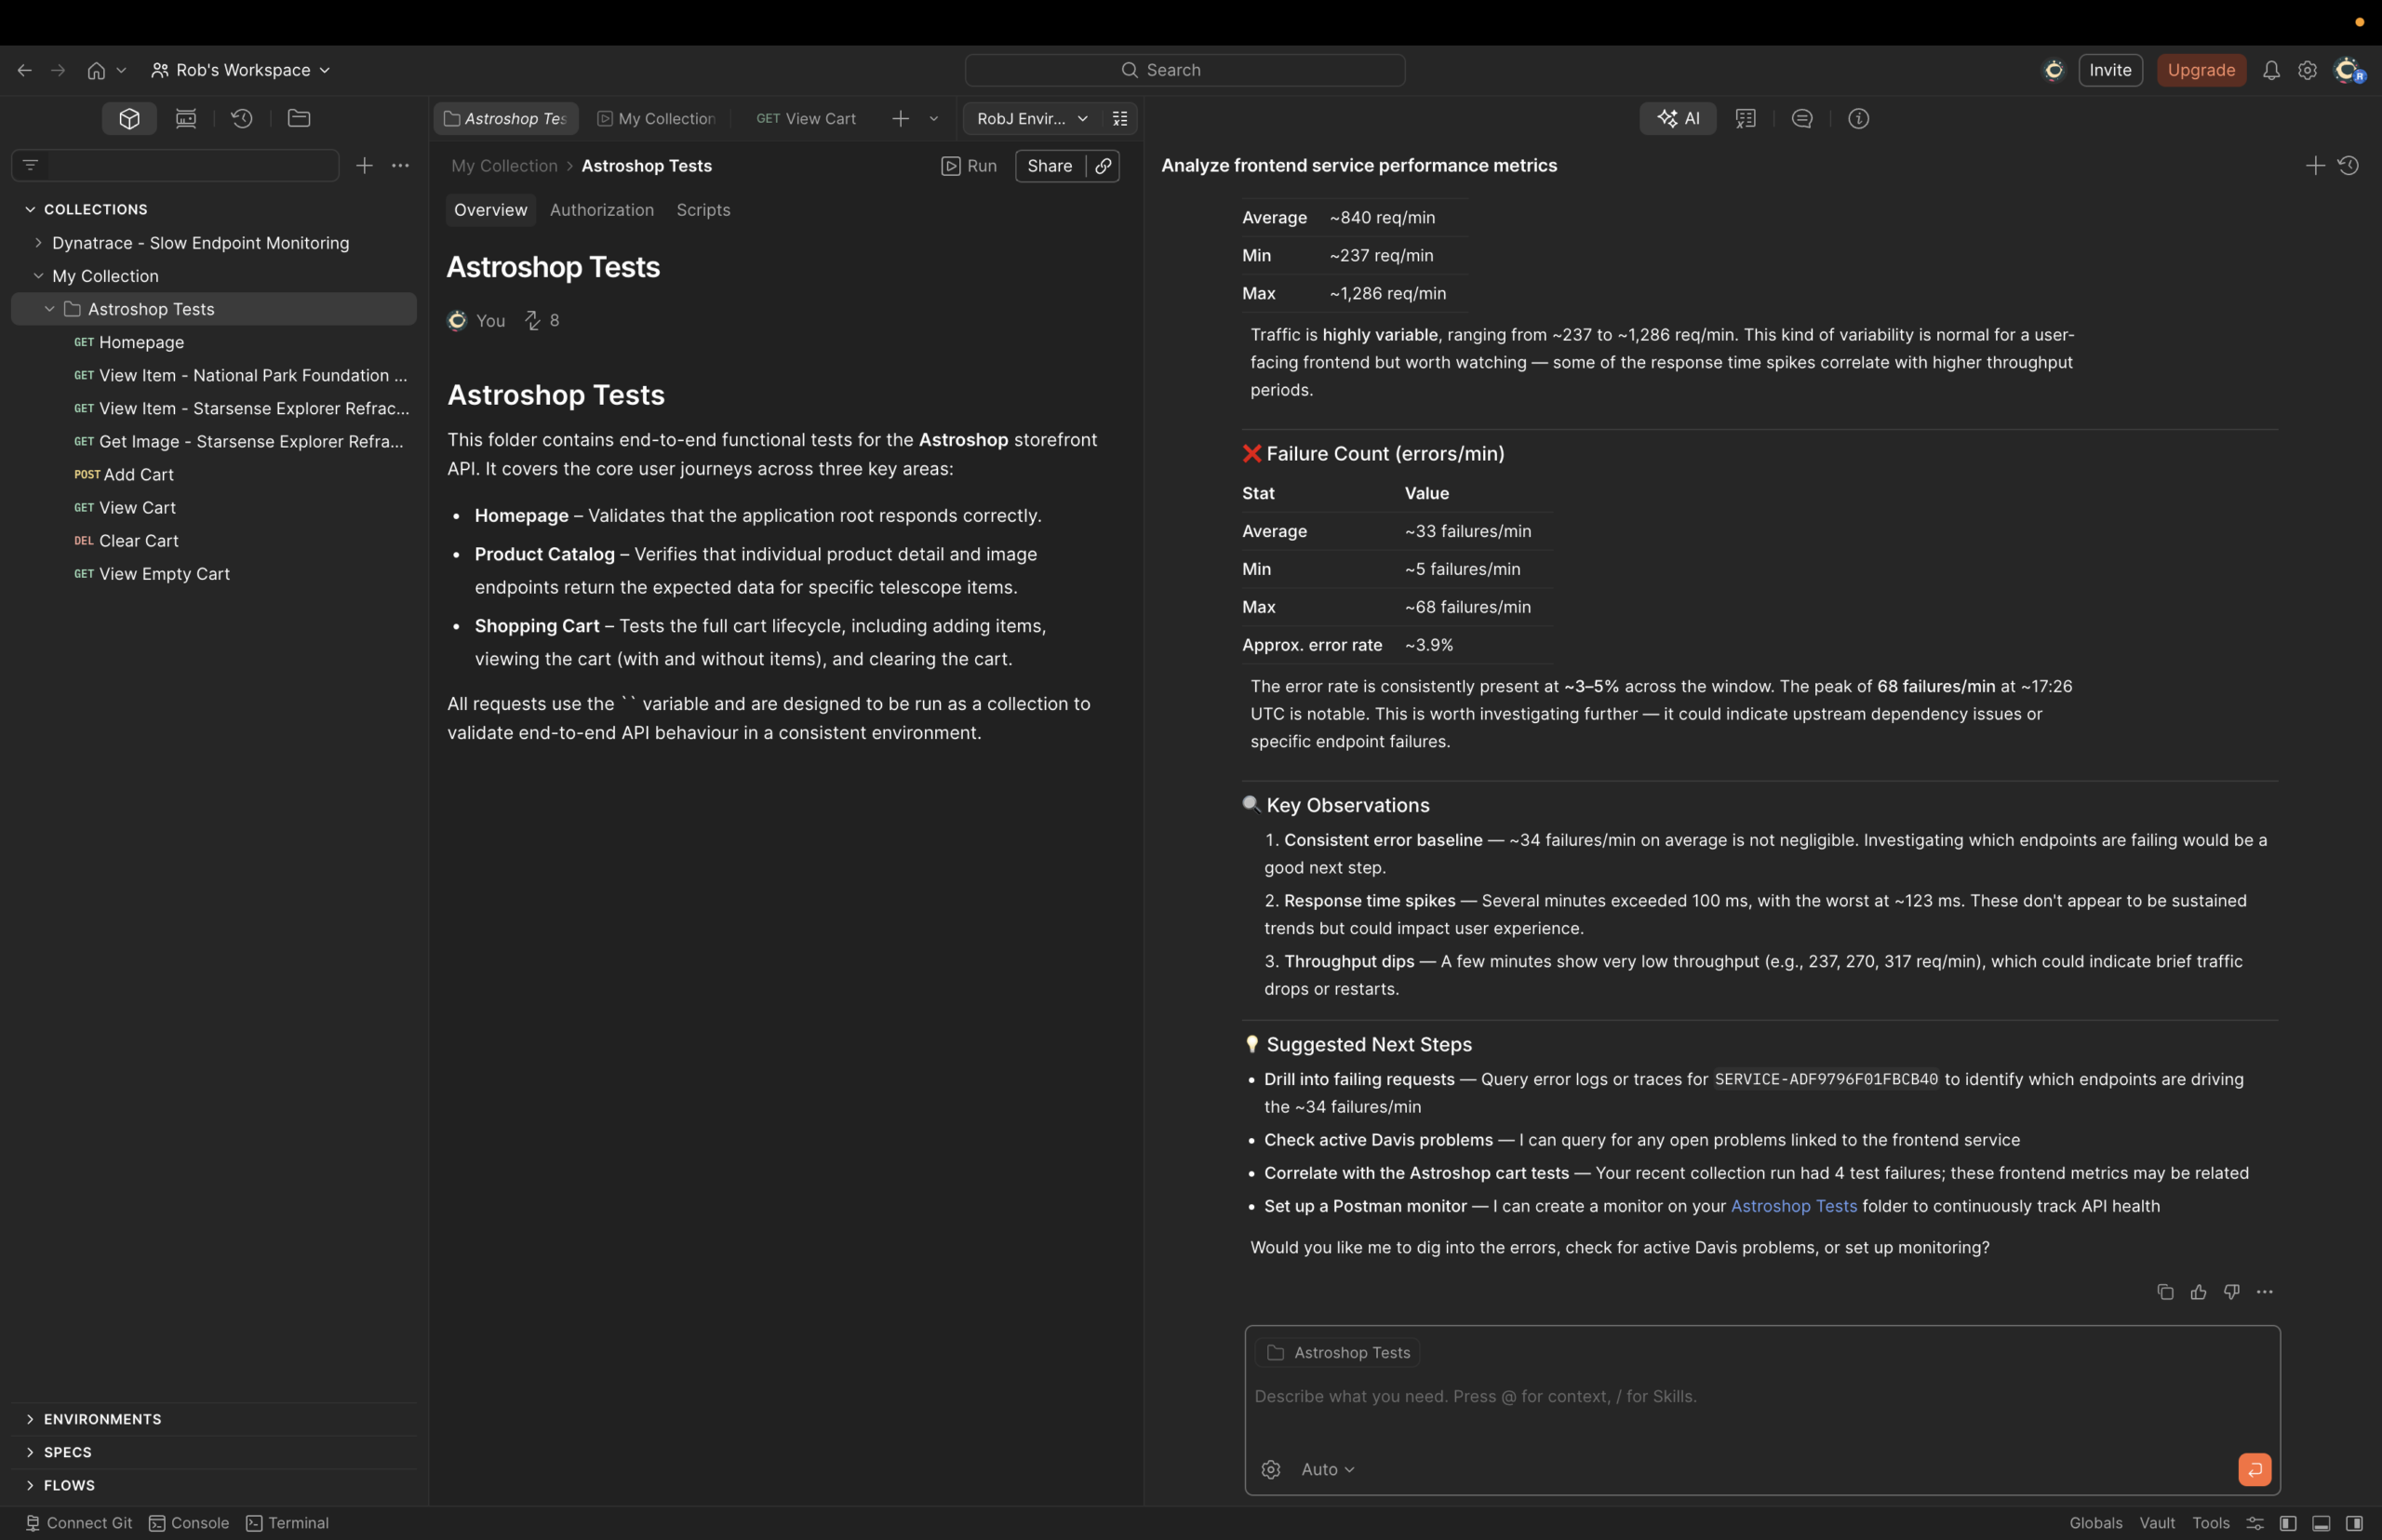
Get a holistic application health assessment in Postman
You can ask the MCP server in Postman broad, natural-language questions about the overall health of your application and the services monitored by Dynatrace. The server provides a summary of performance and health across multiple services, highlights slow endpoints, and offers actionable recommendations. This allows you to quickly identify bottlenecks and focus on critical issues, supporting proactive performance management and efficient troubleshooting.
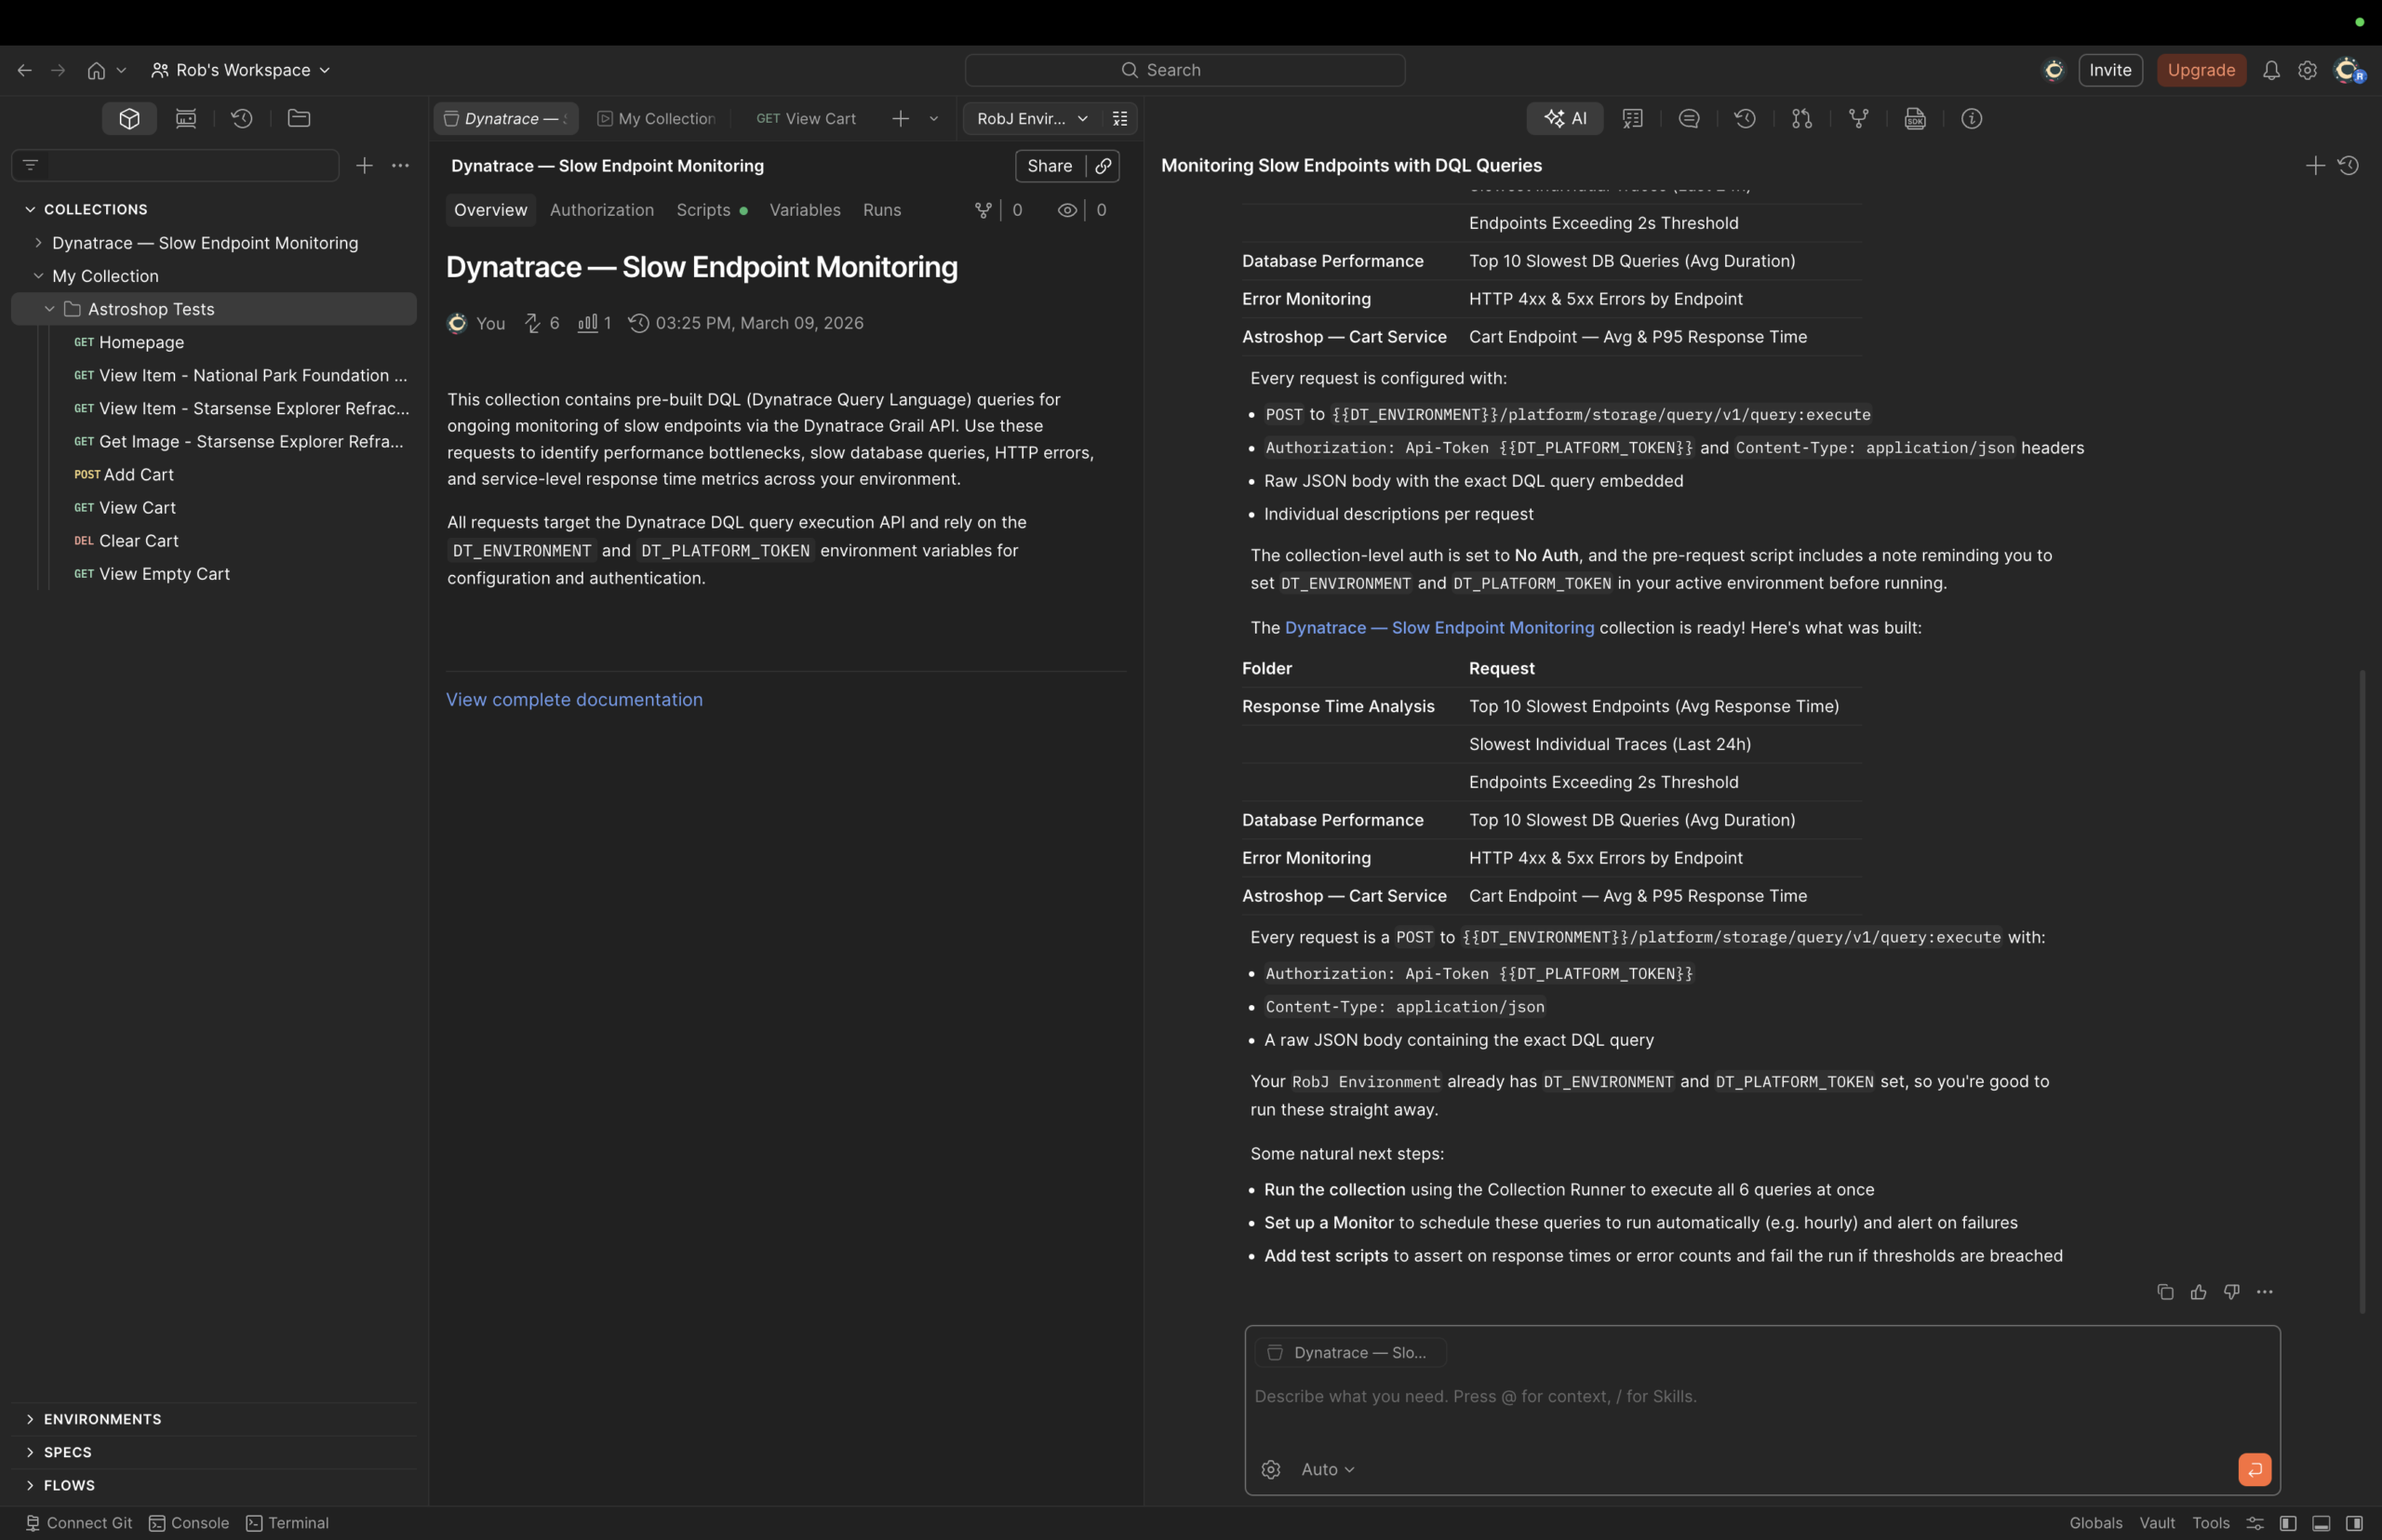
Automate continuous health checks with Postman collections
You can have Postman automatically generate collections that call Dynatrace endpoints on a schedule, enabling ongoing performance and health monitoring between releases. This ensures teams are proactively alerted to issues, supporting continuous delivery and higher service quality.
Reduce guesswork in AI-assisted workflows
AI‑assisted development is only as effective as the context an agent can access. Without reliable runtime data, agents are limited to reasoning from API definitions, test results, and assumptions, making it difficult to distinguish real system issues from surface‑level symptoms.
By connecting Postman’s Agent Mode to Dynatrace through MCP, agents can ground their reasoning in trusted observability data from live systems. This gives the agent access to the same production signals developers rely on today, such as service health, performance trends, errors, and dependencies, rather than relying on inferred behavior alone.
The result is more actionable AI assistance. Instead of guessing why an API behaves a certain way, the agent can explain what is happening in the system and why, reducing false conclusions and improving the quality of recommendations in AI‑driven workflows.
Try Postman’s Agent Mode with Dynatrace
The Dynatrace MCP Server is available in the Postman MCP Catalog and can be connected to Postman’s Agent Mode to bring runtime observability data directly into API workflows.
- Learn more about the Dynatrace MCP Server on Dynatrace Hub
- Try out Agent Mode with the Dynatrace MCP server:
For teams already using Dynatrace and Postman, this is a straightforward way to add production context to AI‑assisted API development. For teams exploring Agent Mode, it provides a practical foundation for grounding agent workflows in real system behavior.


Looking for answers?
Start a new discussion or ask for help in our Q&A forum.
Go to forum