Some years ago, I worked closely with the Spring Framework team as a product manager at Pivotal Software. In 2015, the Spring folks already regarded Dynatrace as the gold standard for performance monitoring. With PurePath® distributed tracing, method hotspots, service flows, memory, and GC analysis, Dynatrace earned its reputation.
Since then, Spring and Dynatrace have matured and improved, especially for containers, cloud integrations, and Kubernetes. Spring also introduced Micrometer, a vendor-agnostic metric API with rich instrumentation options. Soon after, Dynatrace built a registry for exporting Micrometer metrics.
Dynatrace remains heavily involved and invested in Spring Micrometer. Our data APIs, which ingest millions of metrics, traces, and logs per second, are reconciled using Micrometer-based metrics. We also use Micrometer to analyze ingest queue processing speed, which helps us make decisions about adding resources.
In pushing the limits of Spring Micrometer, we implemented a handful of improvements that jointly benefit Dynatrace and our customers:
- We introduced automatic metric enrichment for proper Kubernetes Pod, Workload, Namespace, Node, and Cluster associations in Dynatrace.
- We optimized our Micrometer Registry to export data in memory-efficient chunks. This also led to improvements in our ingest API. We now accept over 1,000 data points in each request.
- We added unit and description metadata for greater interoperability and clarity.
Get started with the Dynatrace registry for Spring Micrometer
Spring Initializr is the fastest way to create an application that includes the Dynatrace registry. We’ll demonstrate this with a demo Spring application, which uses the Spring Web and Dynatrace Micrometer registry, as shown below.
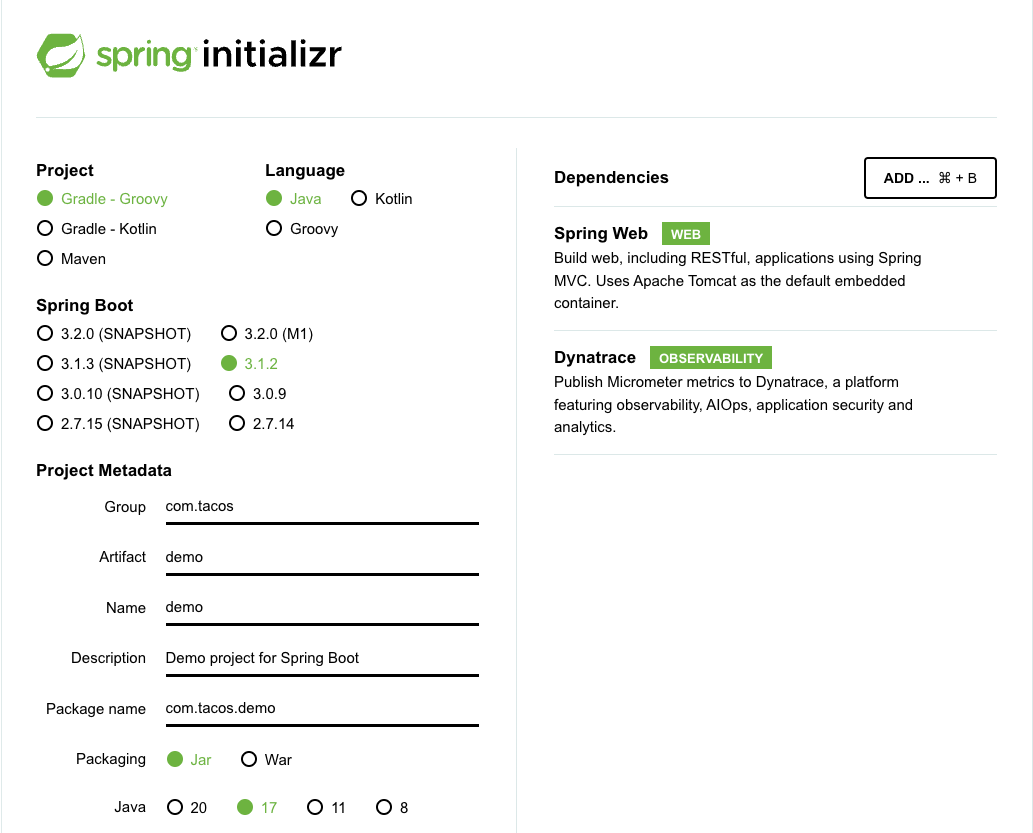
With these dependencies in place, we can import Sping Micrometer instruments into our example application, as shown in this controller. The demo application orders and delivers tacos, so we’ll use a simple counter for successful, and failed, taco deliveries.
import io.micrometer.core.instrument.Metrics;
import io.micrometer.core.instrument.Counter;
We instantiate some counters further down in the controller:
Counter successfulDeliveries = Metrics.counter("deliveries", "success", "true");
Counter unsuccessfulDeliveries = Metrics.counter("deliveries", "success", "false");
Then we call the increment function for successful (or failed) deliveries:
successfulDeliveries.increment(tacosInt);
Automatic Spring Micrometer endpoint configuration and enrichment
Combining Spring Micrometer with Dynatrace OneAgent® has many advantages. Firstly, OneAgent automatically configures the Dynatrace Micrometer Registry to export metrics to a Dynatrace API URL and provides a token with zero configuration.
OneAgent also provides Spring Micrometer metrics with best-in-class distributed tracing, plus memory and garbage collector analysis for Spring Java applications and microservices.
Another advantage of injecting OneAgent into a Spring application is auto-enrichment, which provides Micrometer metrics with pod, workload, container, cluster, and node identification. This metadata puts Micrometer metrics in their proper context, as we’ll show you.
Auto-enrichment is also available in cases where OneAgent is unavailable or unnecessary. In these cases, the Dynatrace Operator for Kubernetes provides enrichment as well. Either way, the Dynatrace Micrometer Registry adds proper topology without modifying your code.
Before we deploy the taco delivery example to Kubernetes, we’ll instrument the cluster using the Dynatrace Operator. The fastest way is via QuickStart, which is explained in our documentation.
With the Operator installed, we deploy the taco delivery application.
git clone https://github.com/mreider/taco-tuesday.git
cd taco-tuesday
kubectl create namespace tacos
kubectl apply -f k8s/deliveries.yaml -n tacos
kubectl apply -f k8s/orders.yaml -n tacos
After everything is deployed, we can write a simple statement using Dynatrace Query Language (DQL) to confirm that things are working properly.
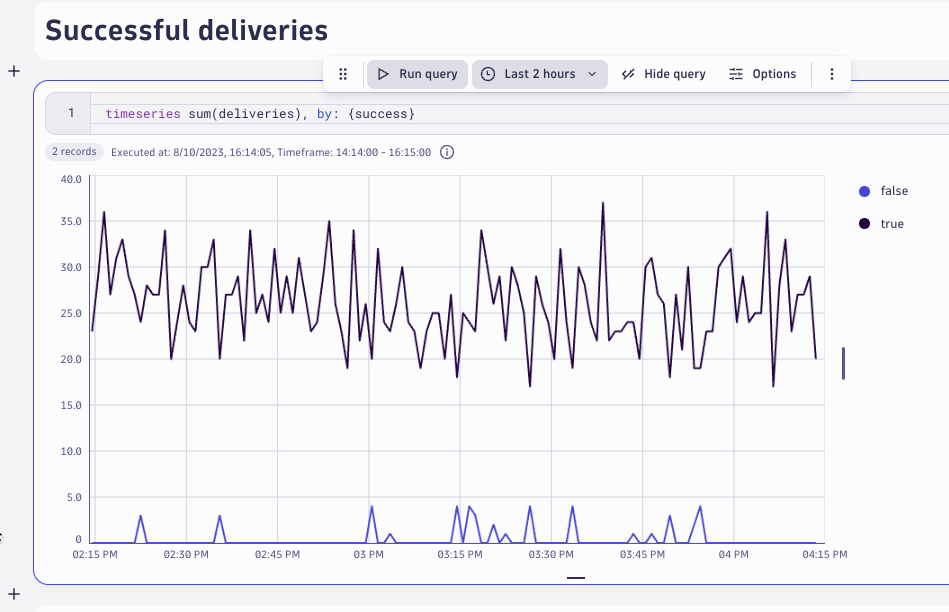
Leverage Workflows, DQL, and Slack integrations
Viewing a time series chart, like this Taco Delivery metric, whether in a dashboard or notebook, confirms everything is working properly. But the true power of Dynatrace is in the blending of metrics, traces, and logs in a single unified analytics view, as you’ll see in a moment.
First, using Dynatrace Workflows, let’s build a simple workflow to trigger Slack messages for failed taco deliveries using AutomationEngine and DQL. The Slack message provides links to these unified analytics views and gathers associated trace IDs to look at transactions and code-level insights.
We’ll start by creating anomaly detection for a Spring Micrometer metric event triggered whenever a certain number of taco deliveries fail during any one-minute timeframe.
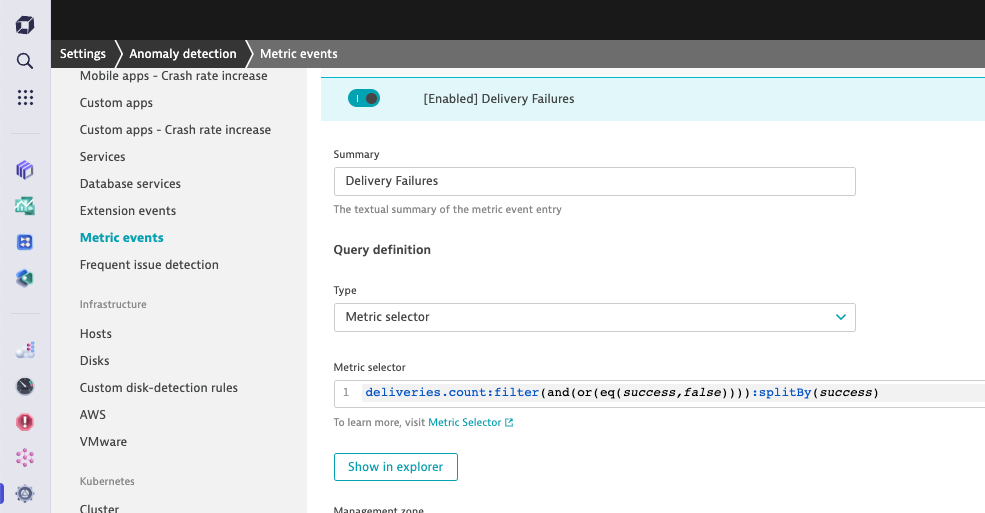
Next, we’ll create a workflow triggered whenever such a metric event is generated. The workflow executes a DQL query, retrieves log files and trace IDs and attaches links to the relevant pages. Definitions of the Slack workflow are also in the Git repository.

As expected, when the workflow is triggered, a Slack notification with links to traces and analysis pages is sent.

Unified analysis in context
The Slack message contains a link to the Deliveries Workload Kubernetes page, shown below, which provides a high-level picture of what’s happening. It shows logs, aggregated failure rates, and resource utilization metrics for all instances of the pods across every transaction.
In addition, the Deliveries page provides Davis® causal correlation analysis to reveal relationships between these aggregated metrics and the triggered Micrometer events.
Notice that the page is Kubernetes-centric. For example, CPU utilization is a percent of the CPU limits set in the Kubernetes deployment manifest.
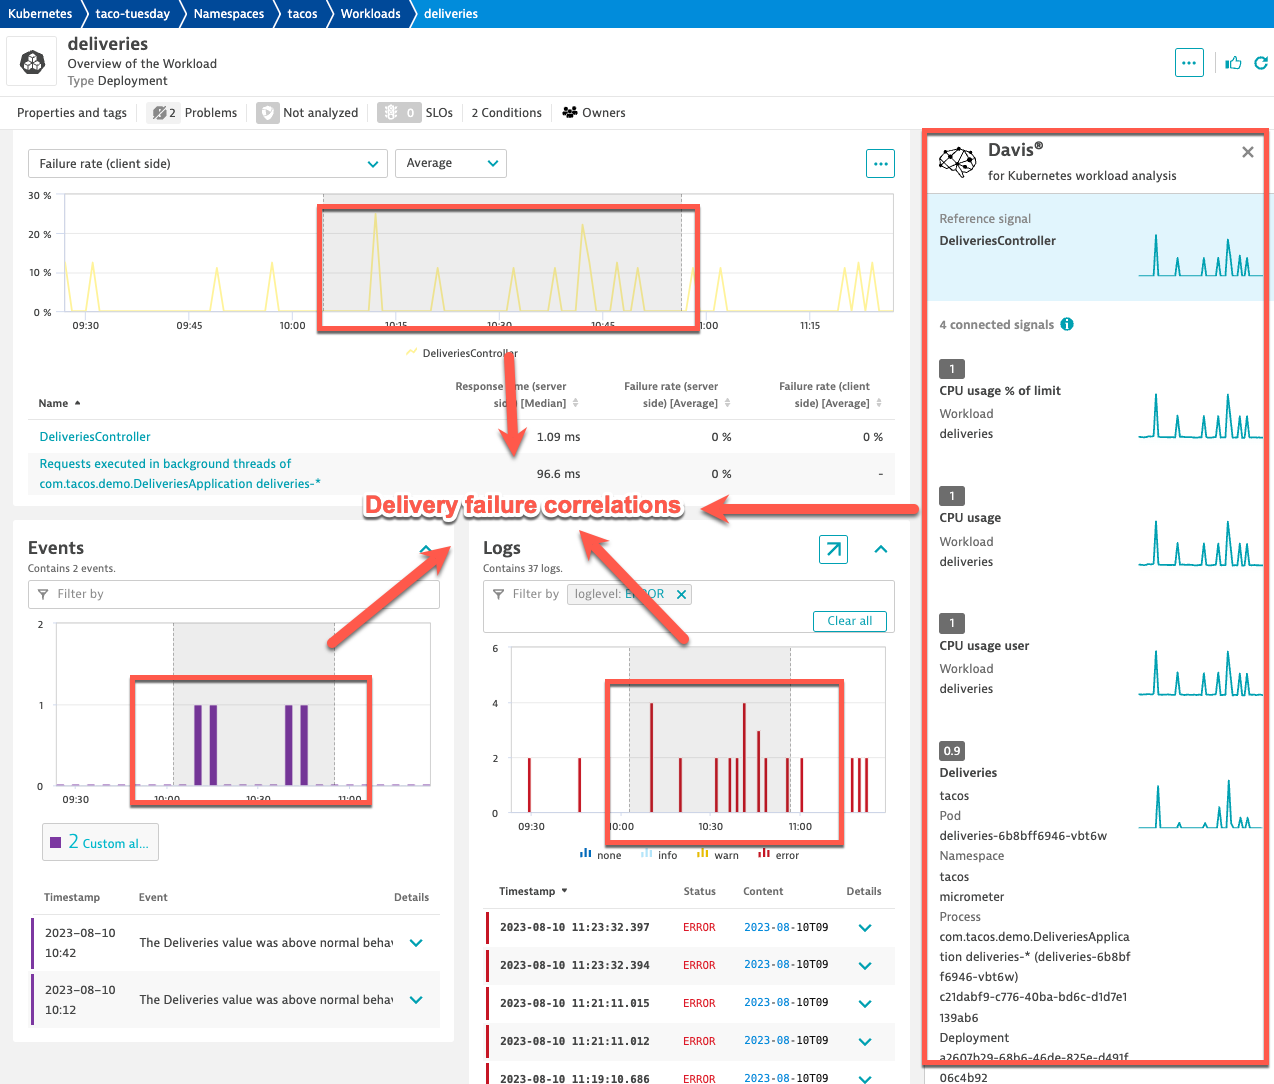
These connected signals illustrate how Dynatrace encourages analysis with context and topology in mind. Where most observability solutions force you to look at logs, metrics, and traces independently and out-of-context, Dynatrace employs a unified view of the microservice and combines related signals together.
Spring Micrometer chart injection
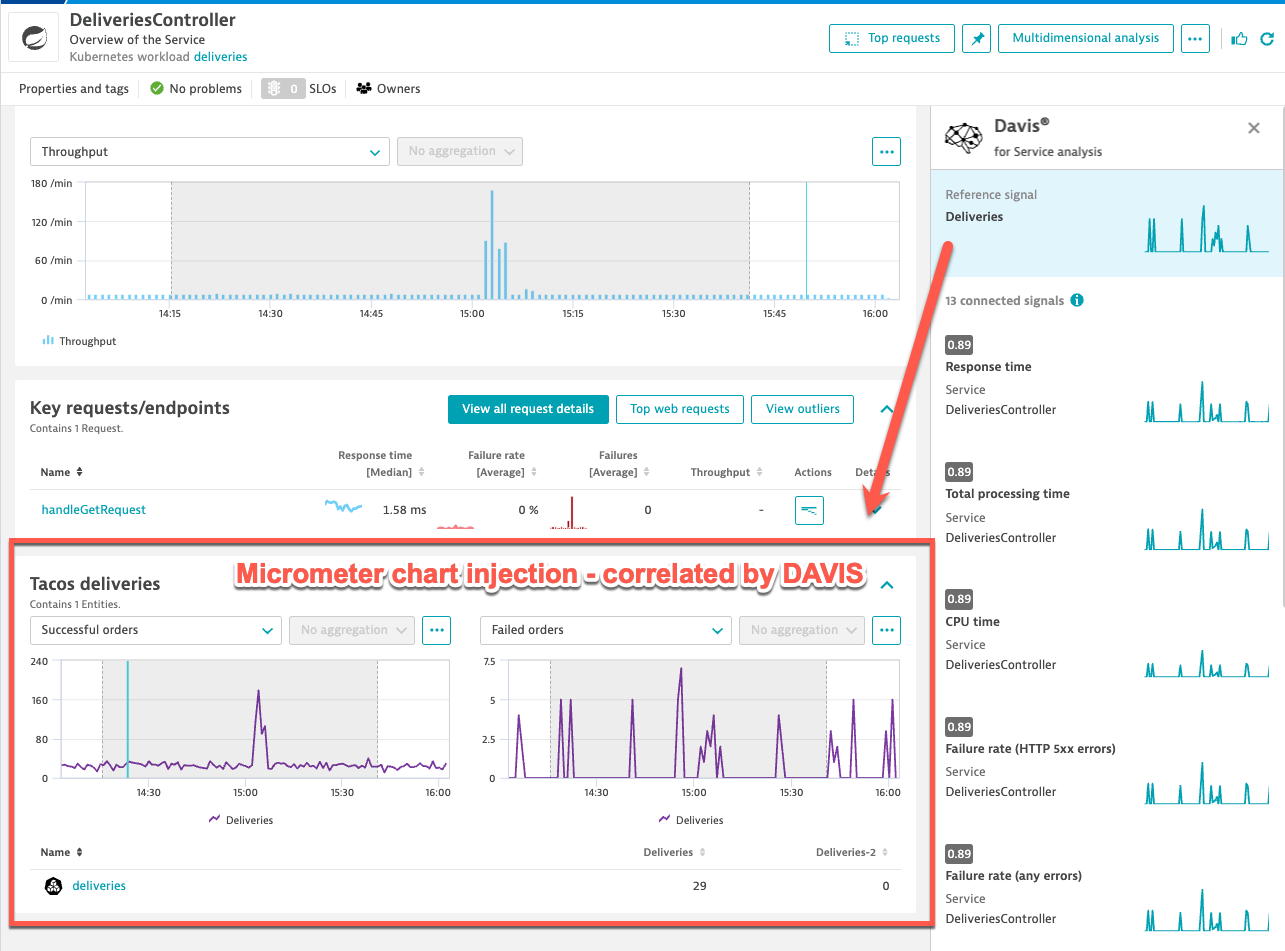
Included in the taco delivery app is an example of chart injection for both the Kubernetes Workload page, shown in the last section, as well as the DeliveriesController Services page, which provides an overview of the distributed traces in the Slack message correlated with key requests, and resource utilization.
Injecting Micrometer charts into these pages is accomplished using the Dynatrace Extension Framework (see documentation). There is a helpful Visual Studio Code extension, described in this community post, available in the VSCode Marketplace to speed up implementation, deployment, and activation.
The extension injects two charts, showing Spring Micrometer metrics for taco delivery successes and failures. These metrics also work seamlessly with Davis causal correlation, as shown in the following screenshot.
Traces and code-level insights
Using Davis causal correlations, we’ve established a connection between delivery failures and resource utilization increases. We can begin exploratory analysis using some example traces where delivery failures occurred.
Fortunately, back in our Slack message, we have relevant links available. Selecting these links reveals failures and exceptions occurring in the Spring handleGetRequest method of OrdersController, as shown below. Notice that Dynatrace connected the frontend Python service, instrumented with OpenTelemetry, with the Spring DeliveriesController service, which was instrumented with OneAgent. (This bit of special sauce deserved a short explanation.)

From this trace view, we select the handleGetRequest span to view code-level insights, which include the specific methods where time was consumed and exceptions occurred.

Dynatrace brings Spring Micrometer to the next level
Combining Spring Micrometer metrics with Dynatrace is an incredibly powerful combination. The Dynatrace Micrometer Registry is both battle-tested and optimized for our own ambitious observability needs.
Dynatrace brings Spring Micrometer to the next level by providing Davis causal correlations for exploratory analysis, distributed traces (with OpenTelemetry, PurePath, or a combination of the two), deep code-level insights, sophisticated workflows using the AutomationEngine, unified analysis views, and our heterogenous query language (DQL), capable of joining all observability signals at once.
Existing customers can get started with Spring Micrometer by referring to our documentation. Others can get started with a free 15-day trial.


Looking for answers?
Start a new discussion or ask for help in our Q&A forum.
Go to forum