
Are you curious about using Dynatrace analytics and automation capabilities for your custom use cases? Have you wondered how you can put your data to work and create bespoke solutions for your specific needs?
In this blog post, we explore real-life scenarios shared by our customers, partners, and internal users at Dynatrace, offering inspiration to kickstart your own journey with custom solutions powered by AppEngine.
For many, the driving force behind custom solution development is today’s dynamic and rapidly evolving digital landscape, in which organizations find themselves in a race to automate repetitive tasks, drive data-backed decisions, and do more with less. Increasingly, organizations are exploring unified software platforms that eliminate data silos while offering both flexibility and extensibility to safeguard their investments and streamline their diverse tools.
Bring logic to data with easy-to-build apps
As a unified observability and security platform, Dynatrace is designed to be open and customizable from the ground up. By seamlessly integrating custom solutions, Dynatrace empowers data-driven decision-making, automation, and tool consolidation—all while maintaining the familiar out-of-the-box experience. The introduction of Dynatrace® AppEngine empowers customers and partners to build custom, compliant, and intelligent data-driven applications, ushering in a new era of platform extensibility.
Custom solutions come in all shapes and sizes, providing value for customers, partners, and internal Dynatrace users. Let’s explore some real-life custom solution examples that leverage the power of the Dynatrace core platform technologies to go beyond observability.
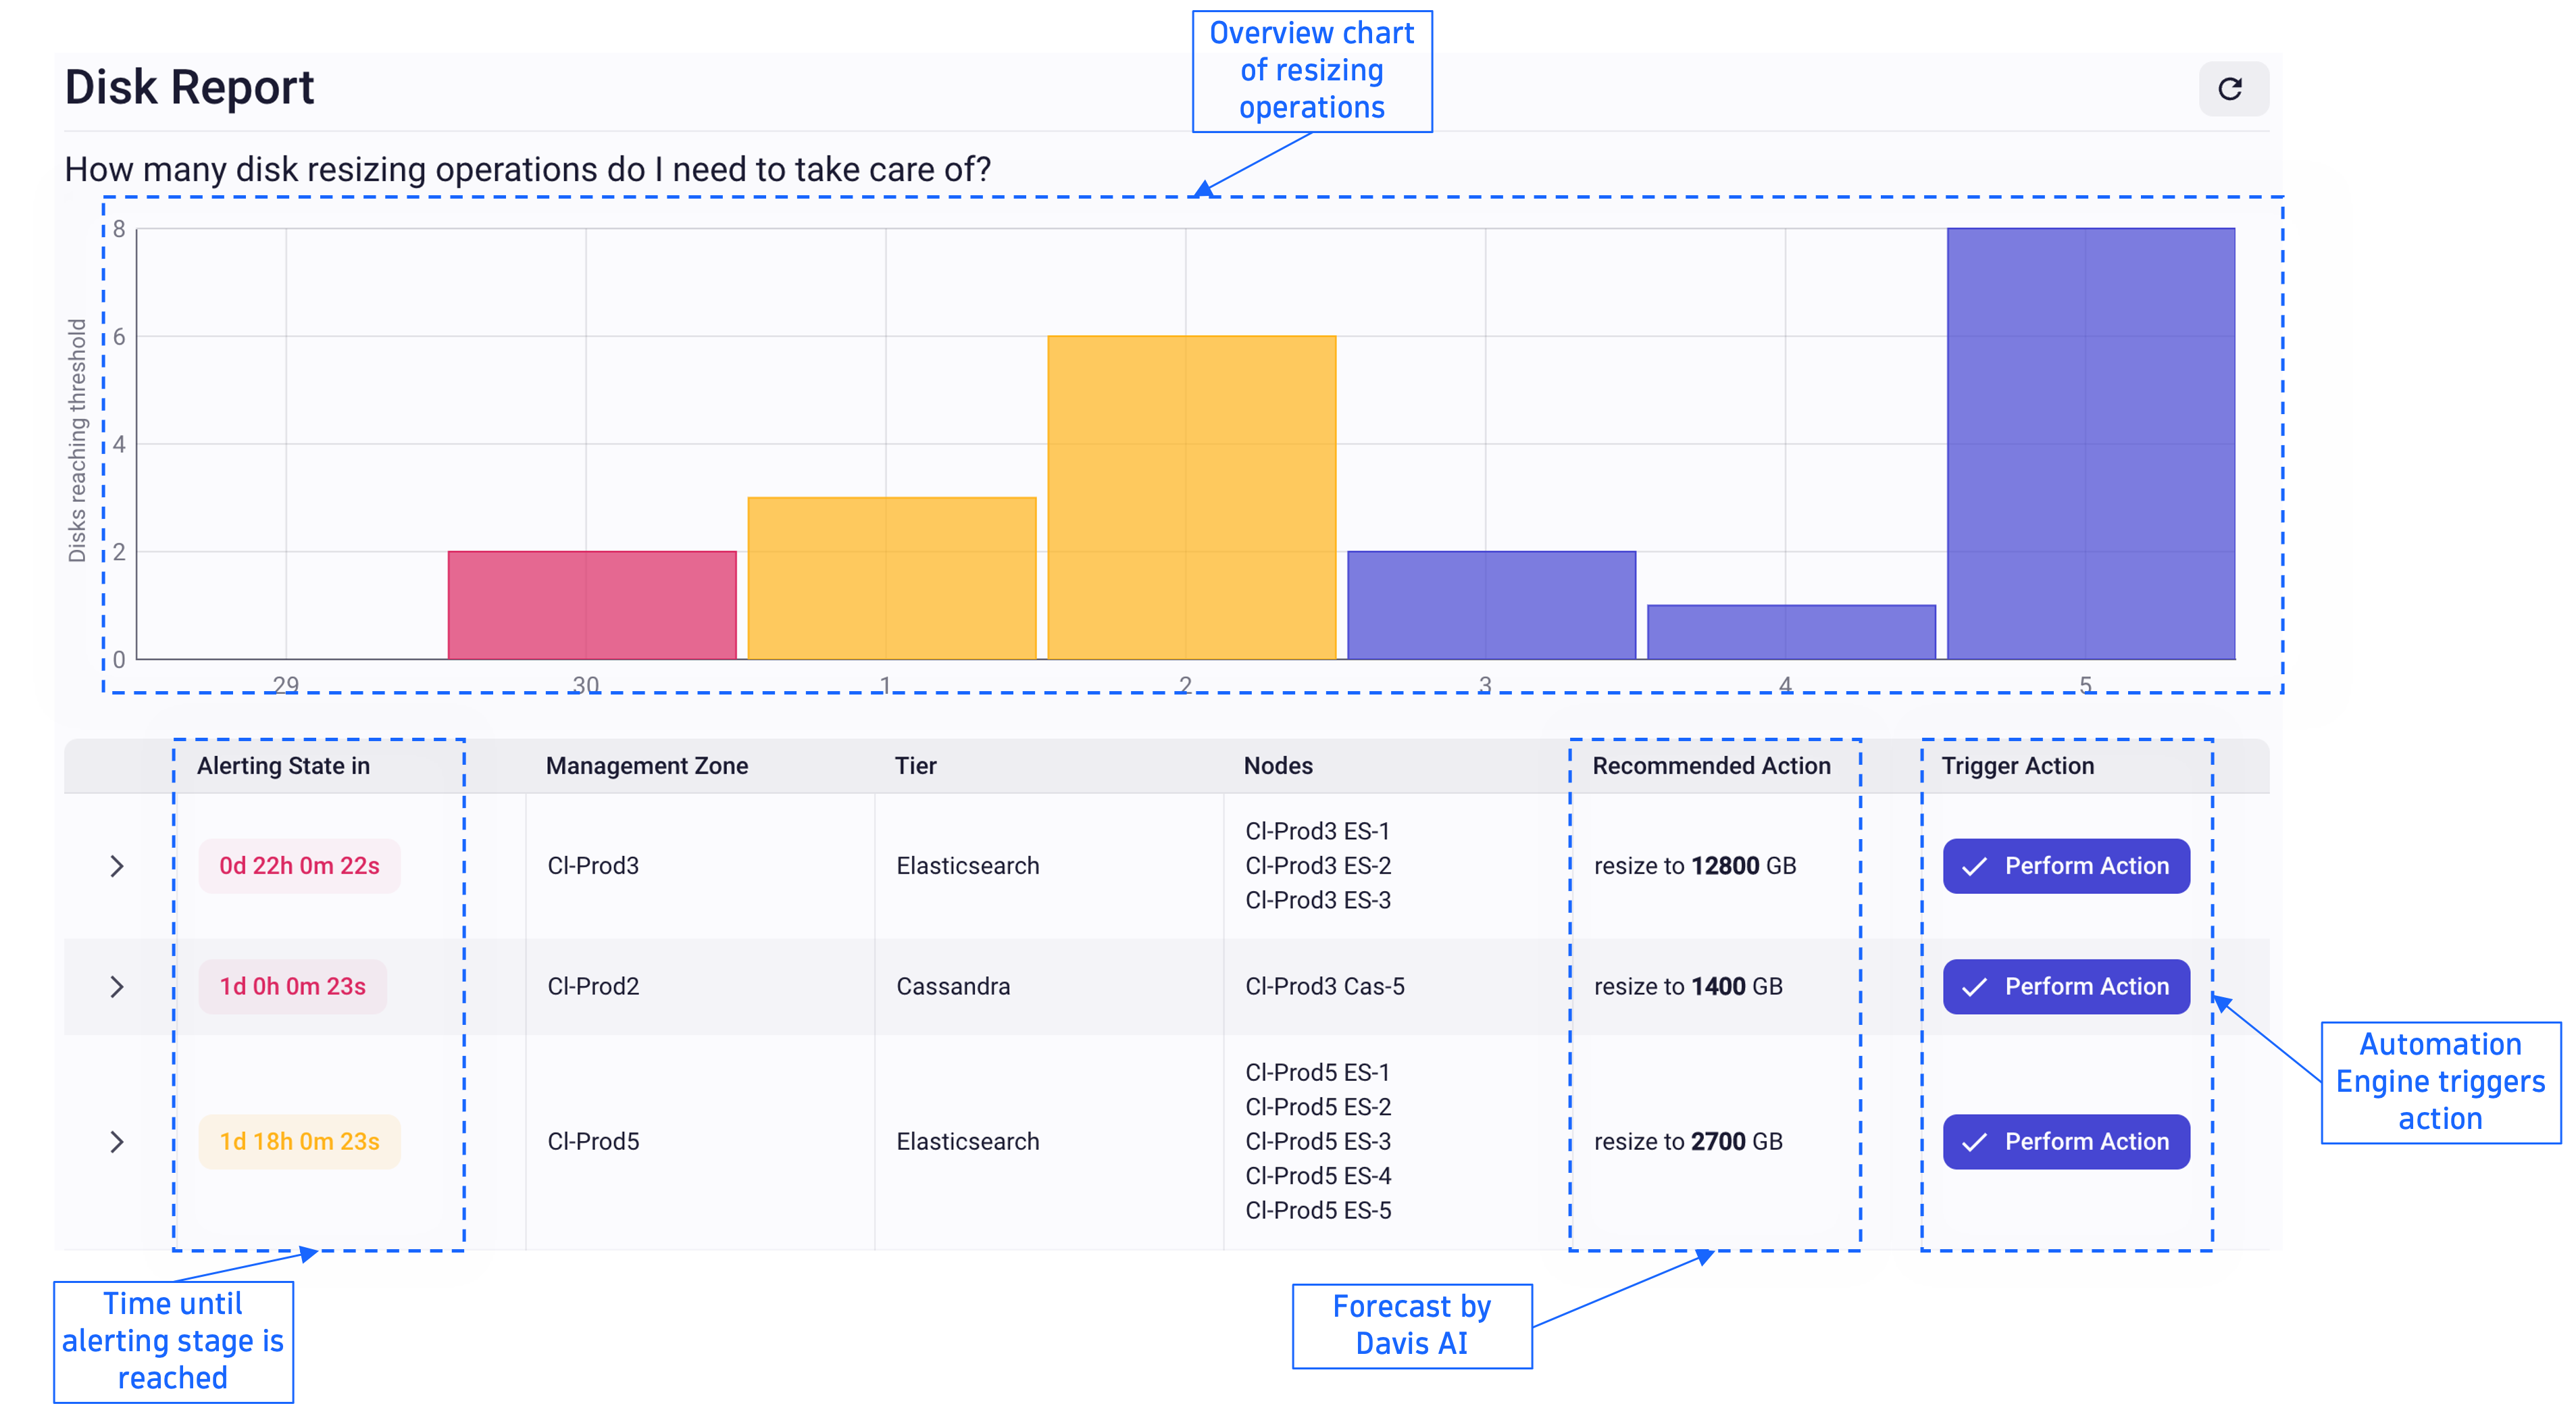
Automate disk resizing operations with Davis AI predictive analytics
The Dynatrace Site Reliability Engineering (SRE) team was looking for a way to automatically adjust disk space for cloud volumes on a regular basis to avoid over- or under-provisioning them. They needed a way to automatically calculate the disk resizing point and the target disk size to trigger the resizing operation. Using AppEngine as the foundation, they fed disk utilization data into Davis® AI to forecast the required resizing operation. With Automation Engine, they were able to call the cloud provider’s API to trigger the desired resizing action.
Developer Observability app provides a shared view of issues
Dynatrace production systems generate about 10 TB of log data each day, which contains valuable information about errors and other issues. Of course, development teams need to understand how their code behaves in production and whether any issues need to be fixed. With hundreds of teams, distributed systems, and terabytes of log data, this is a daunting task. The SRE team’s solution was to create a Developer Observability app that identifies potential problems in log data, grouping, triaging, and identifying the correct teams to work on fixes. The app scans all incoming logs for various patterns and uses DQL (Dynatrace Query Language) to collect context like hosts, other processes, and traces for each potential problem. The app uses Dynatrace EdgeConnect to automatically create a ticket in our on-premises Jira issue-tracking system.
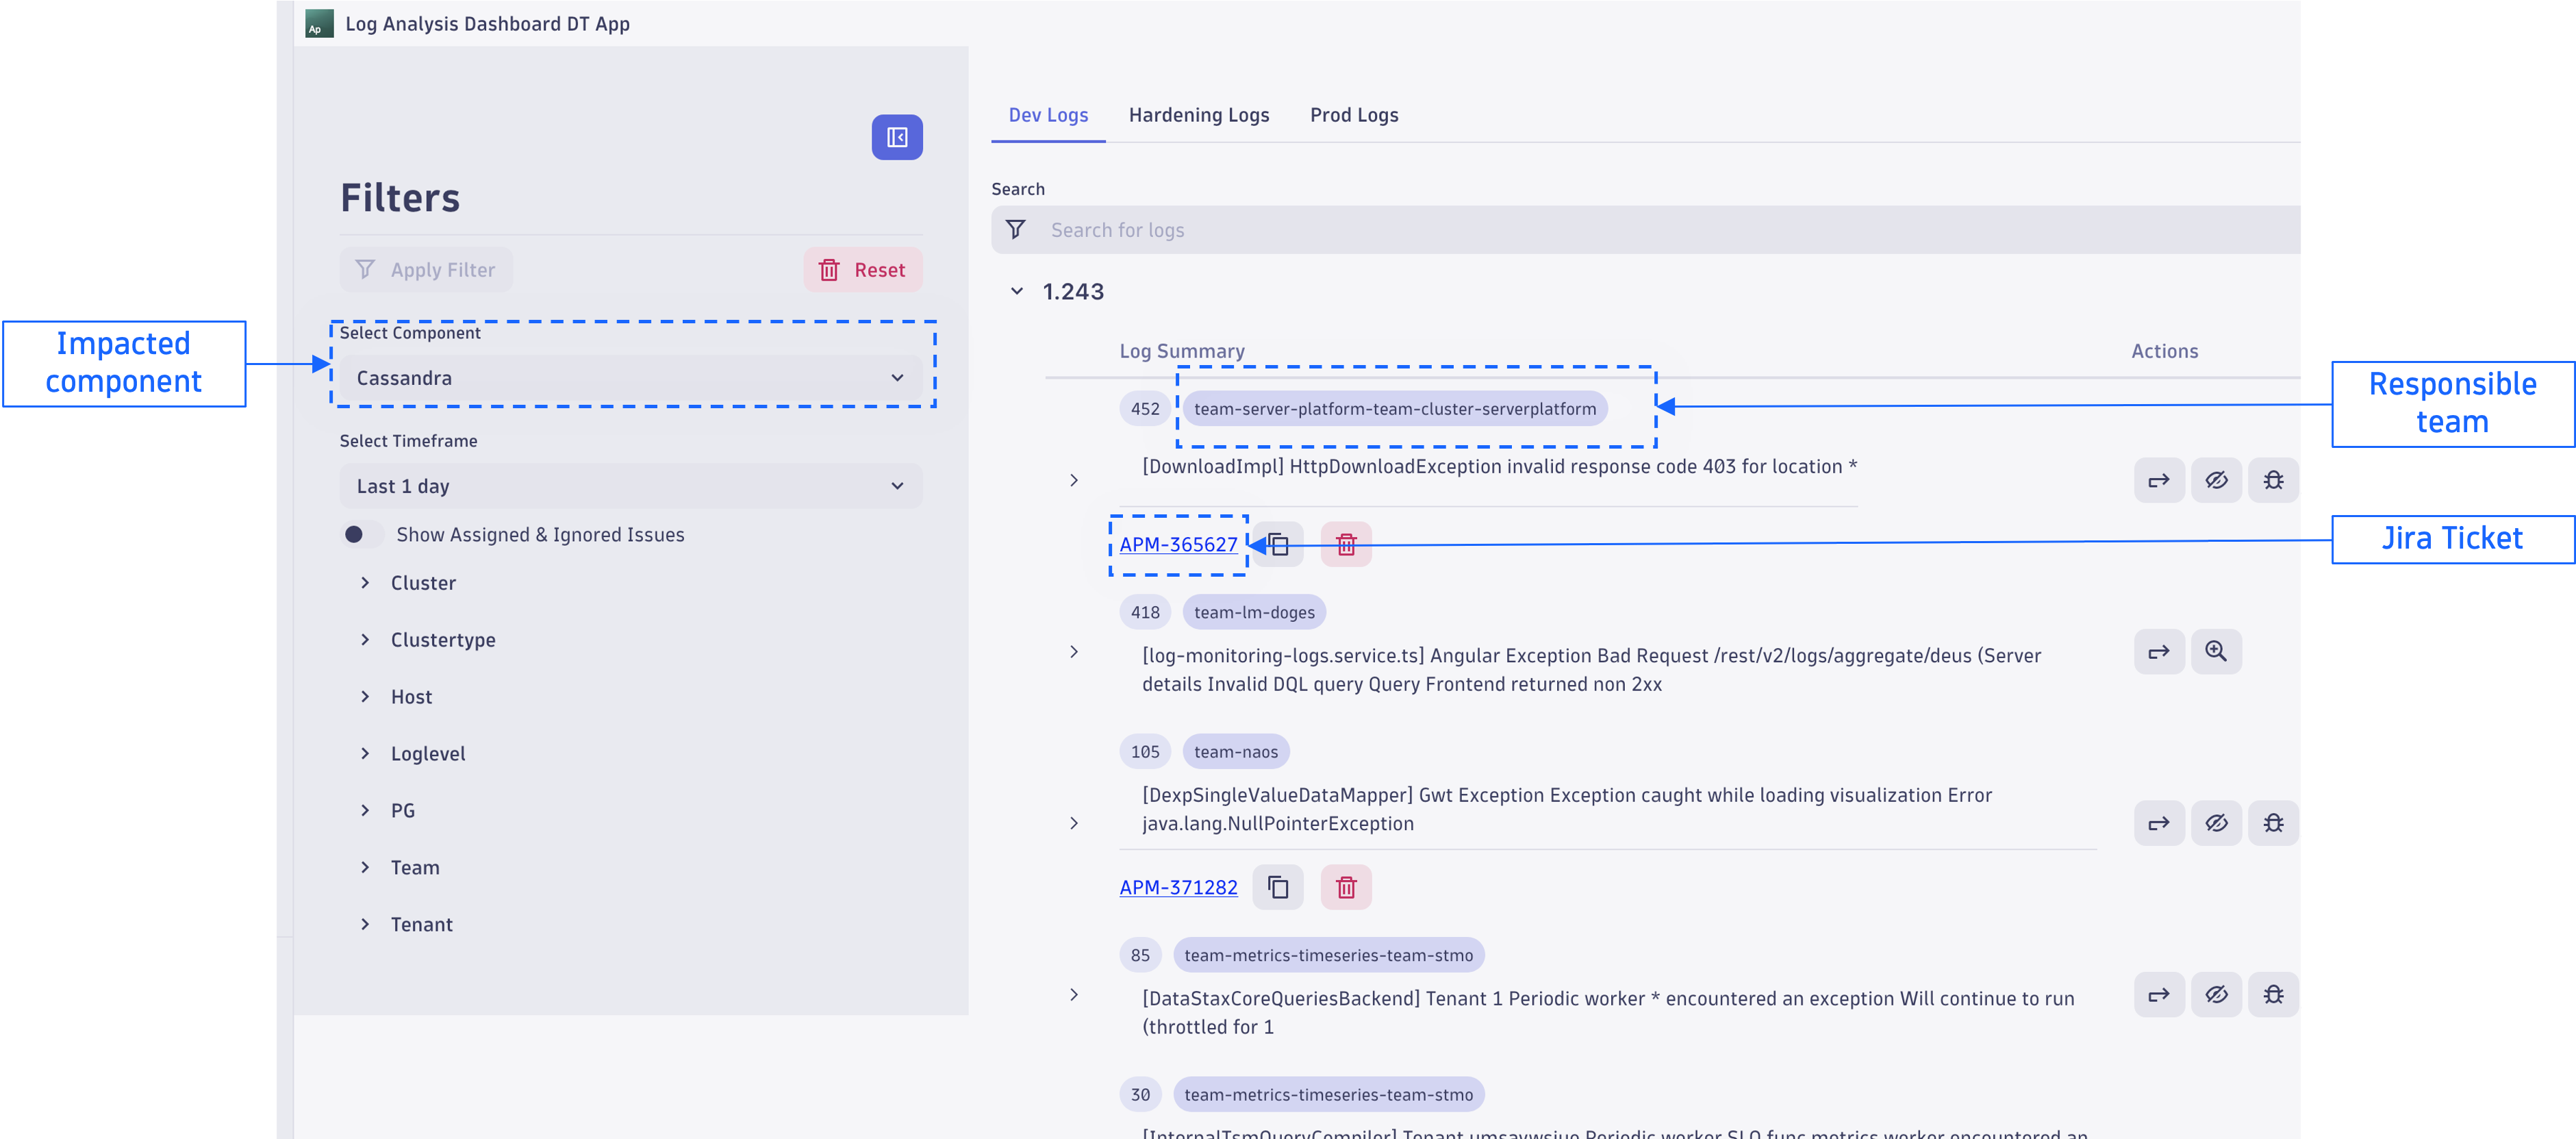
The app provides a dashboard view that gives all development teams an overview of their services, reducing the required effort per issue from many hours to a few minutes.
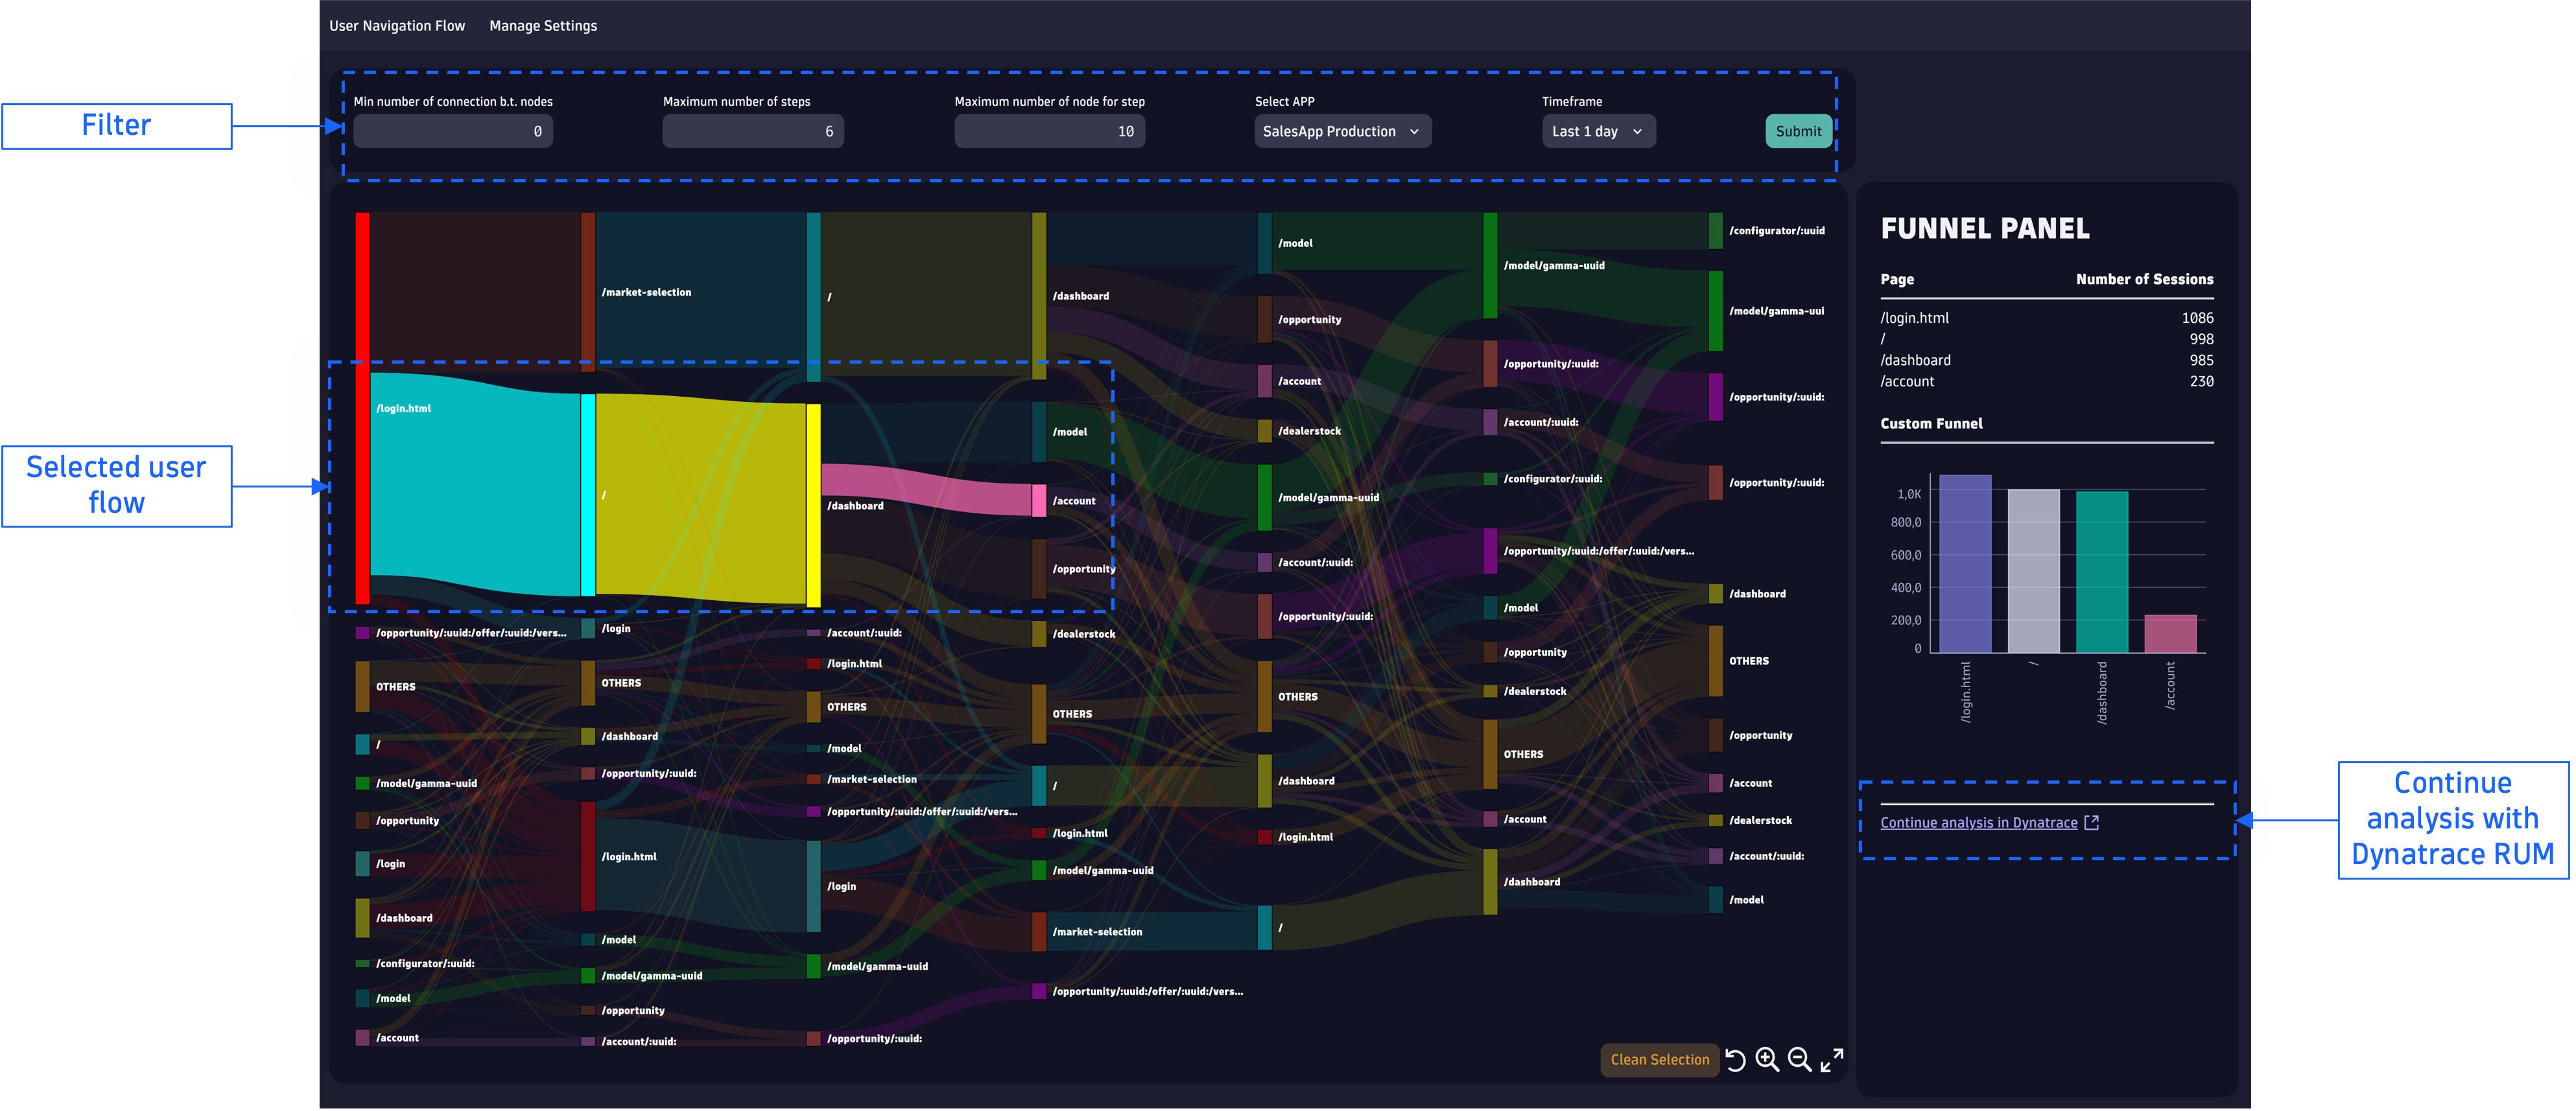
Custom visualization of user flows
Another example comes from one of our partners, Spindox, who created a custom visualization of user flows to replace an incumbent point solution for one of their customers. Using Dynatrace AppEngine, Spindox was able to implement funnel analytics according to the customer’s specifications, providing them with all the information they needed within a single platform.
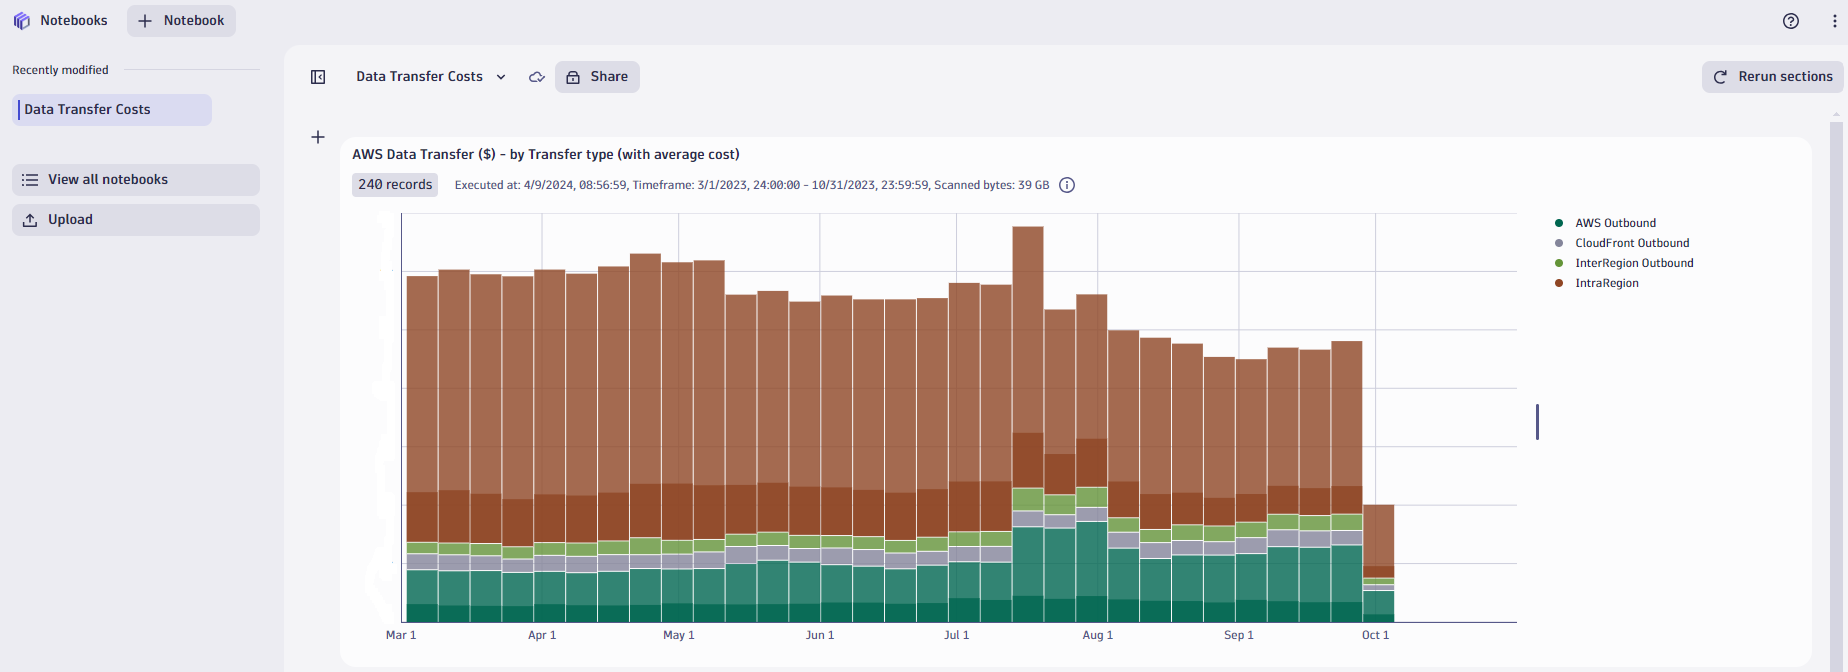
AWS cloud cost analysis
To optimize cloud spend, the FinOps team at Dynatrace built a solution that automatically ingests hourly Amazon Web Services (AWS) billing data on a daily basis as BizEvents into a Dynatrace Grail™ bucket. This allows the FinOps team to use DQL to perform analysis, such as identifying how many compute resources are running that could be covered with a savings plan. DQL also allows the team to identify spikes and anomalies in their daily cloud costs. The Notebooks app is used to drill down into the origins of the costs, while Workflows is used for automatic alerting via Slack. Pre-built custom dashboards enable the team to share the hourly billing data with development teams, giving them insights into how architecture and design decisions drive costs.
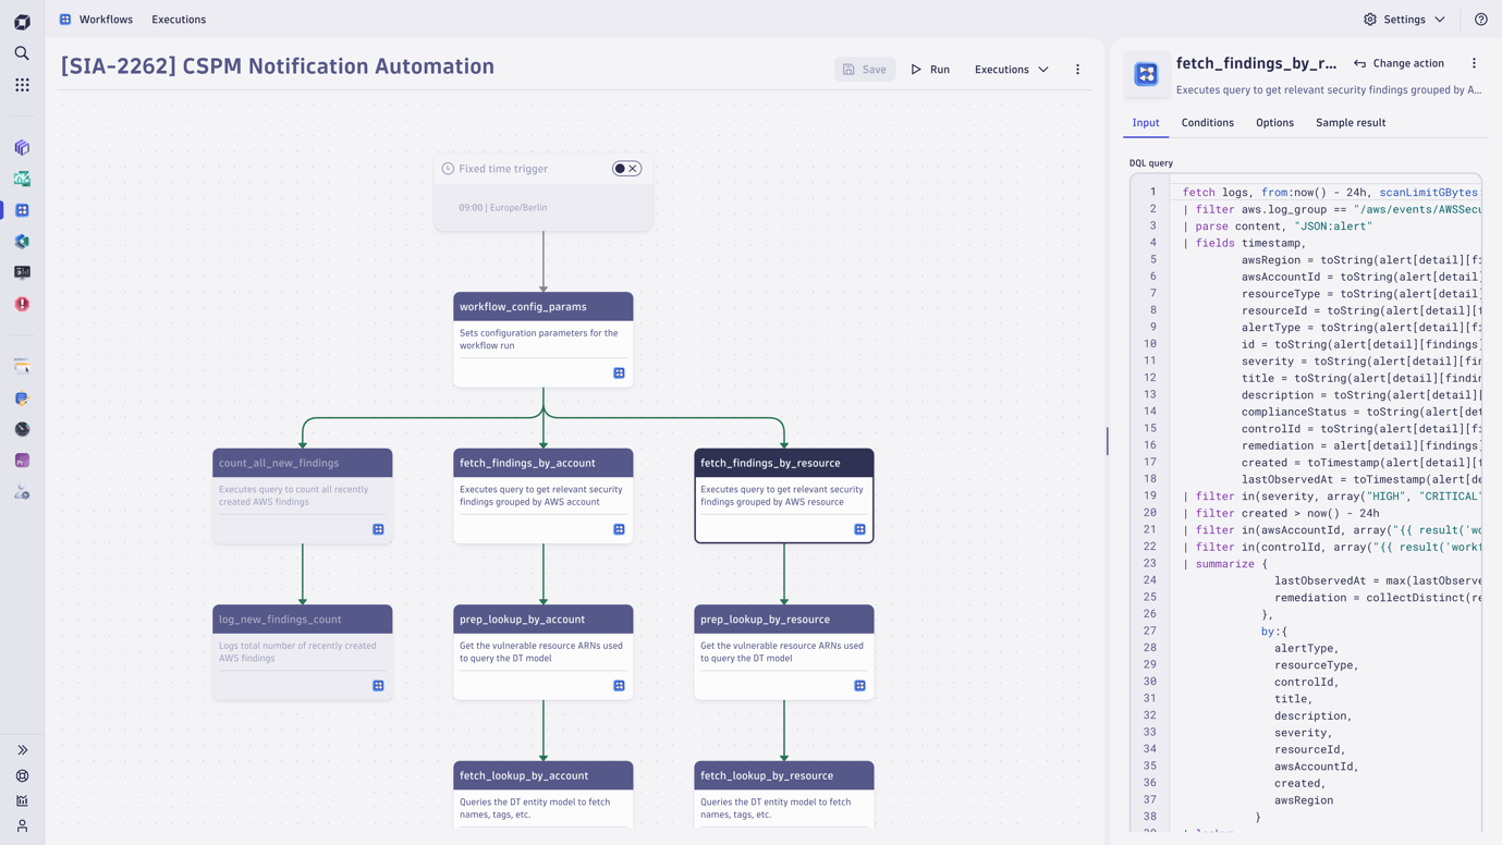
Improve cloud security posture by analyzing and auto-remediating security findings
Public cloud providers offer automated tools that detect security-related events as they occur. These events require triage, analysis, and remediation by the owners of the affected resources. However, this process can become tedious with hundreds of thousands of events flooding in daily. At Dynatrace, thousands of security tickets must be generated from these events, followed by manual remediation. Once the risk is mitigated, the resource owner must validate the resolution with the security team.
Hyperscaler security events are ingested into Grail as BizEvents. Subsequently, they undergo severity-based filtering, followed by analysis and grouping based on findings and resources. Finally, actionable Jira tickets are generated for the identified issues and assigned to the relevant owners for remediation.
The possibilities are boundless
As these examples demonstrate, the possibilities are boundless, and we’ve seen many more use cases shared by our customers and partners:
- File transfer monitoring: When migrating files from one server to another, know when a file arrives, leaves, is early, late, or missing. Use Dynatrace as a single source of truth to identify missing files immediately and take corrective measures.
- Industry software monitoring: Import telemetry data emitted by industry vertical enterprise apps (such as Temenos for banking) and build a custom app to analyze and enrich the data to trigger automated actions.
- Problem enrichment: Enhance Dynatrace-detected problems with external data. For instance, when Dynatrace identifies an issue, you can pinpoint the impacted customers using Salesforce data.
- GitHub actions profiler: Analyze data generated by GitHub action workflows and get insights into their performance and efficiency.
- Business process monitoring: Create custom dashboards for business process monitoring and trigger automated remediation actions.
Remember, as an open and extensible platform, Dynatrace doesn’t confine you to pre-defined use cases. We equip you with the necessary tools and support to extend Dynatrace by leveraging AppEngine, AutomationEngine, Davis AI, Dashboards, and more. Alternatively, you can collaborate with our AppEngine-certified partners to bring your custom use case to the Dynatrace platform.


Looking for answers?
Start a new discussion or ask for help in our Q&A forum.
Go to forum