
As agentic AI becomes mission-critical, systems that reason, act, and self-optimize introduce new operational challenges. Their dynamic and non-deterministic behavior makes them difficult to debug, they can drive unexpected cost spikes, and they inherently lack the auditability required for reliable, enterprise-grade use. Today, we’re excited to announce expanded support for leading agentic frameworks and protocols, along with a new dedicated AI Observability app. With this support, you can build, run, and debug agentic AI applications with confidence across AWS, Azure, and Google Cloud.
What’s new: Broader agentic technology support
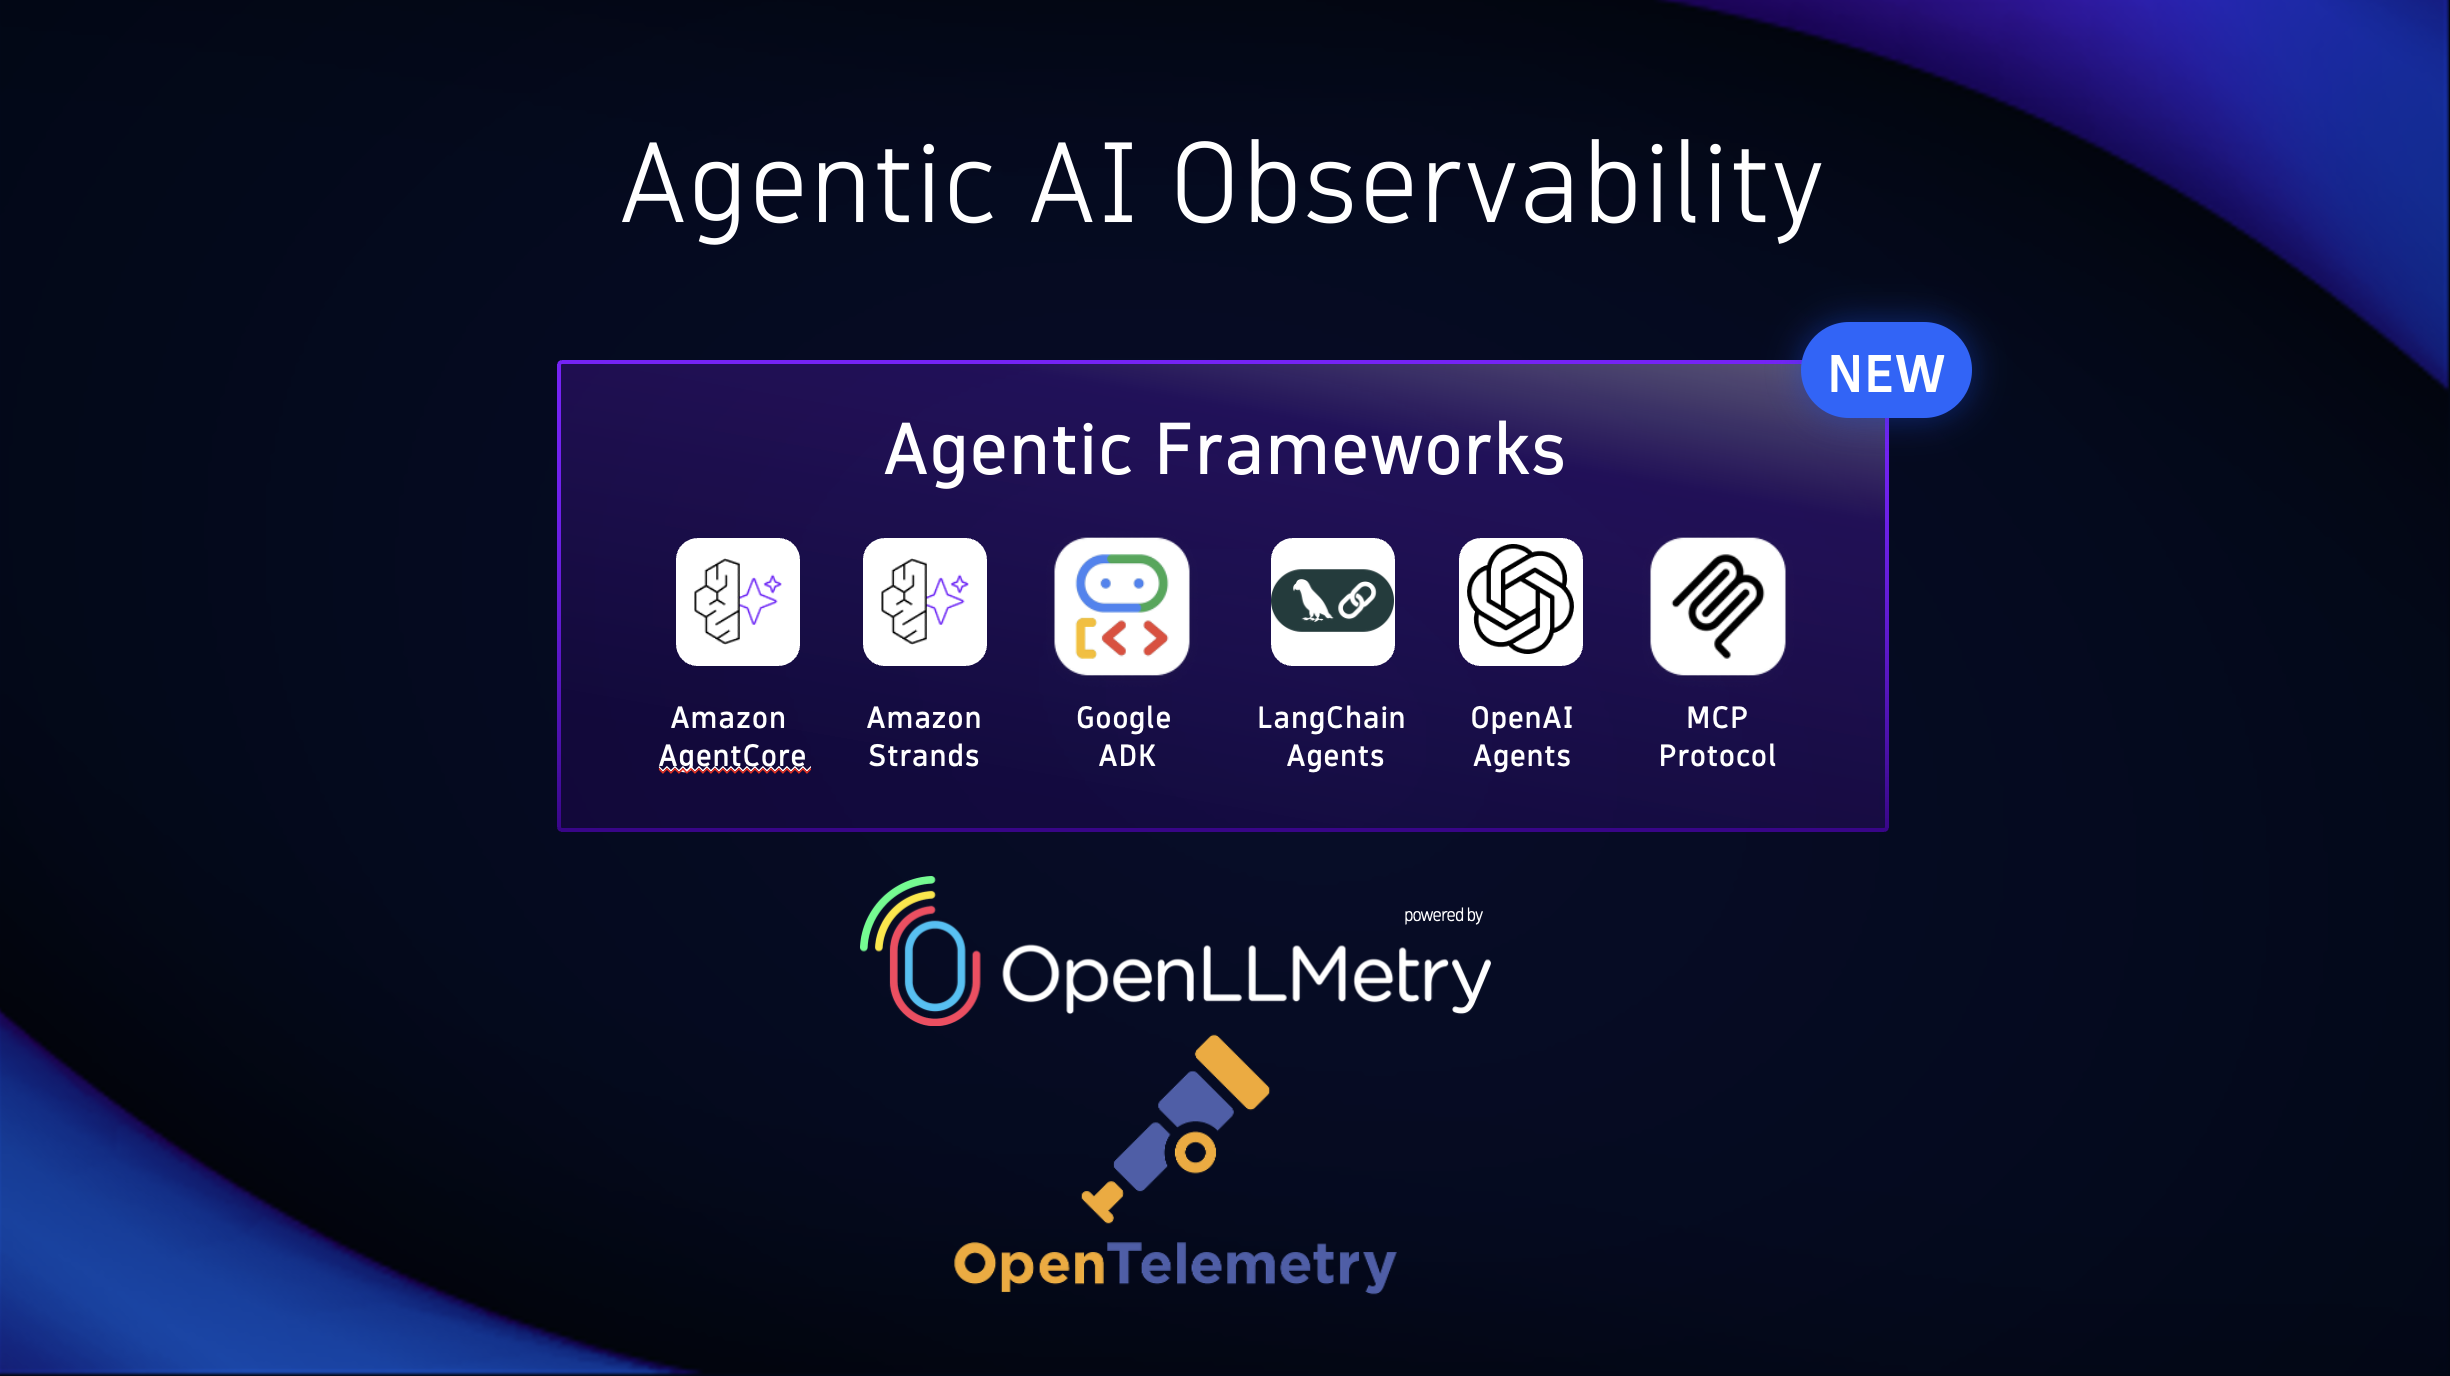
Dynatrace supports a broad and rapidly growing ecosystem of agentic AI frameworks and protocols, unifying telemetry from these frameworks via OpenTelemetry and OpenLLMetry into a single, correlated observability model, delivering end‑to‑end visibility across clouds, models, tools, and agents from one platform.
- Amazon Bedrock AgentCore – Dynatrace offers observability for Amazon Bedrock AgentCore agents by collecting metrics such as token usage, model behavior, latency, and errors. This integration provides unified tracing, cost, performance, and guardrail monitoring, along with ready-made dashboards and intelligent anomaly detection and forecasting, helping teams quickly and effectively monitor, troubleshoot, and optimize complex autonomous agent workflows.
- Amazon Bedrock Strands – Dynatrace supports the Amazon Bedrock Strands Agents SDK, enabling comprehensive visibility into agentic AI systems. By instrumenting Strands-based AI agents with Dynatrace, organizations can monitor agent behavior, tool usage, and dependencies end to end. This helps ensure performance, reliability, and operational insight across distributed environments, supporting the confident development and operation of agentic AI use cases such as chatbots, recommendation systems, and autonomous workflows.
- LangChain Agents – Dynatrace provides observability for applications built with the LangChain framework, enabling the monitoring of performance, cost, and reliability of Large Language Model (LLM) applications and agents.
- Google Agent Development Kit (ADK) – Dynatrace provides observability for applications built with the Google Agent Development Kit (ADK), enabling visibility into agent execution, dependencies, and performance. This helps teams understand runtime behavior and maintain reliability as agent-based applications
- OpenAI Agents SDK – Dynatrace provides observability for observing applications built with the OpenAI Agents SDK, enabling monitoring of agent workflows, model interactions, latency, and errors. This supports improved operational insight, troubleshooting, and performance optimization for agentic AI applications.
- MCP AI Agent– Dynatrace provides deep visibility into AI agents communicating via the Model Context Protocol (MCP). By observing both AI agents and MCP servers, organizations gain end-to-end insight into execution flows through tracing, enabling data-driven decisions, performance and cost optimization, and governance for complex agent workflows.
This agentic coverage is on top of the 40+ LLM technologies that Dynatrace already supports, including OpenAI, Amazon Bedrock, Google Gemini and Vertex, Anthropic, LangChain, NVIDIA, and more.
We’re working closely across AWS, Microsoft Azure, and Google Cloud ecosystems to ensure you have consistent, enterprise‑grade observability for your multi‑AI and multi‑cloud applications.
See it in action in the new AI Observability experience
The AI Observability app is now Generally Available, delivering a purpose-built experience for observing AI workloads end-to-end from agents and LLMs to orchestration layers, emerging protocols, and tools. It gives engineering teams deep, production-ready visibility into how AI systems behave in real time, allowing them to validate changes faster, reduce risk, and confidently ship AI-powered features at scale.
Unlike generic observability views, the AI Observability app is designed specifically for agentic and LLM-driven systems, making it easy to understand complex multi-step interactions, reason about cost and performance trade-offs, and troubleshoot issues across models, tools, and dependencies.
Key capabilities
- End‑to‑end observability for agentic AI
- Monitor agent interactions, tool usage, dependencies, latency, and reliability
- Track token consumption, cost trends, and caching impact
- Tracing and debugging for complex flows
- Follow prompts, tool calls, and model invocations from the initial request to the final response
- Jump from high‑level health to prompt‑level traces in a couple of clicks
- Actionable insights at scale
- Rapid A/B testing across model and prompt variants for faster validation
- Identify bottlenecks and optimize resource utilization with ready‑made dashboards and drill‑downs
- Security, privacy, and governance
- Enterprise‑grade controls, auditability, and policy‑aligned routing
- Guardrail outcomes (for example, toxicity, PII, or denied topics) are surfaced so you can monitor behavior and trends. (Note that guardrail enforcement occurs at the model/provider; Dynatrace captures and visualizes provider‑reported outcomes.)

Who this solution is for and why it matters
The Dynatrace AI Observability solution is for enterprise teams, including developers, DevOps, SREs, and business leaders who need deep, real-time insights into their cloud native AI-powered applications and customer experience in a single unified view.
Who benefits the most from this solution?
- AI Engineering and Data Science: This group includes practitioners who develop and optimize models. They use LLM observability to track metrics related to model performance, such as identifying hallucinations and biases, validating changes, and improving prompt engineering practices.
- Software Developers: These individuals benefit from observability by gaining insights into application-level performance, which helps them debug and improve overall code quality. Observability tools allow for faster iteration in development cycles.
- Site Reliability Engineers (SRE): These teams ensure the reliability and performance of AI applications in production environments. They use observability to identify system-level bottlenecks and failures, and to respond swiftly to operational challenges.
- Application Security Teams: Although not traditionally the primary users, security teams can leverage AI observability to identify and mitigate emerging threats specific to AI applications, such as prompt-injection attacks and data leaks.
- Compliance and Governance Teams: Responsible for ensuring adherence to regulatory requirements and internal policies, these teams rely on observability to audit model behavior and to identify potential biases or harmful outputs.
What’s next: Agent topology view with Smartscape
We’re committed to further enhancing these capabilities. As agentic systems evolve into distributed networks of models, tools, and decisions, observability must move beyond traces and metrics. Our next focus is the Agentic Topology View, bringing Smartscape-grade visualization to agent execution flows so teams can see how agents interact, invoke tools, propagate errors, and improve performance end to end.
This agentic topology becomes the foundation for a deeper developer experience by connecting production telemetry with prompt management and evaluation workflows. By unifying agent topology, prompt lifecycle, and LLM-as-judge scoring in a single system, we’re helping teams systematically improve the reliability, performance, and quality of agentic AI at enterprise scale.

Get started today
- Install the AI Observability app from Dynatrace Hub
- Instrument your agents via OpenTelemetry/OpenLLMetry
- Start tracing prompts, tool calls, and model invocations—and turn insights into action
Want to “kick the tires” with some example code? Let’s make agentic AI observable, governable, and reliably fast.

Looking for answers?
Start a new discussion or ask for help in our Q&A forum.
Go to forum