

How Dynatrace and an AI coding assistant can bridge the gap between "something is slow" and "here is the fix.” Why this matters for getting AI workloads to production.
AI-powered development is accelerating fast. Developers are asking their AI assistants to write code, explain architecture, and debug problems in real time. It is not uncommon that the AI sees the code but not what the code is actually doing in production.
That gap can be expensive: Slow queries, CPU saturation, cascading latency, valuable tokens being consumed. These are the issues that slow down AI workloads on their way to production, and they are rarely obvious from the code alone.
The Dynatrace MCP Server is designed to close that gap. By connecting an AI coding assistant directly to live Dynatrace observability data, developers can ask questions in plain language about their running systems and get answers backed by data. This can yield a dramatically shorter path from symptom to fix.
Also, Dynatrace publishes a collection of skills to teach coding agents how to collaborate with the platform. These skills are prepackaged instructions that teach an AI assistant how to effectively query observability data, which entity types are available, how to correlate symptoms to lines of code, and how to verify fixes work. The MCP server gives the AI agent access, and the skills give it judgement.
Here is what that looks like in practice:
The setup: A multi-service application and a performance problem
The example is a multi-tier case management application: a Node.js gateway, a case-service backed by PostgreSQL, and a document-service. It is a representative pattern for the kind of workloads that organizations are now accelerating with AI.
The symptoms were clear in Dynatrace: the host CPU was pegged at 100%, and average response time on case-service had climbed to ~89 seconds. A response time degradation problem was detected by Dynatrace, with the casemgt database as the root cause. The question was simple: why? And more importantly, where in the code is the slowness coming from?
Asking the right questions in plain language
Using the Dynatrace MCP Server connected to a AI coding agent, the investigation started with a natural language question:
“Show me the top 5 methods that are the most impactful to the casemgt database in my Dynatrace environment.”
The MCP Server queried Dynatrace in the background; discovering the database entity, traversing the application, and surfaced a ranked list of recommendations. No console. No dashboard navigation. No query languages.
The top offenders were immediately clear:
- A search query forcing a full table scan on every call
- A service endpoint firing four sequential full-table aggregation queries per request
- A complex multi-aggregate stats query with date arithmetic across every row in the table
- A paginated list query that prevented index use
- a SELECT hitting the database every two seconds per service
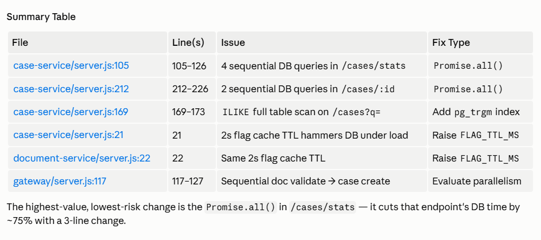
The same question was then asked about case-service itself, and the Dynatrace MCP Server mapped the 9 service endpoints to the telemetry in Dynatrace, correlating the code paths with the measured response times.
From telemetry to code: Specific lines, specific fixes
This is where the combination can be genuinely powerful. With Dynatrace MCP providing the production telemetry, and the coding agent reading the application source code in the same conversation, the AI was able to map observed performance problems directly to specific lines:
Fix 1: Parallelize the four sequential database queries
The /cases/stats endpoint runs four independent aggregation queries back-to-back. Every time the app’s dashboard is refreshed, all four are fired sequentially, so response time is the sum of all four. A solution provided by the AI coding agent was to fire these requests in parallel. This would cut the requests’ response time by ~75%:
// Before — sequential
const byStatus   = await dbQuery('SELECT status, count(*)...');
const byType     = await dbQuery('SELECT case_type, count(*)...');

// After — parallel
const [byStatus, byType, byPriority, totals] = await Promise.all([
  dbQuery('SELECT status, count(*)...'),
  dbQuery('SELECT case_type, count(*)...'),
  ...
]);
Fix 2 : Add trigram indexes for ILIKE search
Every time a search is performed in the app, there is a request that triggers an expensive database statement. PostgreSQL cannot use a standard B-tree index for ILIKE, so it reads every row in the cases table on every search. An index makes these fast without changing application code:
CREATE EXTENSION IF NOT EXISTS pg_trgm;
CREATE INDEX CONCURRENTLY idx_cases_citizen_name_trgm ON cases USING gin (citizen_name gin_trgm_ops);
CREATE INDEX CONCURRENTLY idx_cases_case_number_trgm  ON cases USING gin (case_number  gin_trgm_ops);
Root cause: Parallelization and a two-line index
“Why is my casemgt database process consuming so much CPU?”
| Process | CPU Usage |
| casemgt (database) | ~67% |
| case-service | ~2.5% |
| load generator | ~0.8% |
| document-service | ~0.36% |
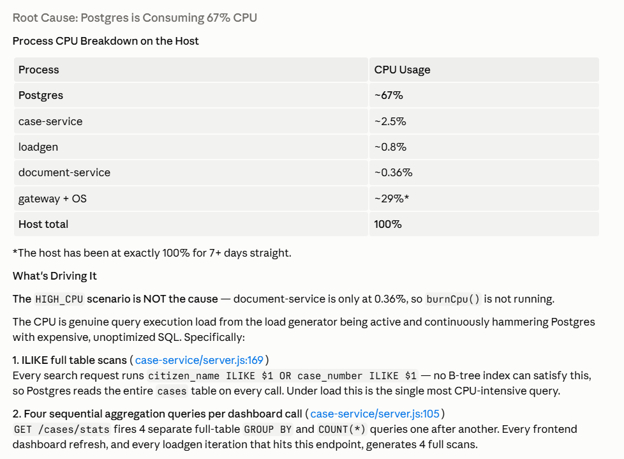
The expensive database statements were clearly the outlier. The root cause was query execution load: the incoming traffic was continuously executing expensive, unoptimized SQL. Specifically, every search request issued by the application ran an ILIKE pattern match. The database has no choice but to read every row in the cases table on every call. Under sustained load, this single query pattern was responsible for most of the database’s CPU consumption.
In this case the AI identified the exact line in code (case-service/server.js:169), explained why the index could not be used, and recommended the highest-impact fix: a trigram index via the pg_trgm extension. No application code changes required, just two SQL statements run against the database:
CREATE EXTENSION IF NOT EXISTS pg_trgm;
CREATE INDEX CONCURRENTLY idx_cases_citizen_name_trgm
  ON cases USING gin (citizen_name gin_trgm_ops);
CREATE INDEX CONCURRENTLY idx_cases_case_number_trgm
  ON cases USING gin (case_number gin_trgm_ops);
This means the index builds without locking the table, and in this scenario could be run against a live database. Once in place, the database can satisfy the ILIKE pattern using the trigram index rather than a sequential scan, and database CPU drops in proportion to search traffic volume. A simple example of inefficient coding, with huge impact.
Why this matters for AI workloads
The example application is a stand-in for a pattern that is commonly used in organizations building with AI: a multi-service architecture and a performance problem that lives somewhere in the space between code and infrastructure.
What made this investigation faster was not a single platform; it was the connection between them. The Dynatrace MCP Server gave the AI coding agent access to live observability data: entity relationships, service methods, SQL statements, process CPU metrics. The coding agent brought the code reading, the reasoning across layers, and the ability to translate telemetry into specific file paths and line numbers.
Together, they collapsed what could have been a multi-hour investigation into a conversation that took minutes.
For organizations trying to move AI workloads from prototype to production, that speed is not a nice-to-have. It can be the difference between shipping and stalling.
Getting started
The Dynatrace MCP Server and skills are available today and are designed to work with any compatible AI assistant. You can connect it to your existing Dynatrace environment and start asking questions about your running systems in natural language. It can position you to:
- Discover which services and database queries are causing the most latency
- Surface process-level CPU, memory, and error data alongside your code
- Close the gap between what your AI sees in code and what is happening in production
- Move from symptom to fix faster. For any workload, including AI




Looking for answers?
Start a new discussion or ask for help in our Q&A forum.
Go to forum