

This series covers recent Dynatrace releases and updates, focusing on what’s new, what’s changed, and how these enhancements can benefit you and your organization. This edition covers the capabilities rolled out in September. If you want to see September in action, head over to our Release Radar launchpad on the Dynatrace Playground.
Trace database statements back to their callers
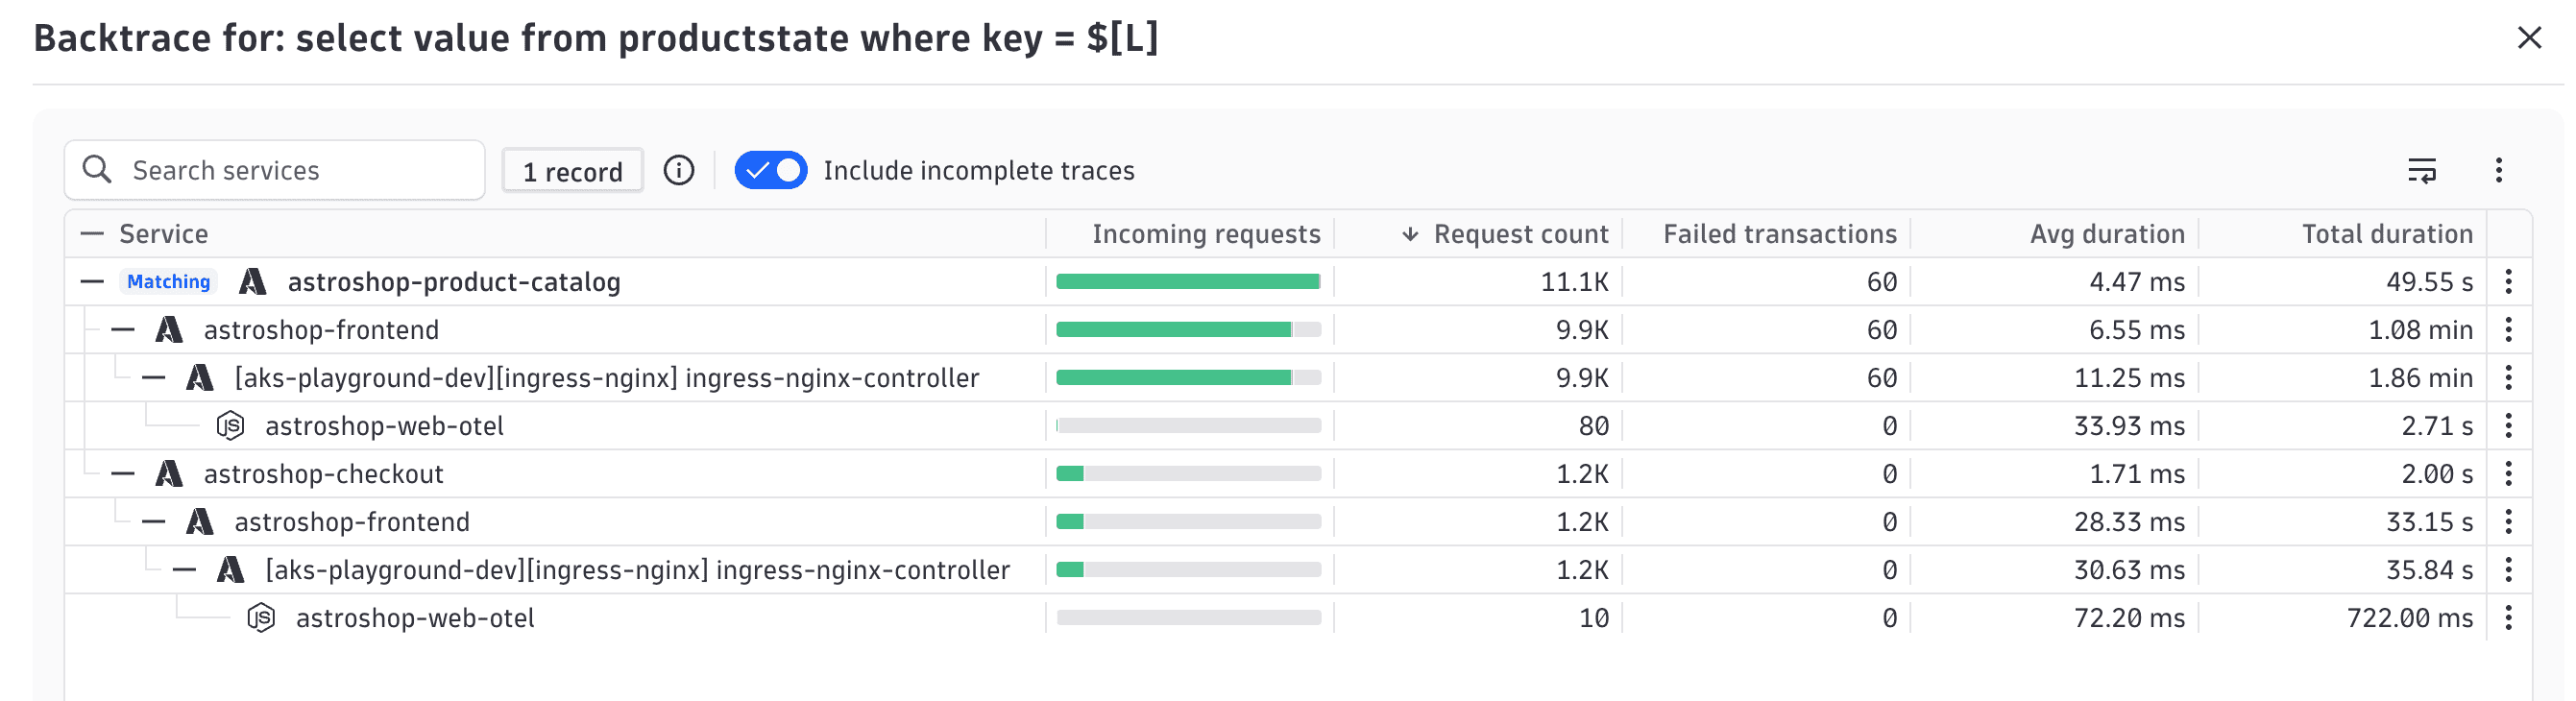
A database statement tells you what ran, but not always what triggered it. The Services app now lets you open a Service backtrace from a statement in the Database queries view to inspect the upstream call chain.
Service backtrace shows where the statement originated, how load is distributed across callers, and whether those callers have errors. Practitioners can use this information to investigate 1:n fan-out patterns, in which a single upstream call triggers multiple database executions, and the potential blast radius of a failing query.
QuickStart simplifies onboarding and connects findings to AI
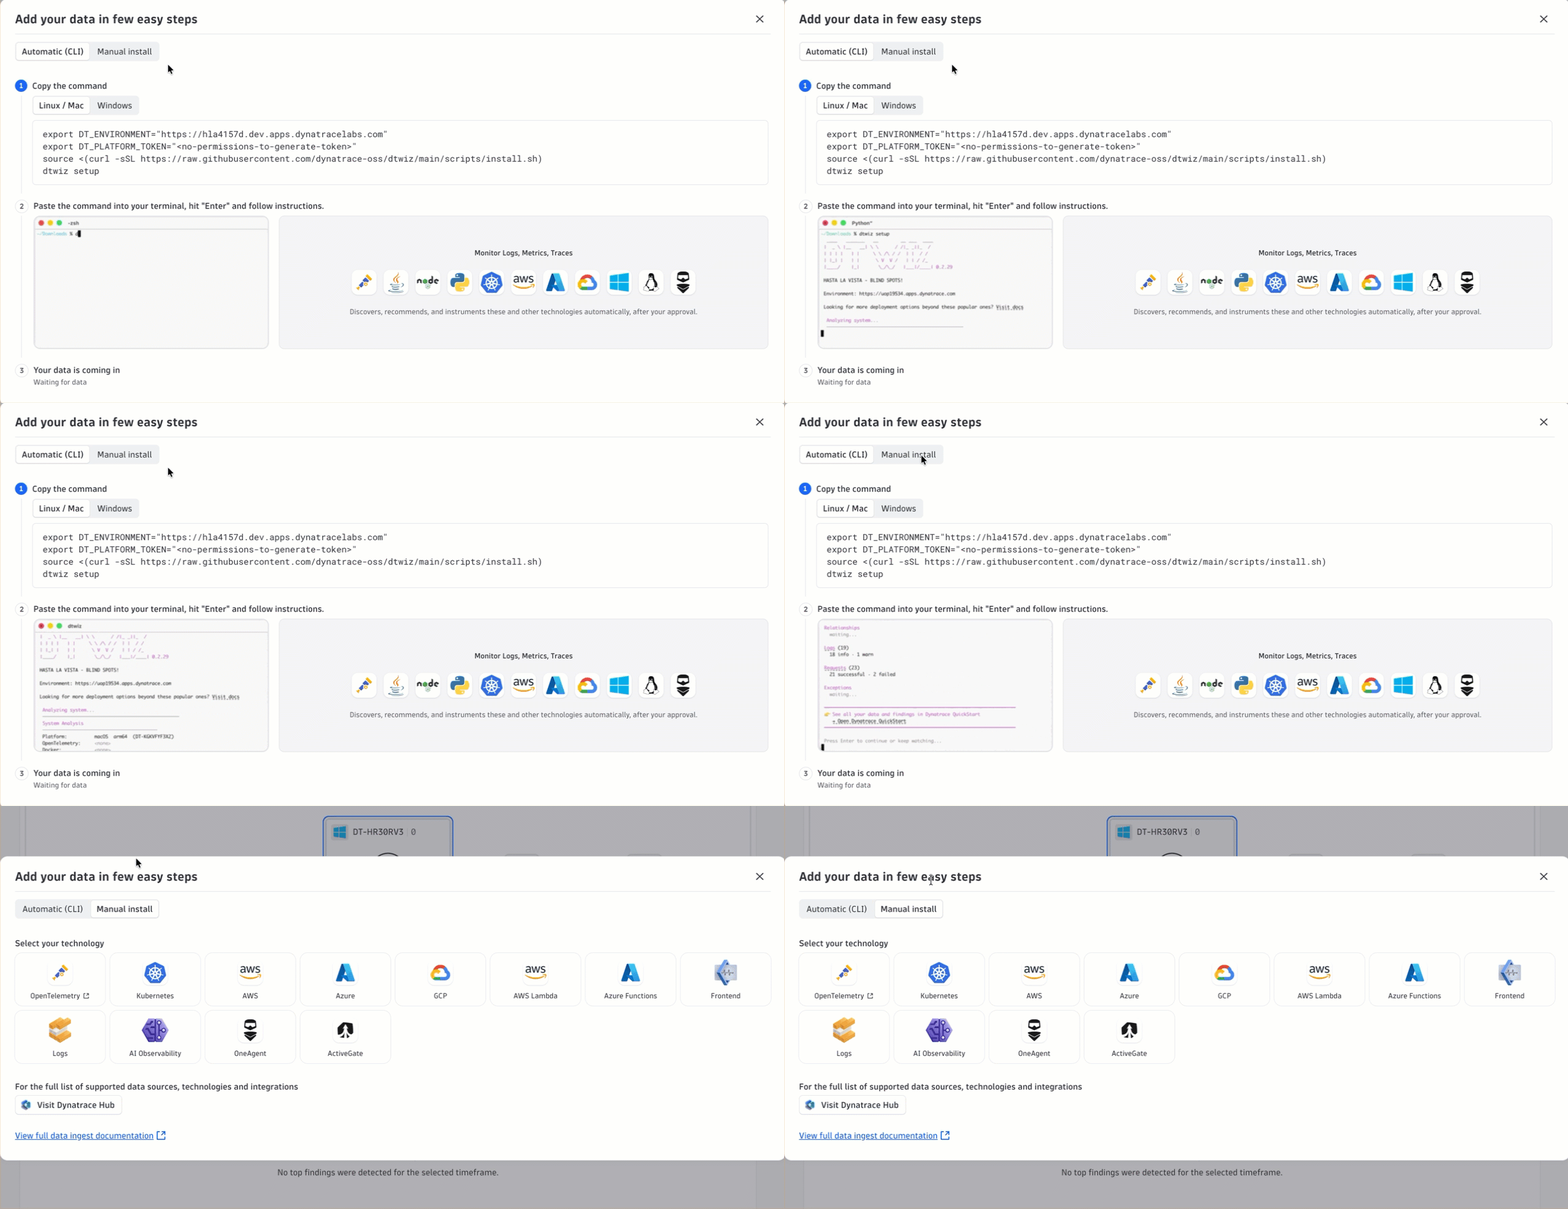
QuickStart brings setup and investigation into a more guided flow. The updated dtwiz flow provides information about the automatic onboarding configuration, while Manual install provides access to the step-by-step onboarding wizards in one place. Teams that don’t have an application ready to instrument can use the dtwiz setup path to instrument the Schnitzel demo app and generate example data.
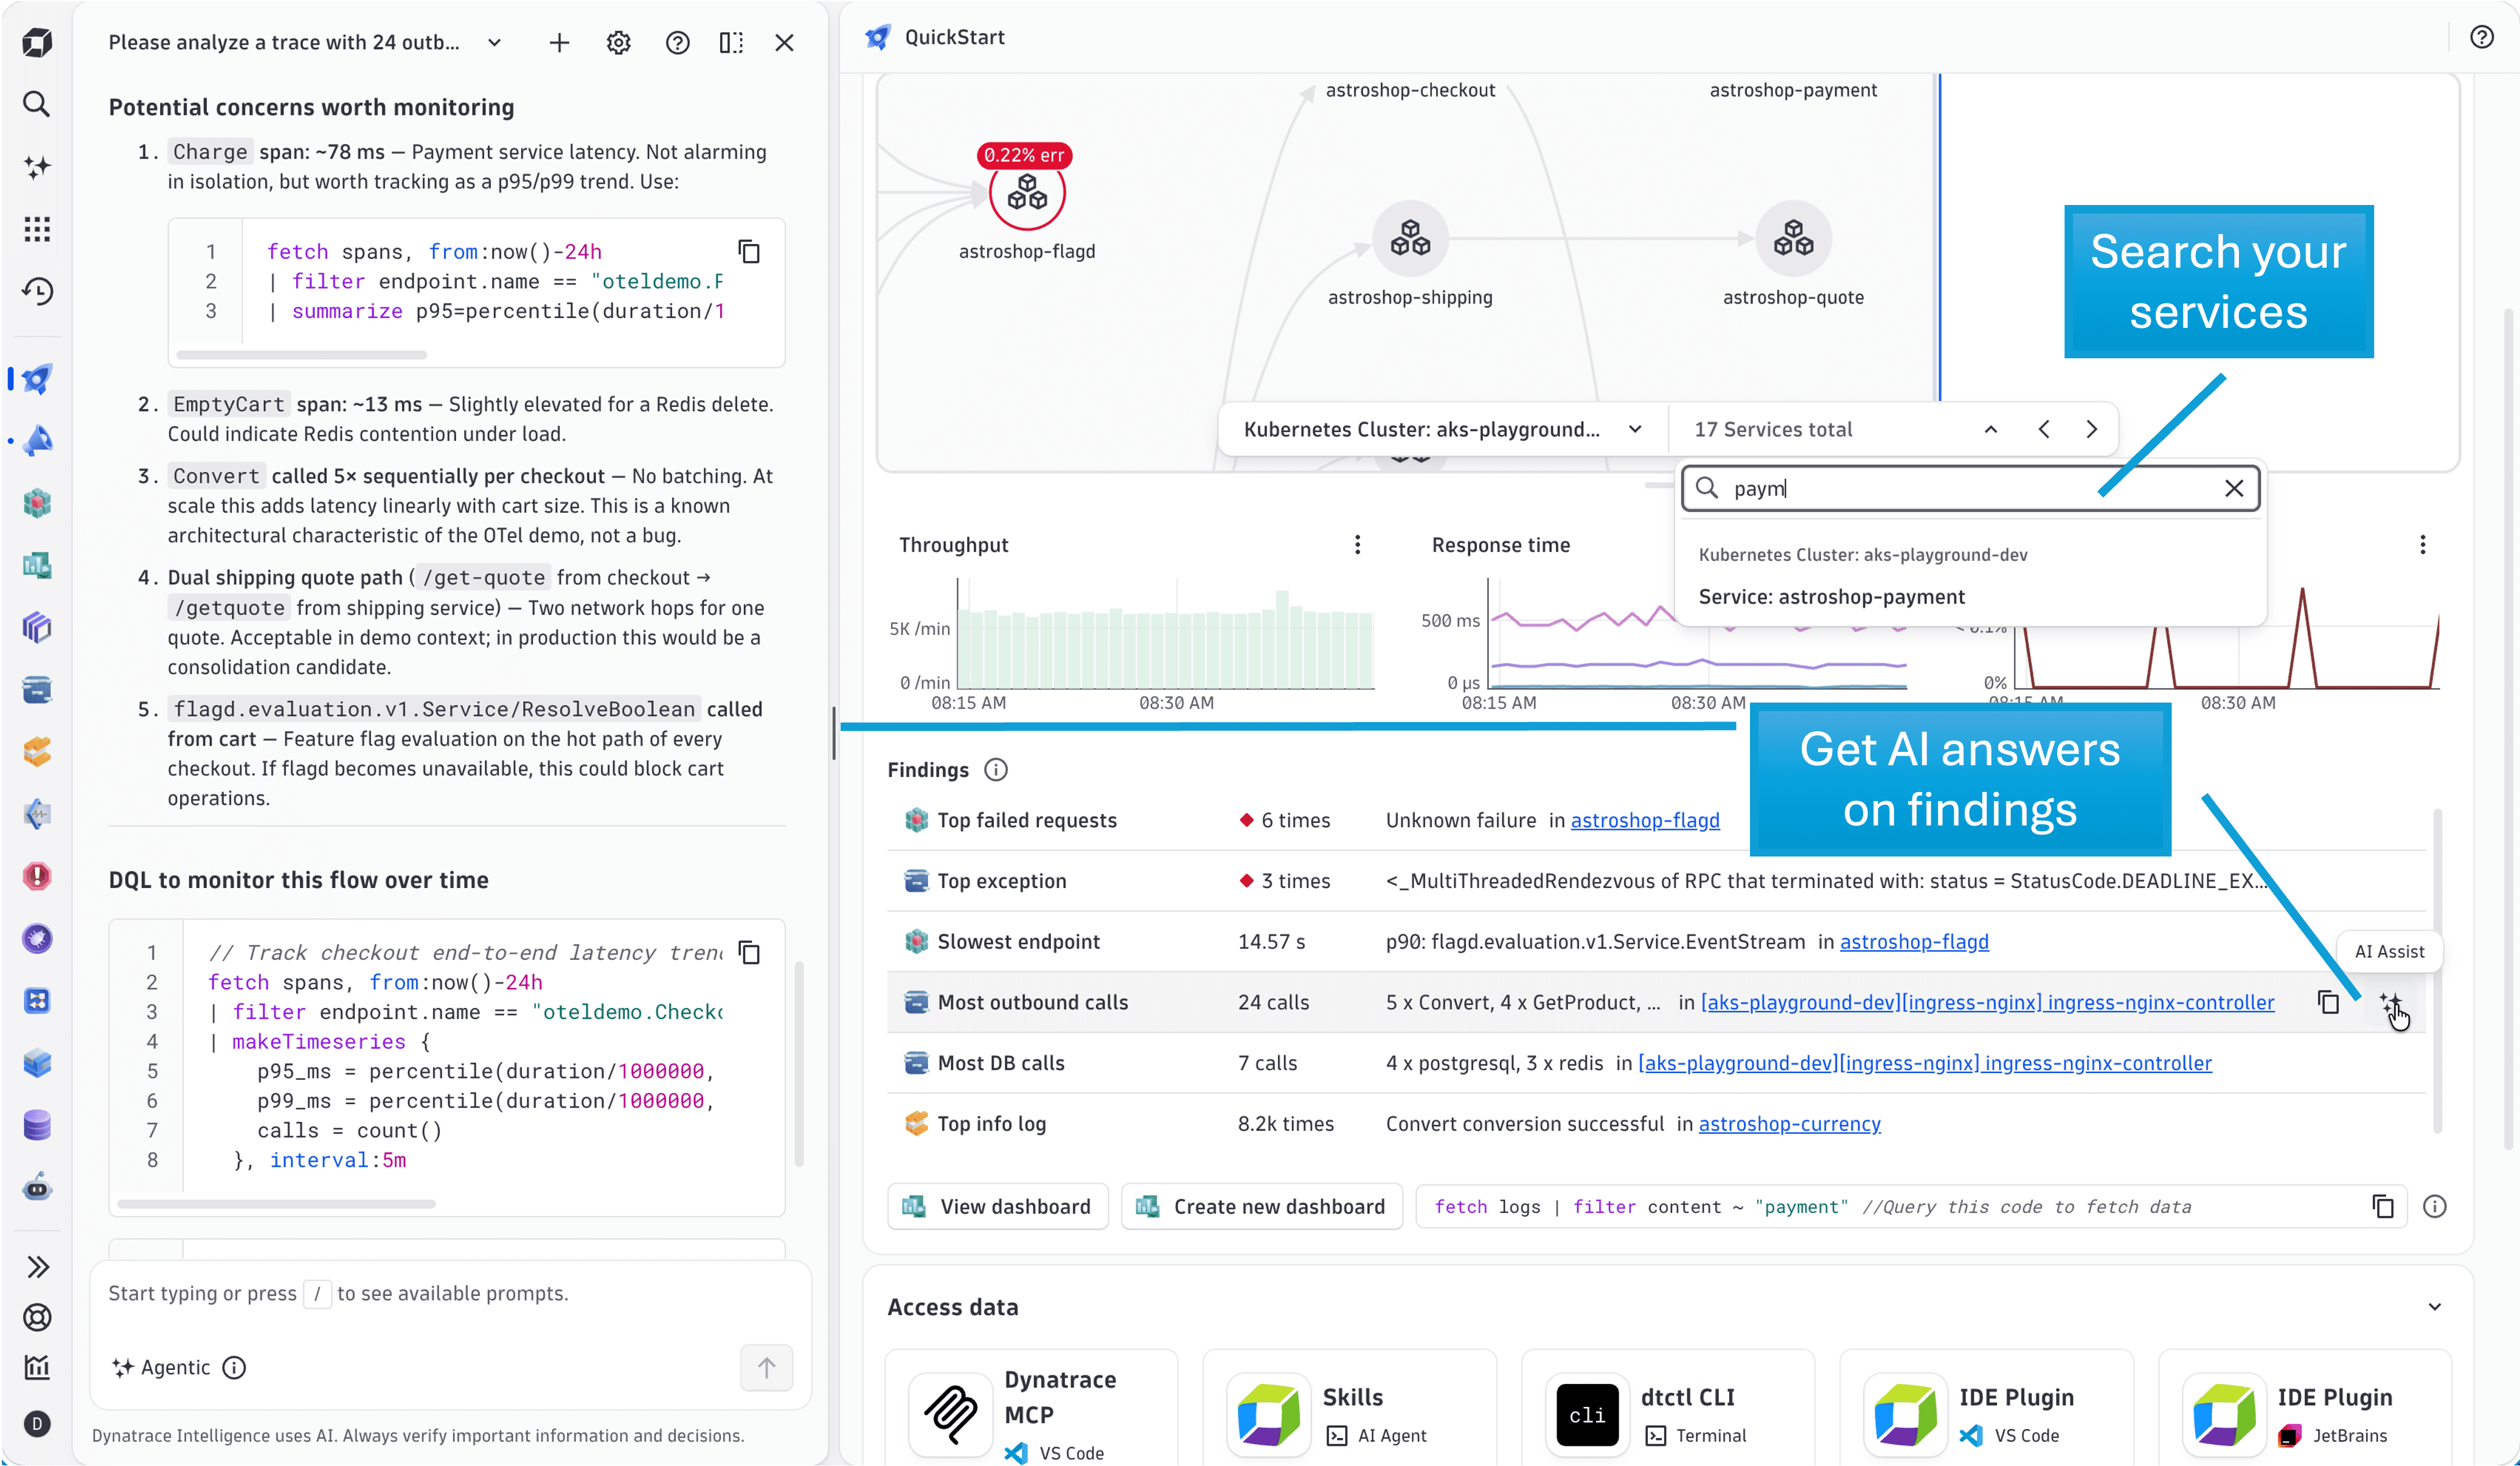
Once data is available, users can open Dynatrace Assist from a finding for AI-assisted information about that finding. QuickStart also includes topology search for finding services. The release includes updates to topology loading and chart refresh.
Investigate traces without losing your analysis context
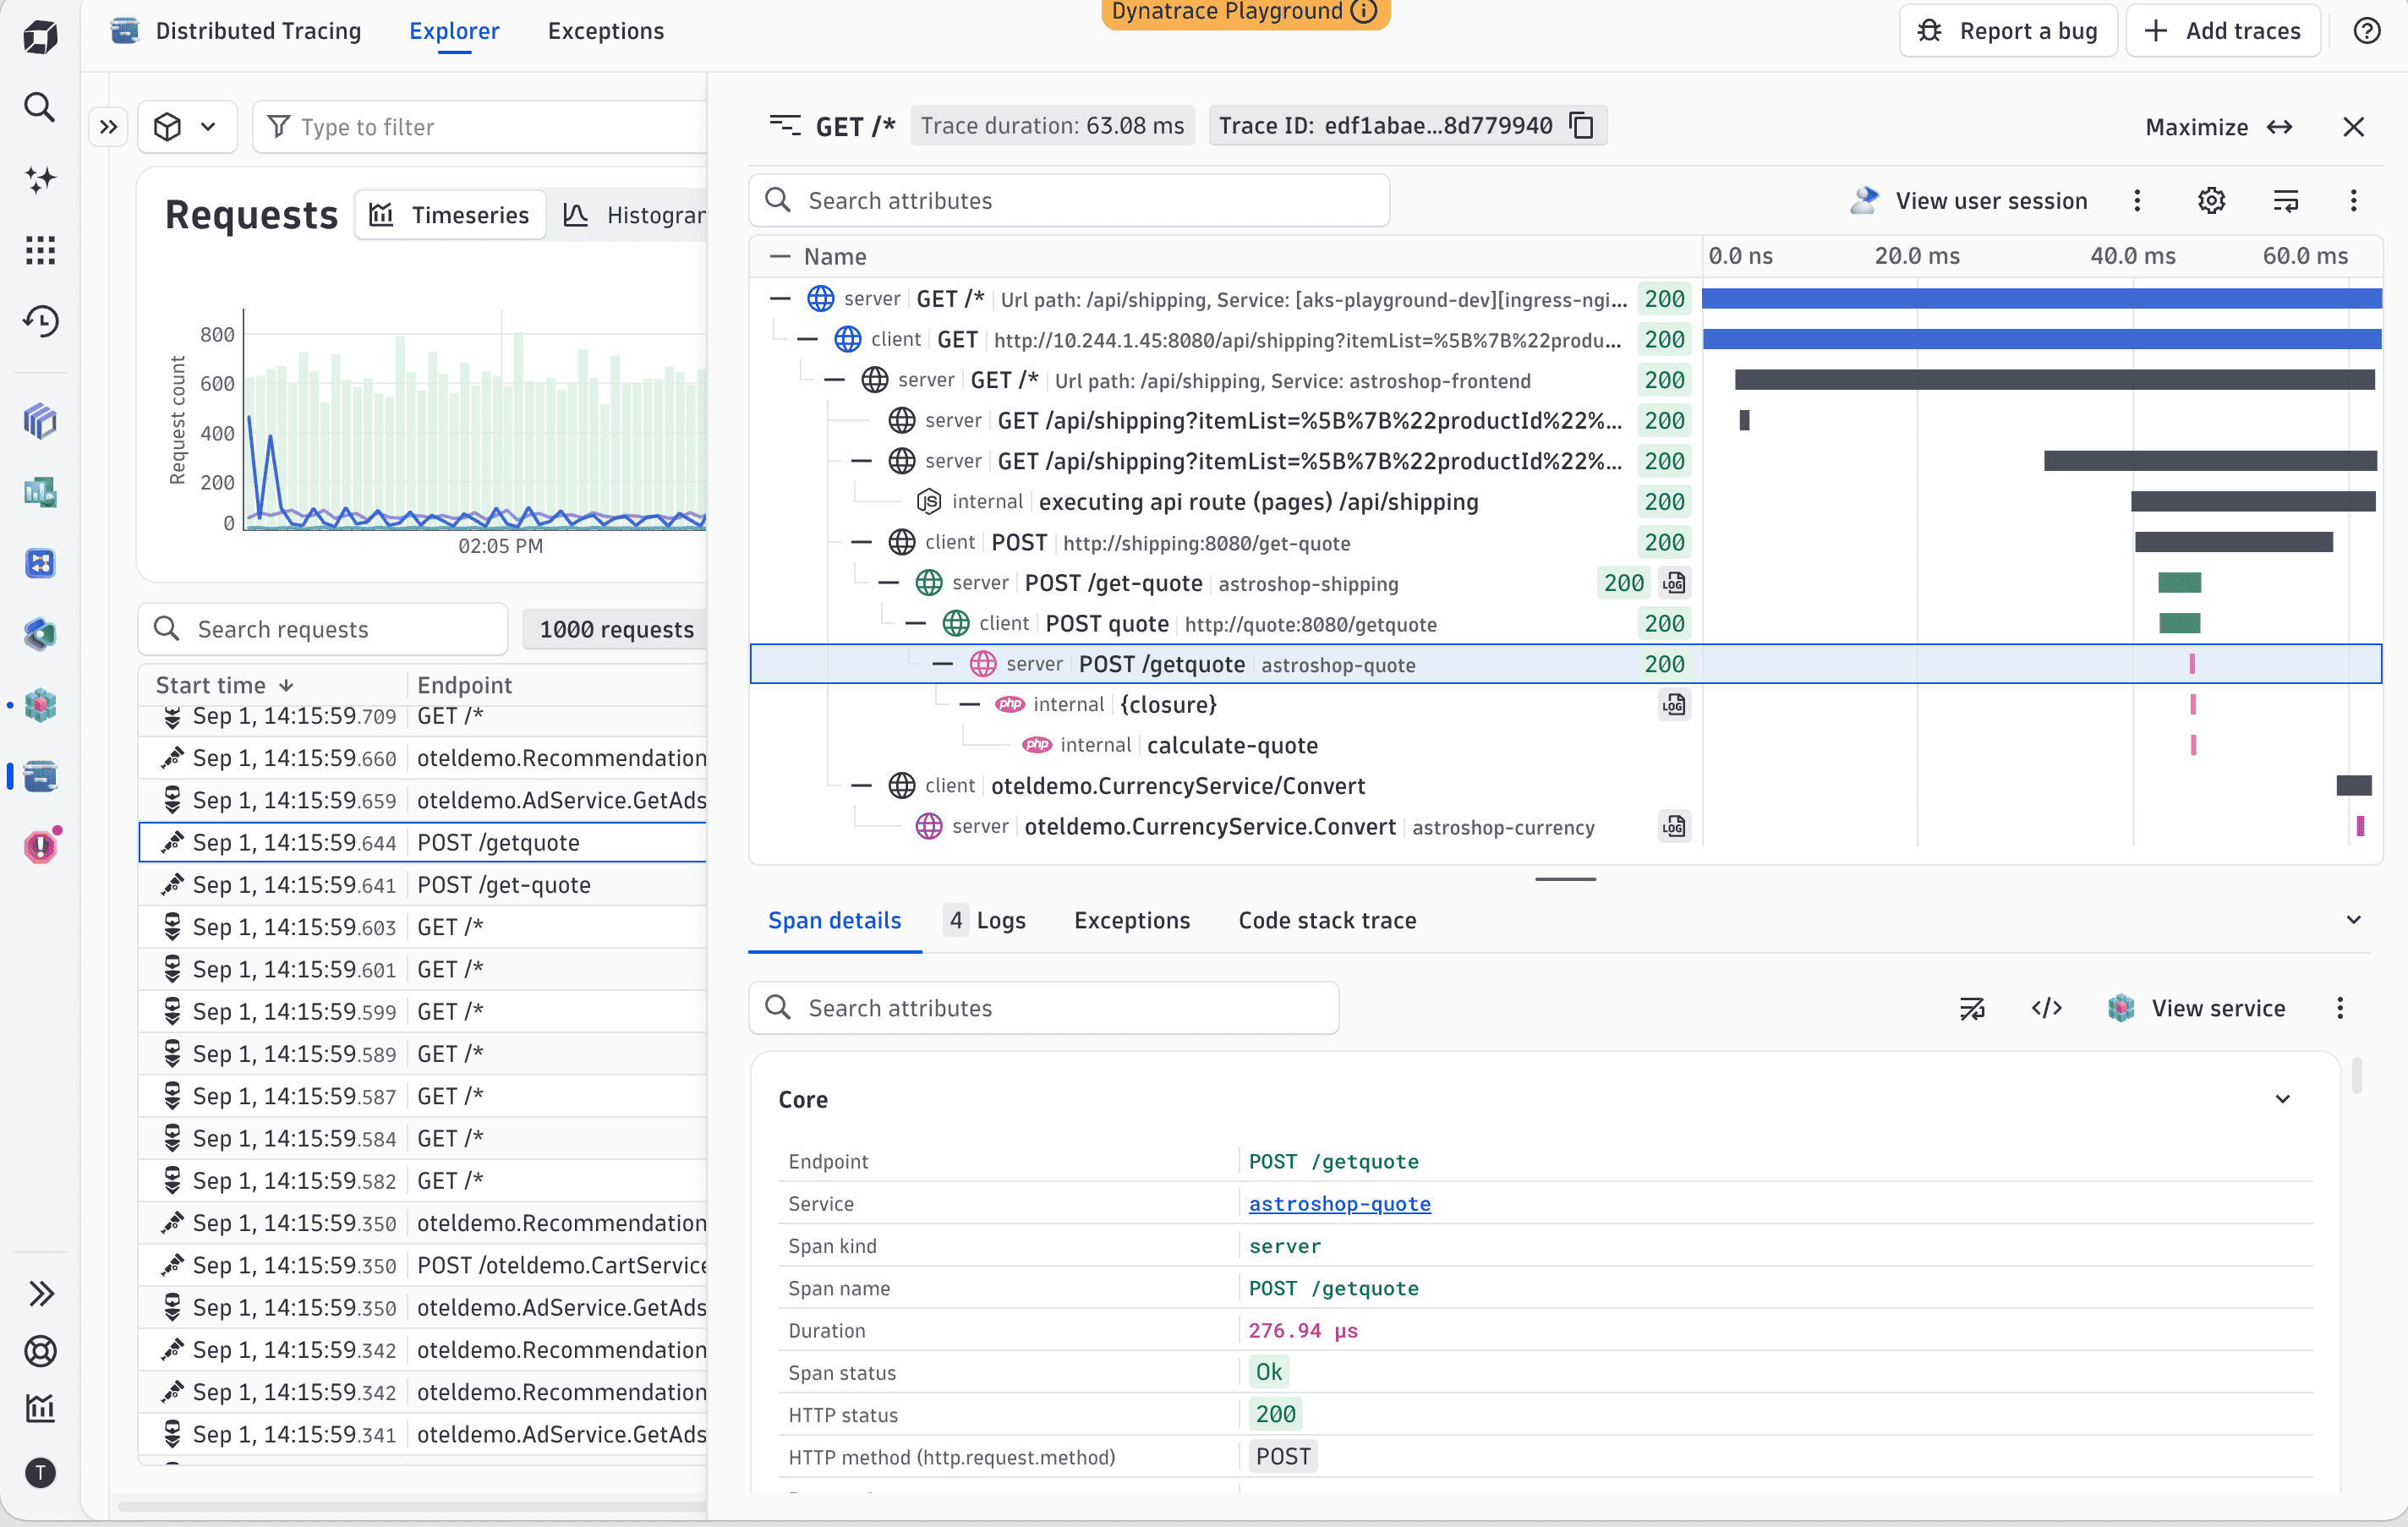
Within Distributed Tracing you can open the trace waterfall in a side overlay while keeping the original chart, filters, selection, and context available.
Onboard host monitoring in minutes with dtwiz
During OpenTelemetry Collector setup, dtwiz configures the required OpenTelemetry extension and OpenPipeline dynamic routes used for host monitoring. Host metrics can appear in Infrastructure & Operations within minutes. The updated flow is available from QuickStart under Add more data.
OpenTelemetry host monitoring joins Infrastructure & Operations
OpenTelemetry host monitoring is generally available in Infrastructure & Operations. Supported hosts monitored through an OpenTelemetry Collector appear in the Compute menu alongside OneAgent-monitored hosts, and extension-monitored technologies are available in Explorer. Primary tags replace the previous Datacenter concept for host grouping.
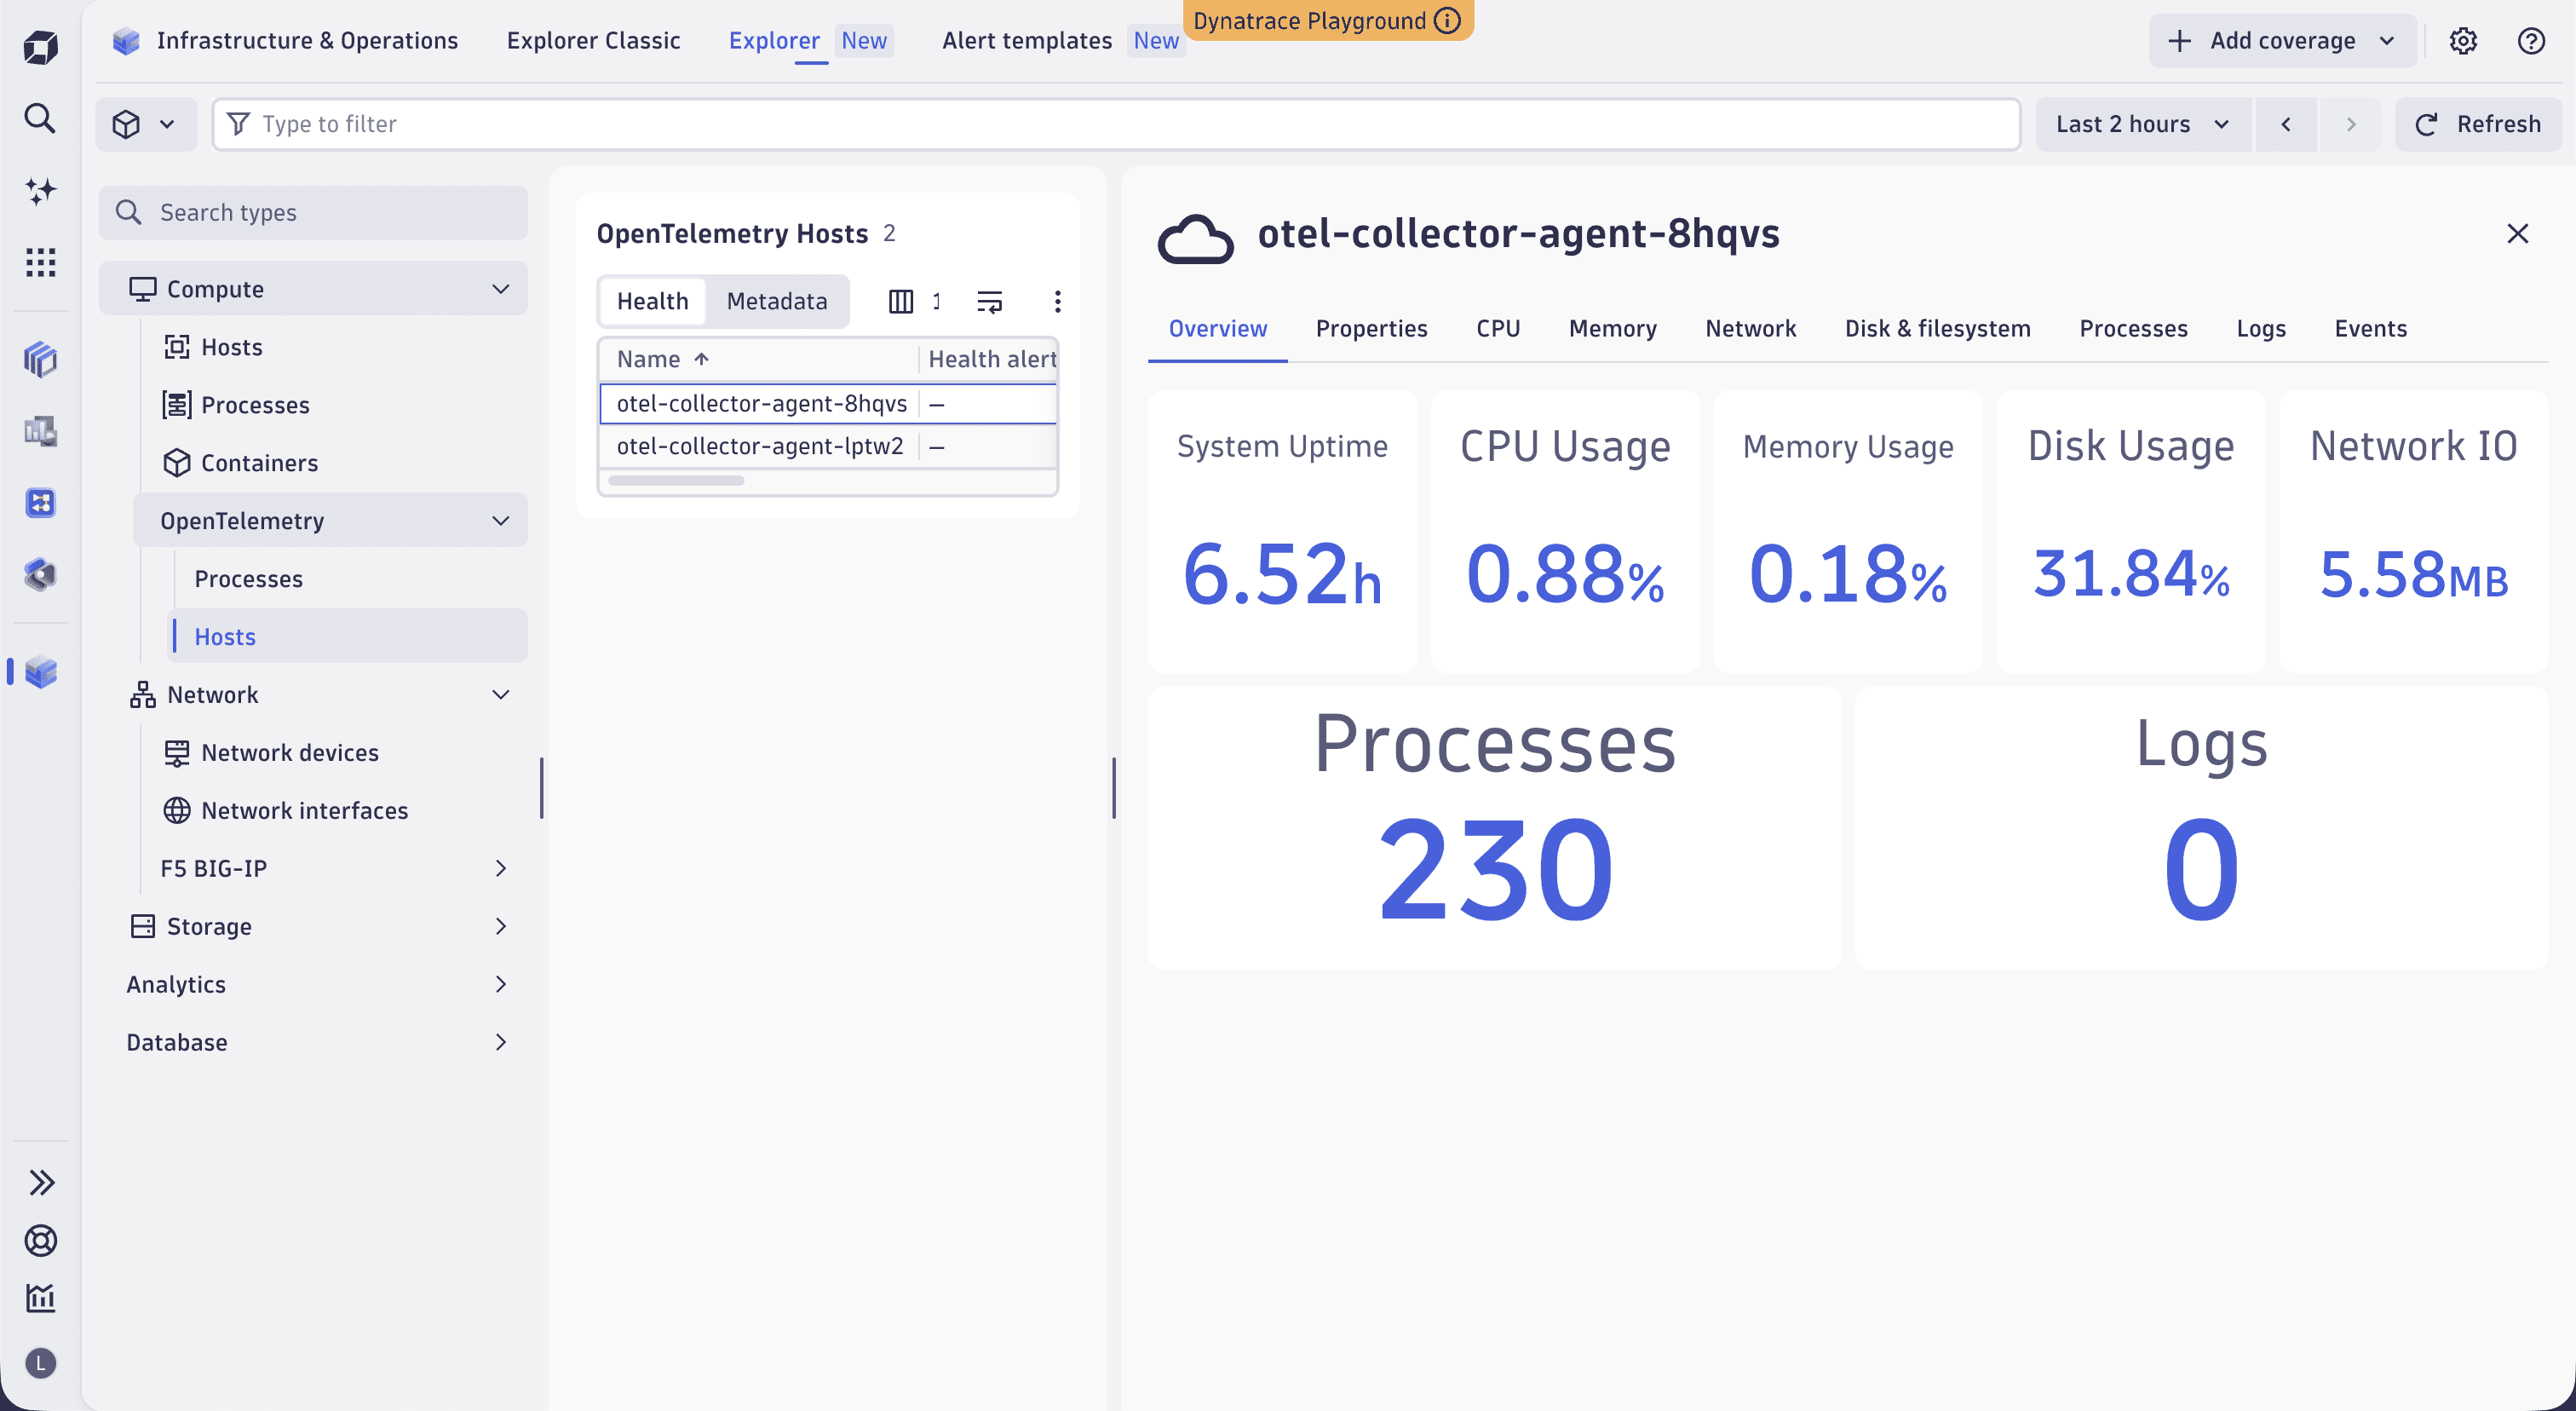
Supported OpenTelemetry-monitored hosts appear in the Infrastructure & Operations Compute menu.
Why this matters to practitioners
September’s updates add several ways to move from collected data into an investigation. Service backtrace shows the upstream callers, load, and caller errors associated with database statements, giving practitioners information they can use to investigate fan-out patterns and assess potential impact. QuickStart includes onboarding choices and service search, with access to Dynatrace Assist from findings. In Distributed Tracing, the trace side overlay keeps the original chart, filters, and selection available while a practitioner inspects an individual trace.
Host monitoring also takes fewer manual steps: dtwiz configures the OpenTelemetry extension and OpenPipeline dynamic routes used for host monitoring. Supported OpenTelemetry-monitored hosts can also appear in the Infrastructure & Operations Compute menu alongside OneAgent-monitored hosts. Together, these updates add guided onboarding, trace-context preservation, service backtrace information, and OpenTelemetry host visibility in Infrastructure & Operations.



Looking for answers?
Start a new discussion or ask for help in our Q&A forum.
Go to forum