


- Product information
- Release notes
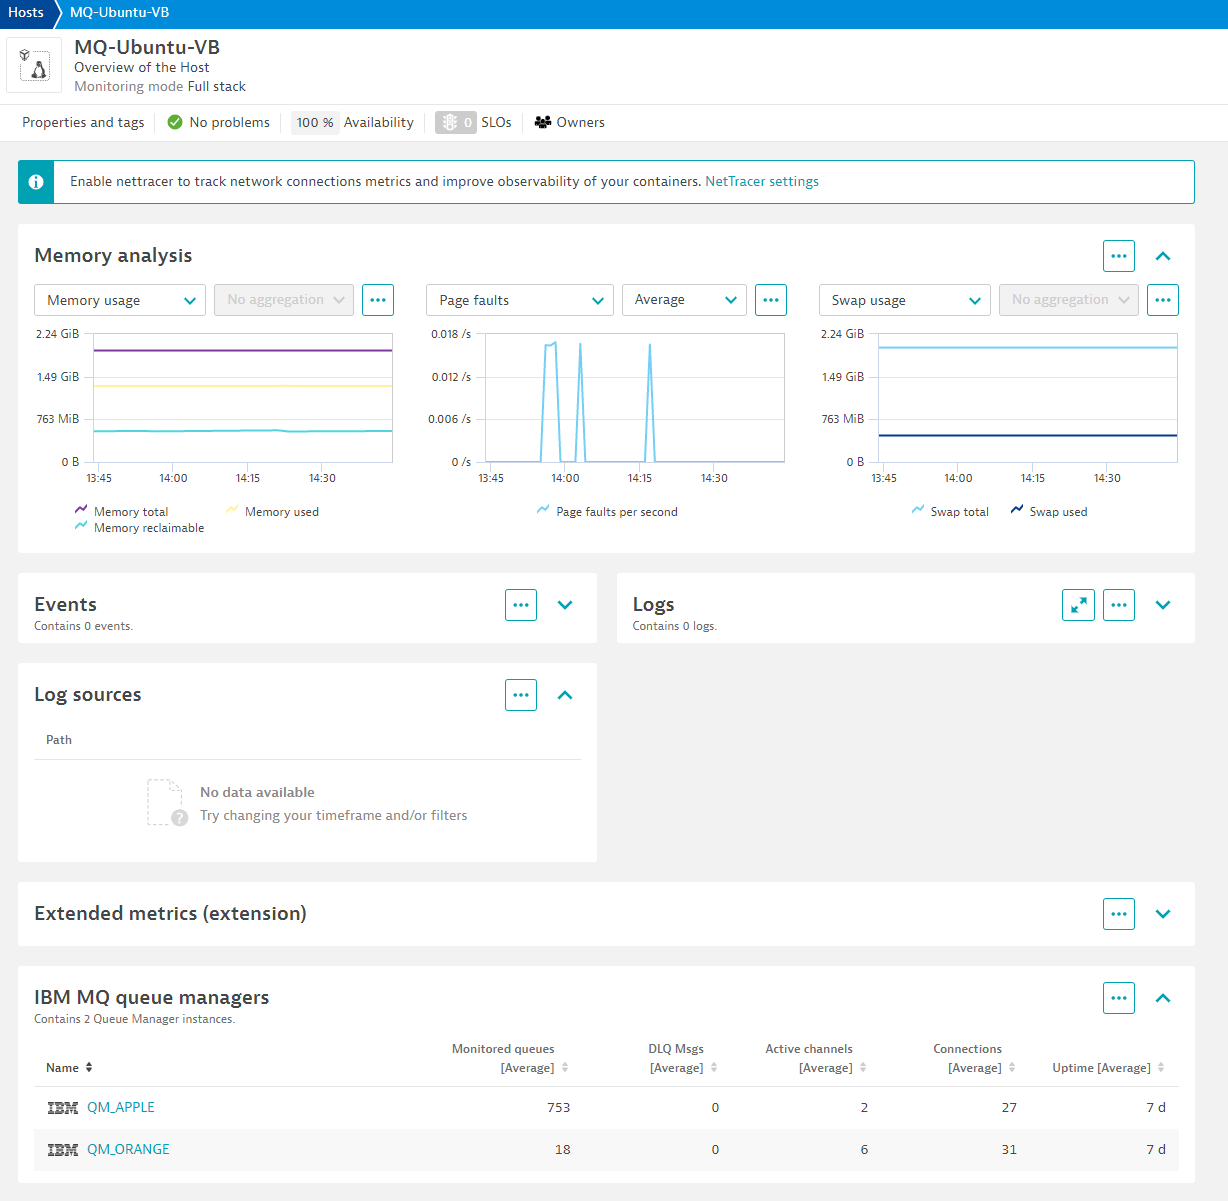
Overview
On this new version of this popular extension, collect performance metrics from your queue managers running locally on your OneAgent host or remotely from your ActiveGates. Capture metadata and new metrics on this version.
Metrics
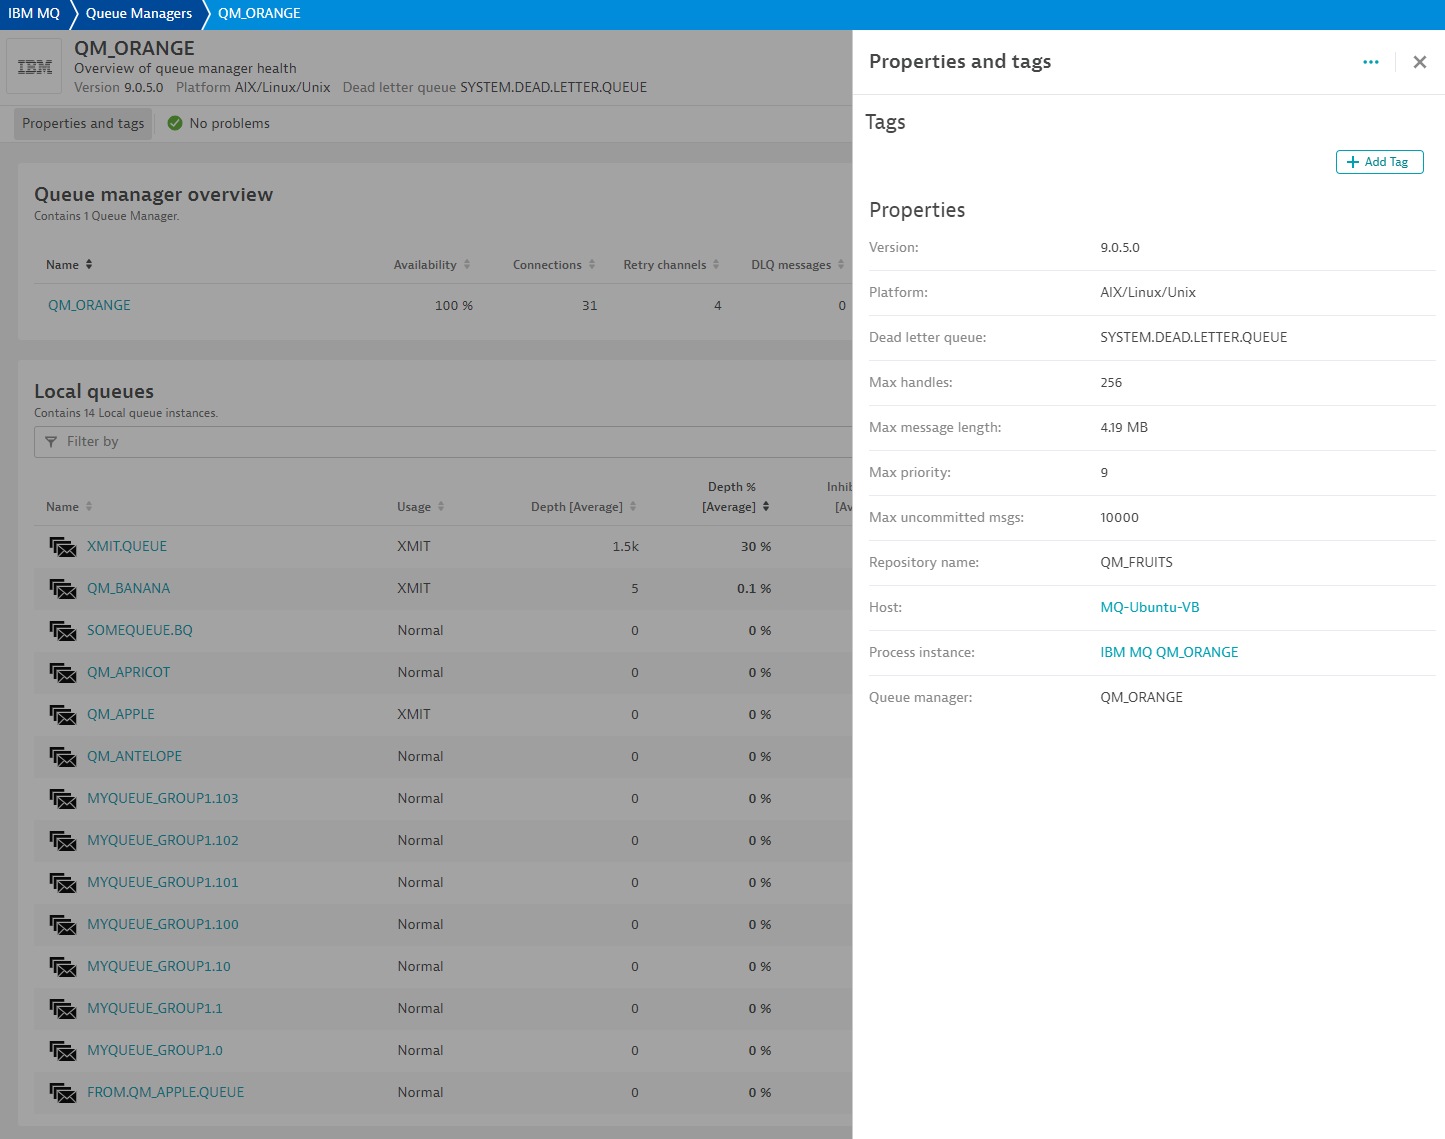
Queue manager
- Availability: Percentage of time queue manager was reachable and available to this extension. While a queue manager sometimes may be up and running, availability is within the context of this extension.
- Uptime: Time in seconds since last time queue manager started
- Connections: Number of active connections to queue manager
- Queues count: Number of queues being monitored by the extension
- DLQ depth: If DLQ is enabled, number of messages in dead letter queue
- Active channels: Number of channels in an active state
- Log utilization (Distributed only): Percentage estimate of how well the queue manager workload is contained within the primary log space
- Log in use (Distributed only): Percentage of the primary log space in use for restart recovery
- Log archive size (Distributed only): Amount of space occupied, in megabytes, by log extents no longer required for restart or media recovery, but waiting to be archived.
- Log reuse size (Distributed only): Amount of space occupied, in megabytes, by log extents available to be reused.
- Total log data sets (z/OS only): The total number of active log data sets.
- Full log data sets (z/OS only): The total number of full active log data sets that have not yet been archived.
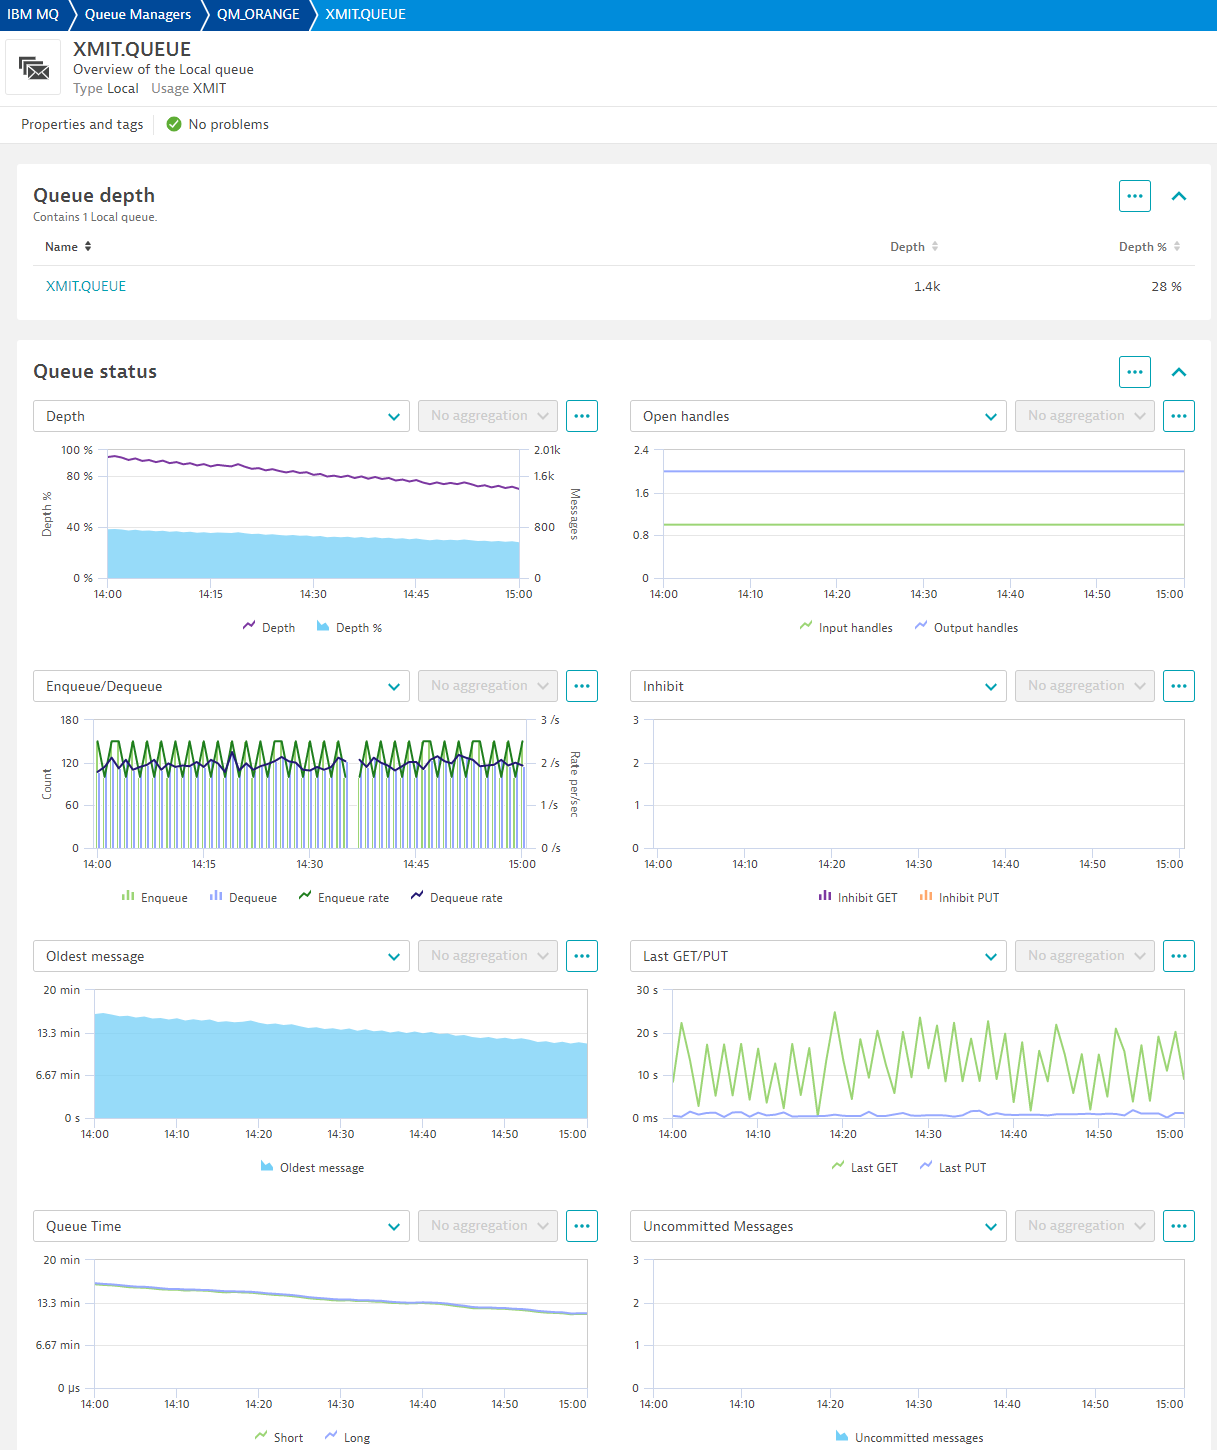
Queues
- Depth: Number of messages in queue
- Depth percentage: Percentage of messages filling up queue
- Inhibit GET: Whether queue inhibits MQGET
- Inhibit PUT: Whether queue inhibits MQPUT
- Open input handles: Number of handles opened by applications for input
- Open output handles: Number of handles opened by applications for output
- Uncommitted messages: Number of handles opened by applications for output
In order to retrieve the following metrics, queue monitoring must be enabled on queues. Any monitoring resolution will start collecting these statistics.
- Oldest message: Age in seconds of the oldest message on the queue.
- Last GET: Time at which the last message was successfully read from the queue.
- Last PUT: Time at which the last message was successfully put in queue.
- Short time indicator: Amount of time that a message spent on the queue over a short period.
- Long time indicator: Amount of time that a message spent on the queue over a long period.
In order to retrieve the following metrics, statistics on queues are reset. To reset them, CHG permission must be granted to queues
- Enqueue count: Number of messages enqueued. This count includes messages that have been put to the queue, but have not yet been committed.
- Dequeue count: Number of messages dequeued. This count includes messages that have been successfully retrieved (with a nonbrowse MQGET) from the queue, even though the MQGET has not yet been committed.
- Enqueue rate: Number of messages enqueued per second.
- Dequeue rate: Number of messages dequeued per second.
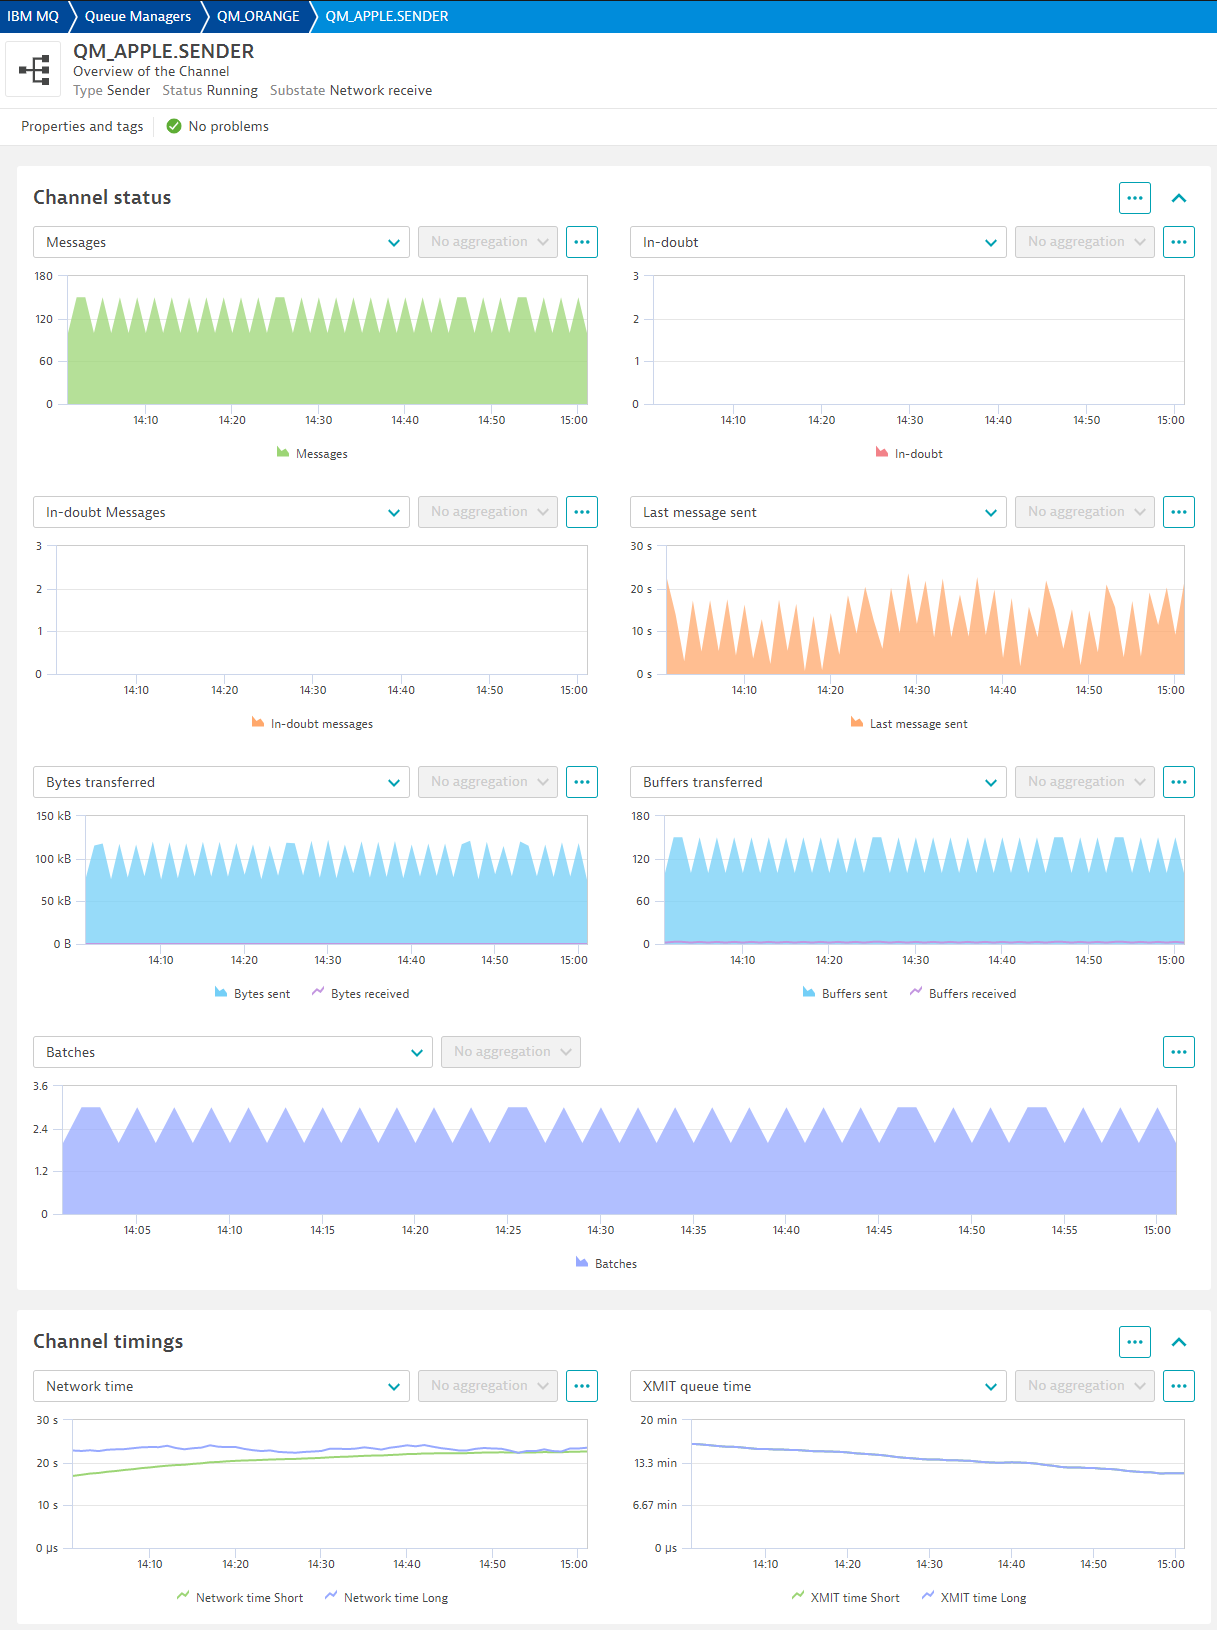
Channels:
- Messages: Number of messages sent or received, or number of MQI calls handled.
- Bytes sent: Number of bytes sent
- Bytes received: Number of bytes received
- Buffers sent: Number of buffers sent.
- Buffers received: Number of buffers received.
- Last message sent: Time when last message was sent, or MQI call was handled
- In-doubt: Whether the channel is currently in doubt. 0 = No. 1 = Yes
- In-doubt messages: Number of messages in-doubt
- Current shared conversations: Number of conversations currently active on this channel instance. This parameter is returned only for TCP/IP server-connection channels.
- Channel instances: Number of instances of this channel. This metric is only available to server-connection channels.
- Batches: Number of completed batches
- Network time short: Amount of time, in microseconds, to send an end of batch request to the remote end of the channel and receive a response over a short period.
- Network time long: Amount of time, in microseconds, to send an end of batch request to the remote end of the channel and receive a response over a longer period.
- XMIT queue time short: Time, in microseconds, that messages remained on the transmission queue before being retrieved over a short period.
- XMIT queue time long: Time, in microseconds, that messages remained on the transmission queue before being retrieved over a longer period.
- Channel status: Used to round up channel status counts for alerting and charting purposes
- Long retries left: Number of long retry attempts remaining
- Short retries left: Number of short retry attempts remaining
Listeners
- Availability: Percentage this listener was running and available.
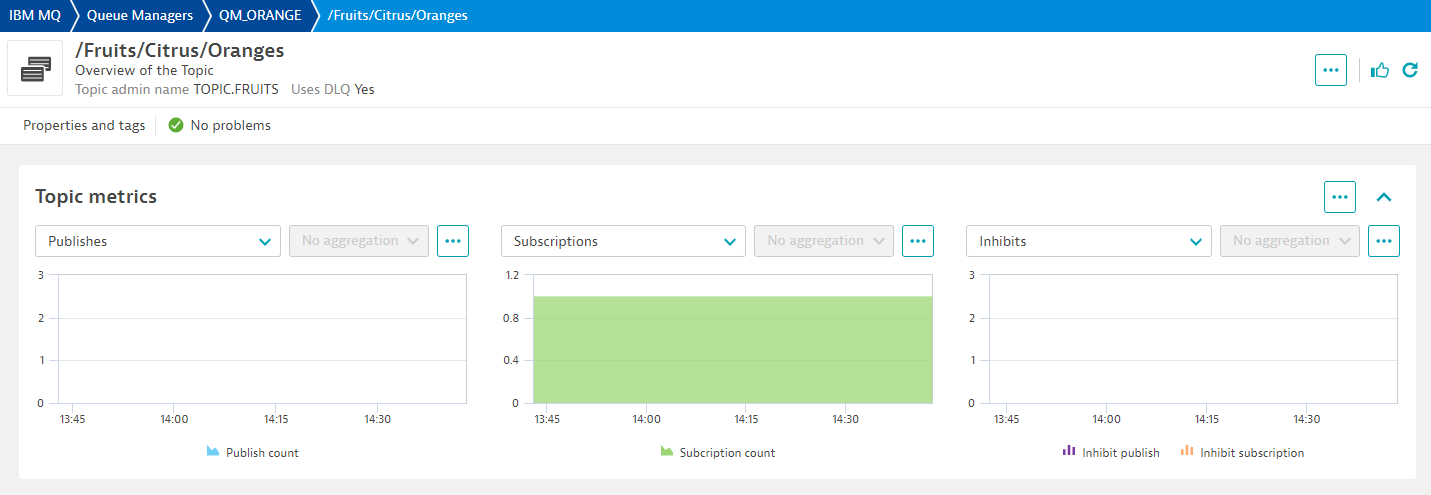
Topics
- Publish count: The number of applications currently publishing to the topic.
- Subcription count: The number of subscribers for this topic string, including durable subscribers who are not currently connected.
- Inhibit publish: Whether publishes are not allowed
- Inhibit subscription: Whether subscriptions are not allowed
Usage (z/OS only)
- Total pages: The total number of 4 KB pages in the page set.
- Expanded count: The number of times the page set has been dynamically expanded since restart.
- Unused pages: The number of pages that are not used (that is, available page sets).
- Persistent data pages: The number of pages holding persistent data.
- Non-persistent data pages: The number of pages holding nonpersistent data.
- Free pool buffers: Number of free buffers in buffer pool.
- Percent free pool buffers: Number of free buffers as a percentage of all buffers in the buffer pool.
- Total pool buffers: The number of buffers defined for specified buffer pool.
Get started
Requirements:
OneAgent deployment: (For ActiveGate deployment, continue below)
-
OneAgent for Windows or Linux only.
-
OneAgent must be running and monitoring queue manager processes.
-
Dynatrace version 1.269+
-
IBM MQ 9.1+. IBM dropped support to 9.0.x in 2021.
-
IBM MQ Command server must be running on queue managers
-
MQ Libraries must be in PATH on Windows or LD_LIBRARY_PATH on Linux. User running extension must be able to find these libraries.
Additional requirements for Linux systems:
-
User running the OneAgent (dtuser by default) must also have read access to the queue manager directories
/var/mqm/qmgrs/<queue_manager>and read/write to log directories/var/mqm/logso that it can bind properly. -
Ensure MQ libraries are accessible by
dtuseror whichever user your OneAgent service is running under. Default location for these libraries is/opt/mqm/lib64 -
By default, IBM MQ installs an ldconfig file called /etc/ld.so.config.d/mqm.conf that adds /usr/lib64 to the LD_LIBRARY_PATH. Make sure IBM MQ library symbolic links to /opt/mqm/lib64 are found in that path. If there is no reference in /usr/lib64 to /opt/mqm/lib64 libraries, you may have to create your own .conf file and place it in /etc/ld.so.config.d/.
Using ldconfig will allow the MQ libraries to be loaded by default. To do this you can do the following:
* Create a .conf file in /etc/ld.so.config.d/ with any name. Example: ibmmq_ext.conf
* Inside that file, enter the location for the IBM MQ libraries: /opt/mqm/lib64
* Save the file
* Reload ldconfig by running command: ldconfig
ActiveGate deployment:
- ActiveGates on Windows or Linux
- Dynatrace version 1.269+
- IBM MQ 9.1+. IBM dropped support to 9.0.x since 2021.
- IBM MQ Command server must be running on queue managers.
- IBM MQ running on AIX, z/OS, Linux, Windows, zLinux, MQ Appliance are supported. While it may work on other OS, they may not be officially supported.
- Server-connection channel to communicate with each queue manager. This is require for any Client connection to IBM MQ.
- Firewall from ActiveGates to queue managers must be open. Queue manager could run on any port so ensure those ports are open from your ActiveGates. Consult with your MQ administrator to know those ports.
Authentication:
IBM MQ has several ways to authenticate client and local connections. This is determined by the administrator of your MQ environment according to their own security policies.
User authentication depends on Channel Authentication (CHLAUTH) configuration. If disabled or ADOPTCTX is disabled, IBM MQ will attempt to authenticate the user running the extension process, not the user passed in the endpoint configuration.
When ADOPTCTX is enabled and CHLAUTH is enabled, the user and password combination entered in the endpoint is passed in a MQCSP block that IBM MQ will attempt to authenticate.
- Please take this into consideration when authenticating users or if you receive unauthorized errors.
User permissions to MQ objects (Distributed)
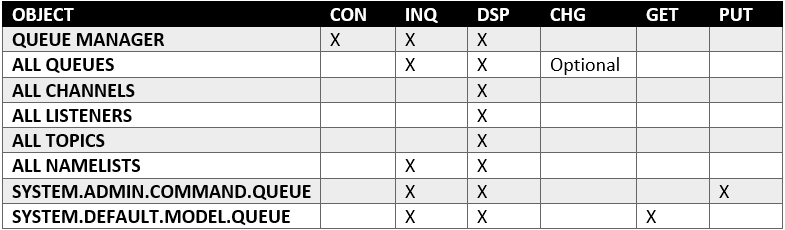
⚠️Important Note:
- Permissions above are required to all objects, not just the ones entered in the extension filters. For example, if requesting queue metrics, then you must grant DSP and INQ to all queues, including SYSTEM queues.
- CHG permission is only required if collecting Enqueue/Dequeue metrics. Enqueue/Dequeue metrics can only be obtained after issuing RESET_Q_STATISTICS command, therefore needing CHG permissions. If you cannot provide this permission, make sure you deselect those metrics on Feature Sets page of your monitoring configuration.
User permissions to MQ objects (z/OS)
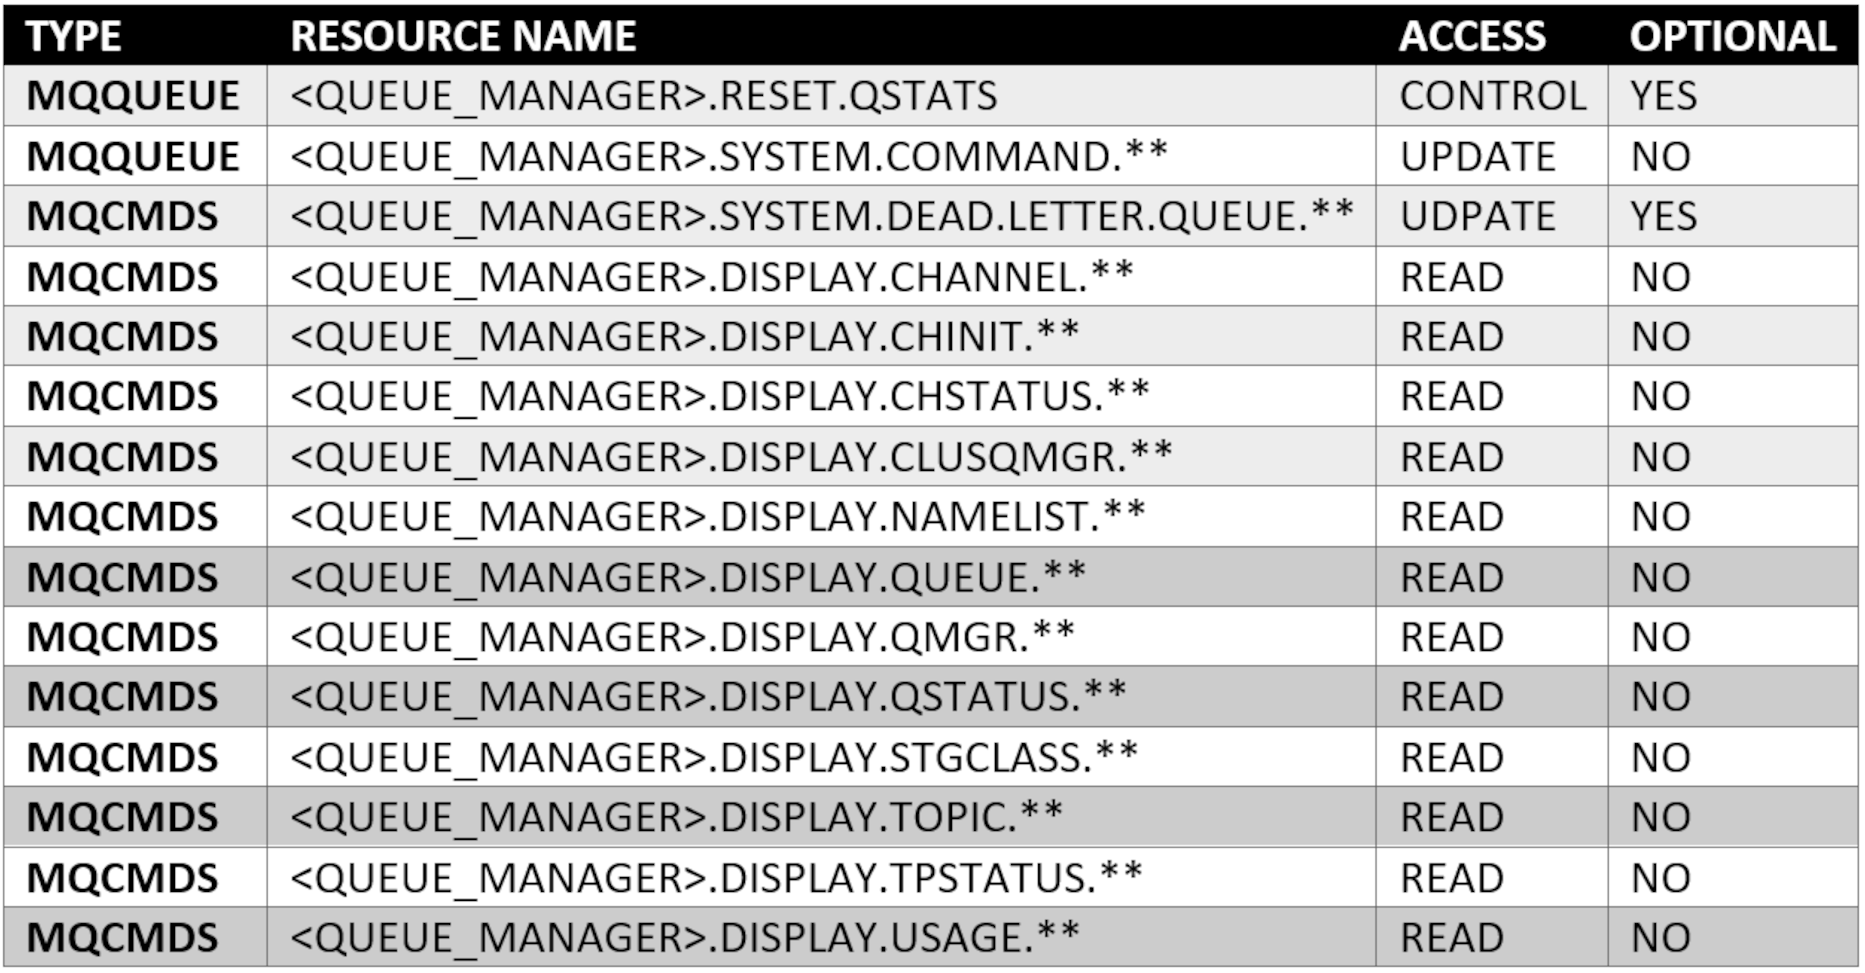 Note:
Note:
- Permissions above must be granted to all objects, not just those ones entered in extension filters.
- CONTROL permission is only required if collecting Enqueue/Dequeue metrics.
Dynatrace configuration
Under Extensions on the left menu, select IBM MQ.
- Add a monitoring configuration.
OneAgent deployment, also referred as "Local", can run on a specific host, host groups, hosts in a management zone or tagged hosts. ActiveGate deployment, also referred as "Remote", runs on ActiveGate groups. Groups can one or multiple ActiveGates for more reliability.
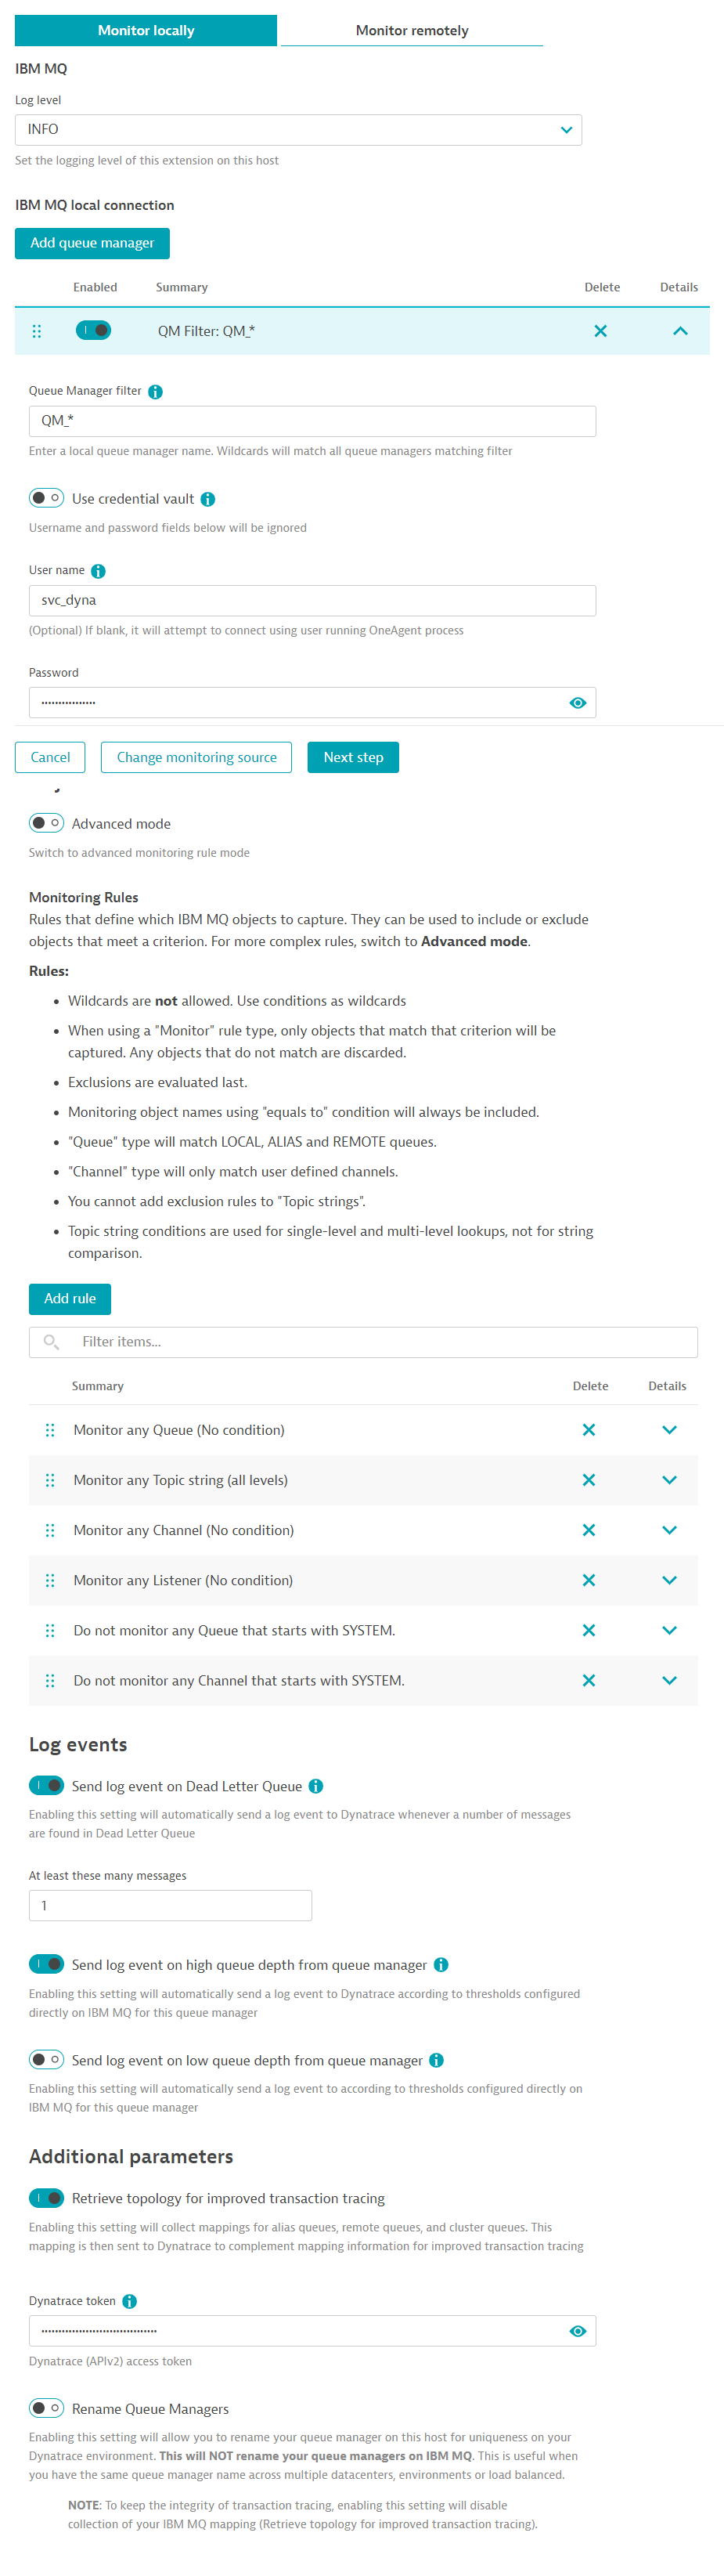
For Local (OneAgent) deployment:
- Select which hosts will run this extension
-
Log level: Enable DEBUG only when troubleshooting or support makes that recommendation.
-
Add a Queue Manager: Any queue managers matching its filter will use this configuration. You may create one separate configuration per queue manager on host, or one configuration for all queue managers on that host.
-
Queue manager filter: A name matching this filter will be matched against running processes on this host. If a name matches this filter, all settings on this configuration endpoint will apply to it.
-
Use credential vault: This will allow you to select a username/password credential stored on Dynatrace's Credential Vault. Using this feature will ignore any username/password entered manually and instead will only use the credential stored in the vault.
-
User: Optional but recommended to add a user. Otherwise, if left blank, IBM MQ will try to authenticate user running process,
dtuserby default. -
Password: Password to user above.
-
Objects to monitor: Two methods of adding objects.
- Using new wizard mode, just click buttons to enter rules. If there is an object you absolutely do not want to monitor then remove that rule.
- Advanced mode, add filters in a comma-separated fashion under each tab. Hover your mouse over the (i) icon next to each object type for rules and examples.
-
Send log event on Dead letter queue: Enable this if you would like any DLQ on any queue manager matching this configuration to trigger a log event indicating that the number of messages in DLQ exceeded threshold. You may create an alert based on that log event
-
Send log event on high queue depth from queue manager: Enable this if you would like any matching queue on any queue manager in this configuration to trigger a log event when its configured depth threshold is exceeded. This threshold is configured on IBM MQ.
-
Send log event on low queue depth from queue manager: Enable this if you would like any matching queue on any queue manager in this configuration to trigger a log event when its configured depth lower than threshold. This threshold is configured on IBM MQ.
-
Retrieve topology for improved transaction tracing: Enabling this setting will collect mappings for alias queues, remote queues, and cluster queues. This mapping is then sent to Dynatrace to complement mapping information for improved transaction tracing. You may only need to collect this once unless your mappings on IBM MQ change frequently. When enabled, enter a Dynatrace token to communicate with the API with these permission:
Read settings,Write settings. -
Rename Queue managers: Enabling this setting will allow you to add an alias to queue managers matching your queue manager filter (above). The real queue manager name will still be included in the name. This is only to differentiate queue managers with similar or same names on Dynatrace. This will not rename any queue manager on IBM MQ.
-
Lastly, select which feature sets (metric groups) you would like this configuration to collect. Selecting too few will not give you the proper visibility and you may miss out on important performance data, as well as key indicators that can be correlated between different objects.
-
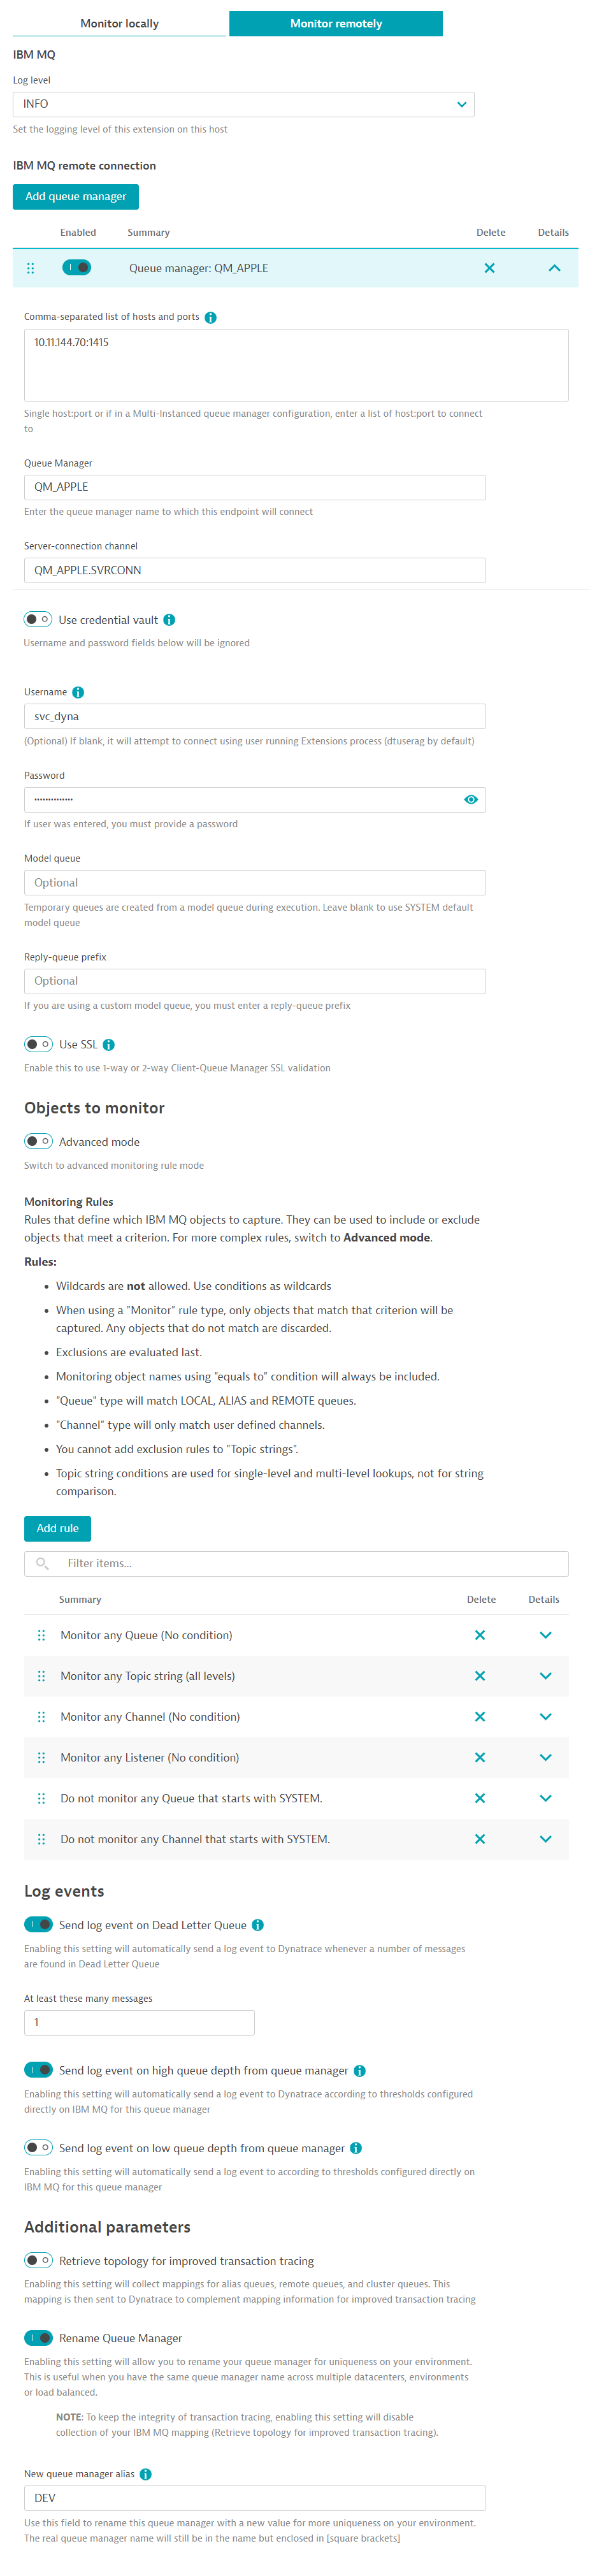
For Remote (ActiveGate) deployment:
- Select which ActiveGate group will run this extension
- Log level: Enable DEBUG only when troubleshooting or support makes that recommendation.
- Add a Queue Manager: Click on this button for each queue manager you want to connect. Multiple queue managers per ActiveGate group is recommended.
- Comma-separated hosts: Most queue managers run on a single host but there are times you have multi-instance queue managers that run across multiple hosts. Enter that single host and port here, or the comma-separated list of host and ports for that one queue manager.
- Queue manager name: Enter the name of the single queue manager you are connecting to. This is required.
- Server-connection channel: Any client application, such as this extension, that connects to IBM MQ must talk to the queue manager via a channel. Enter the name of that Server-connection channel here.
- Use credential vault: This will allow you to select a username/password credential stored on Dynatrace's Credential Vault. Using this feature will ignore any username/password entered manually and instead will only use the credential stored in the vault.
- Username: Optional but recommended to add a user. A user is always passed, but depending on the queue manager configuration on IBM MQ, it can be ignored or this user in this field can be authenticated. It is best to always enter a user.
- Password: Password to user above.
- Model queue: Optional. If not set, it will use the SYSTEM default model queue for command requests and responses.
- Reply prefix: If you entered a model queue, you must enter a prefix for the reply queue.
- Objects to monitor: Two methods of adding objects.
- Using new wizard mode, just click buttons to enter rules. If there is an object you absolutely do not want to monitor then remove that rule.
- Advanced mode, add filters in a comma-separated fashion under each tab. Hover your mouse over the (i) icon next to each object type for rules and examples.
- Send log event on Dead letter queue: Enable this if you would like any DLQ on any queue manager matching this configuration to trigger a log event indicating that the number of messages in DLQ exceeded threshold. You may create an alert based on that log event
- Send log event on high queue depth from queue manager: Enable this if you would like any matching queue on any queue manager in this configuration to trigger a log event when its configured depth threshold is exceeded. This threshold is configured on IBM MQ.
- Send log event on low queue depth from queue manager: Enable this if you would like any matching queue on any queue manager in this configuration to trigger a log event when its configured depth lower than threshold. This threshold is configured on IBM MQ.
- Retrieve topology for improved transaction tracing: Enabling this setting will collect mappings for alias queues, remote queues, and cluster queues. This mapping is then sent to Dynatrace to complement mapping information for improved transaction tracing. You may only need to collect this once unless your mappings on IBM MQ change frequently. When enabled, enter a Dynatrace token to communicate with the API with these permission:
Read settings,Write settings. - Rename Queue manager: Enabling this setting will allow you to add an alias to the queue manager defined above. The real queue manager name will still be included in the name. This is only to differentiate queue managers with similar or same names on Dynatrace. This will not rename any queue manager on IBM MQ.
- Lastly, select which feature sets (metric groups) you would like this configuration to collect. Selecting too few will not give you the proper visibility and you may miss out on important performance data, as well as key indicators that can be correlated between different objects.
FAQ
-
How many DDUs will it consume per year?
The following is an approximation. Metrics change depending on type of objects. Some metrics are not available to all channels, some metrics are not available to all queues.
Assuming you get all metrics for all objects: ((10) + (Local queues * 16) + (Alias + Remote queues) * 2 + (Channels * 18) + (Listeners) + (Topics * 4)) * Queue managers * 525.6 = DDUs per year
For example:
1      Queue manager
400    Local queues
20     Alias and remote queues
50     Channels
1      Listener
50     Topics

( 10 + (400 * 16) + (20 * 2) + (50 * 18) + (1 * 1) + (50 * 4) ) * 1 * 525.6 =
(10 + 6400 + 40 + 900 + 1 + 200)  * 525.6 = approximately 3.9M DDUs per year
-
I am not seeing all queue metrics
Some metrics depend on the type of queues. Other metrics depend on your queue manager configuration and if your user has enough permissions to collect them.
-
Are you missing Enqueue and Dequeue? Make sure your user has CHG permission on queues to reset statistics on queues. Only then you can receive Enqueue and Dequeue metrics.
-
Are you missing Oldest message and Last get/put? Make sure Monitoring statistics is enabled on your queue manager for all queues.
-
Are you looking at Alias or Remote queues? Only Locally defined queues have status metrics. Alias and Remote only have Inhibit GET/PUT metrics.
-
I keep getting Unauthorized errors but I know my user is correct
Check the AMQERR01.LOG on the queue manager itself. This log file will tell you what it tried to authenticate and what permissions you are missing.
If you are unable to connect to your queue manager, make sure that either the user running the extension process has permissions to the queue manager, or ADOPTCTX and CHLAUTH is enabled so that it can authenticate the user and password combination passed in the MQCSP block.
-
I get a pymqe error saying libmqm_r.so not found
This means that the IBM MQ libraries were not found in the unix PATH. Make sure you follow the ldconfig step above under Local deployment
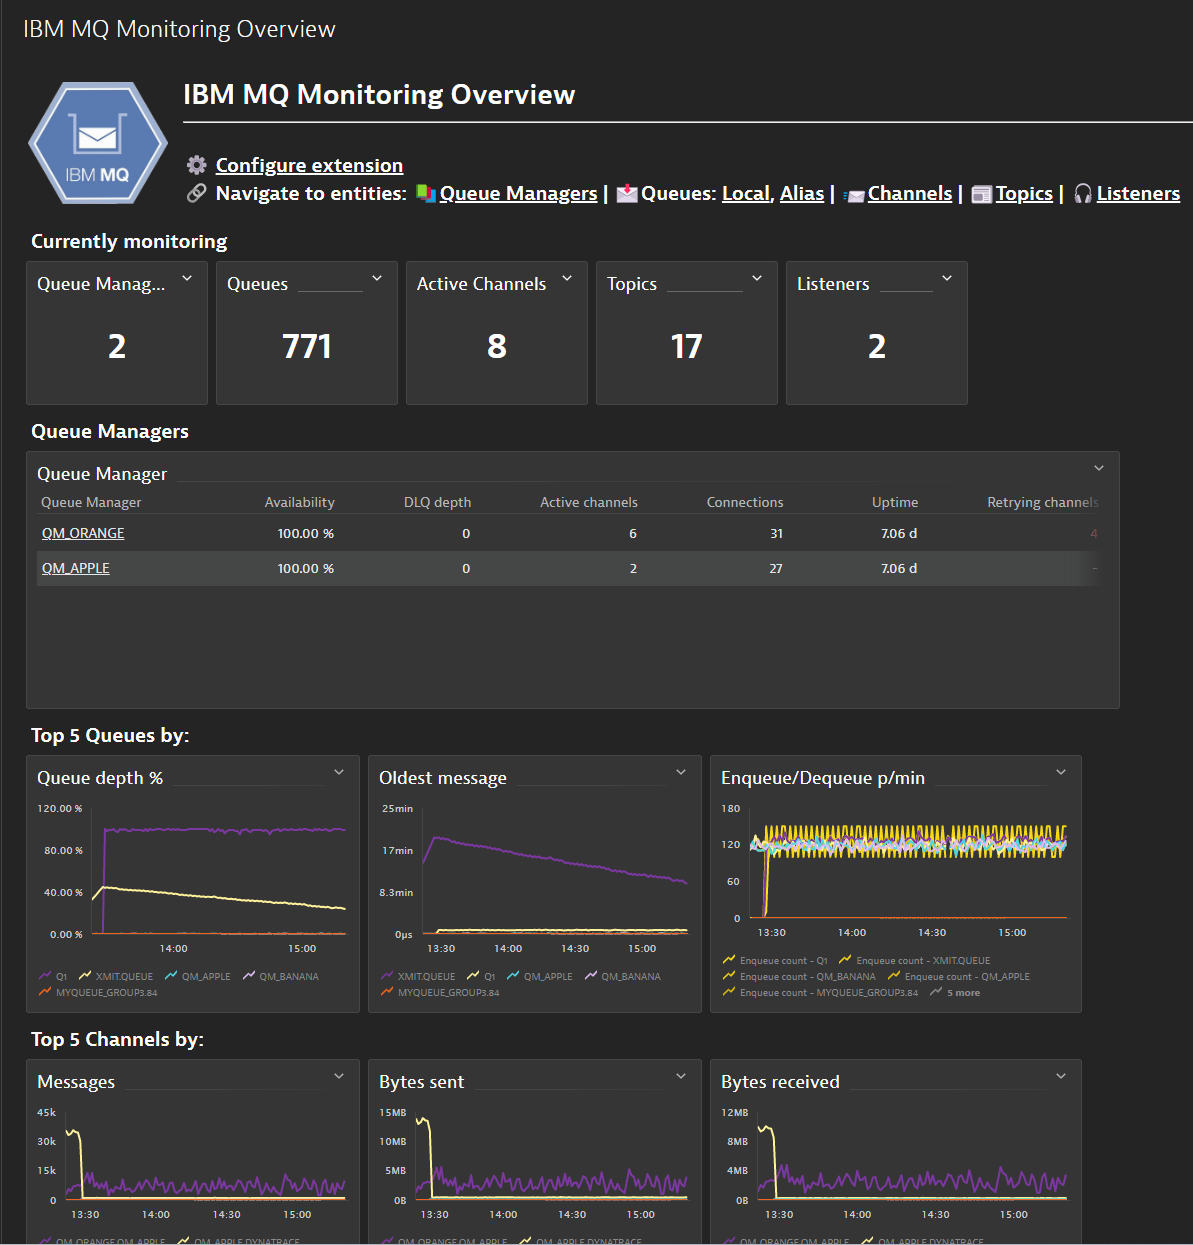
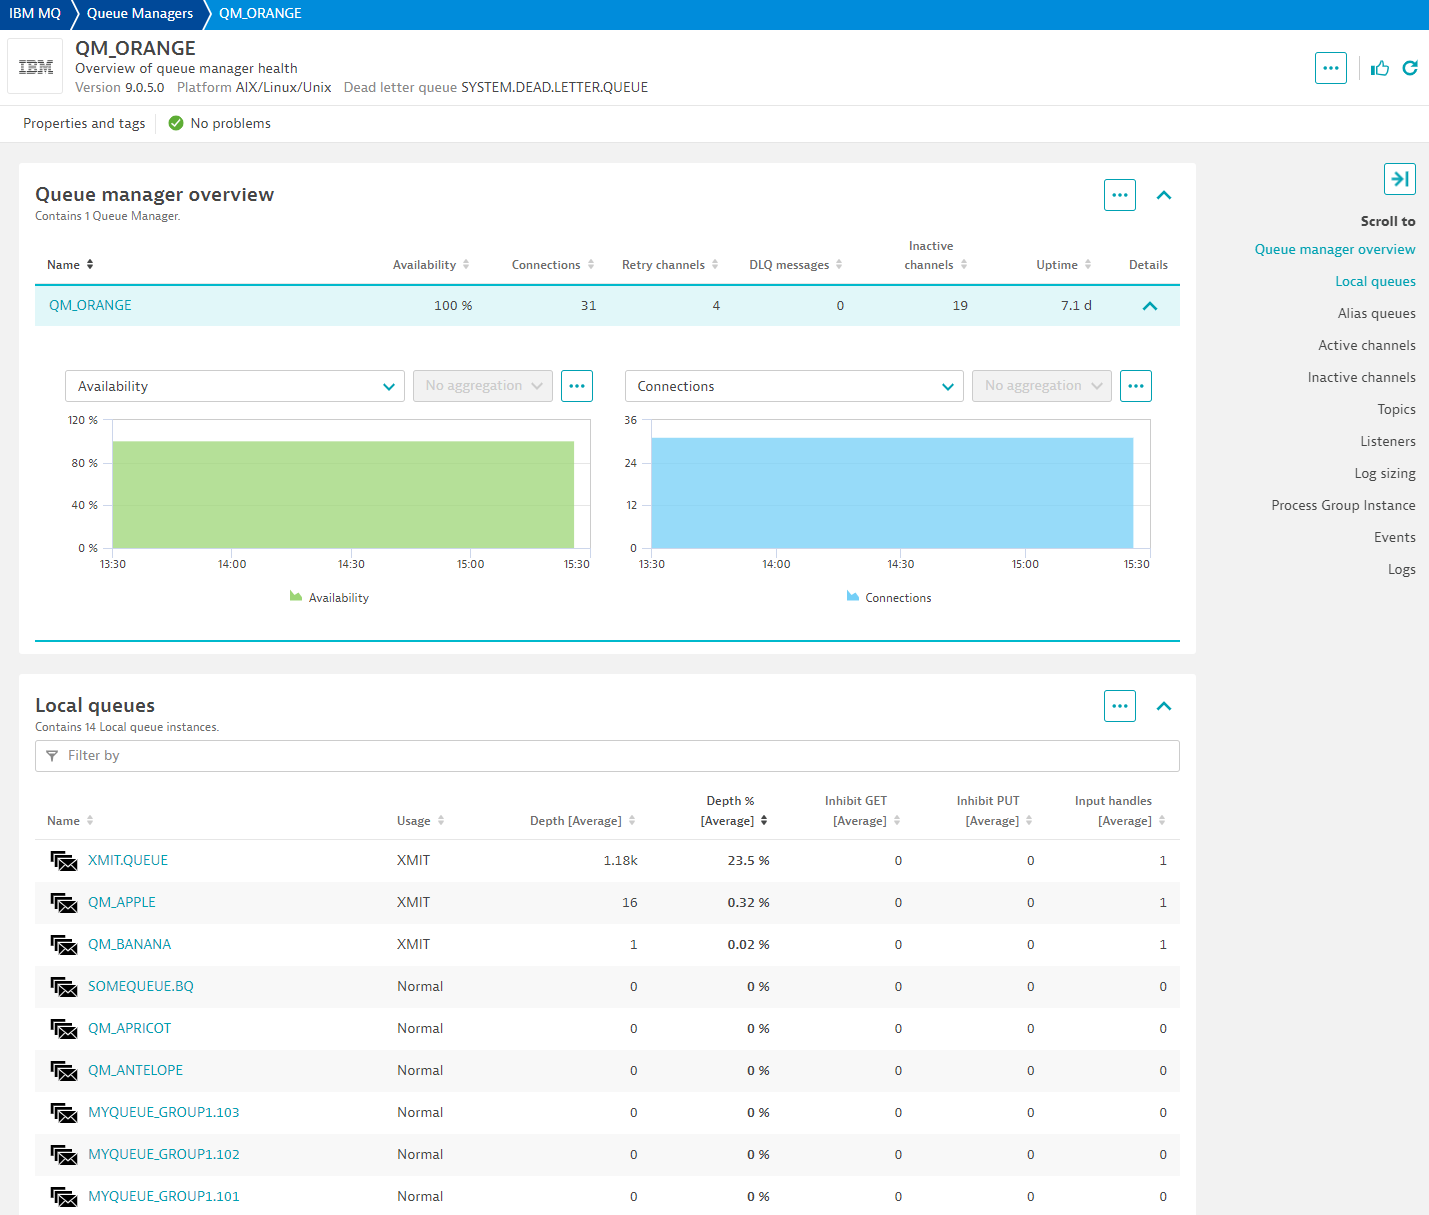
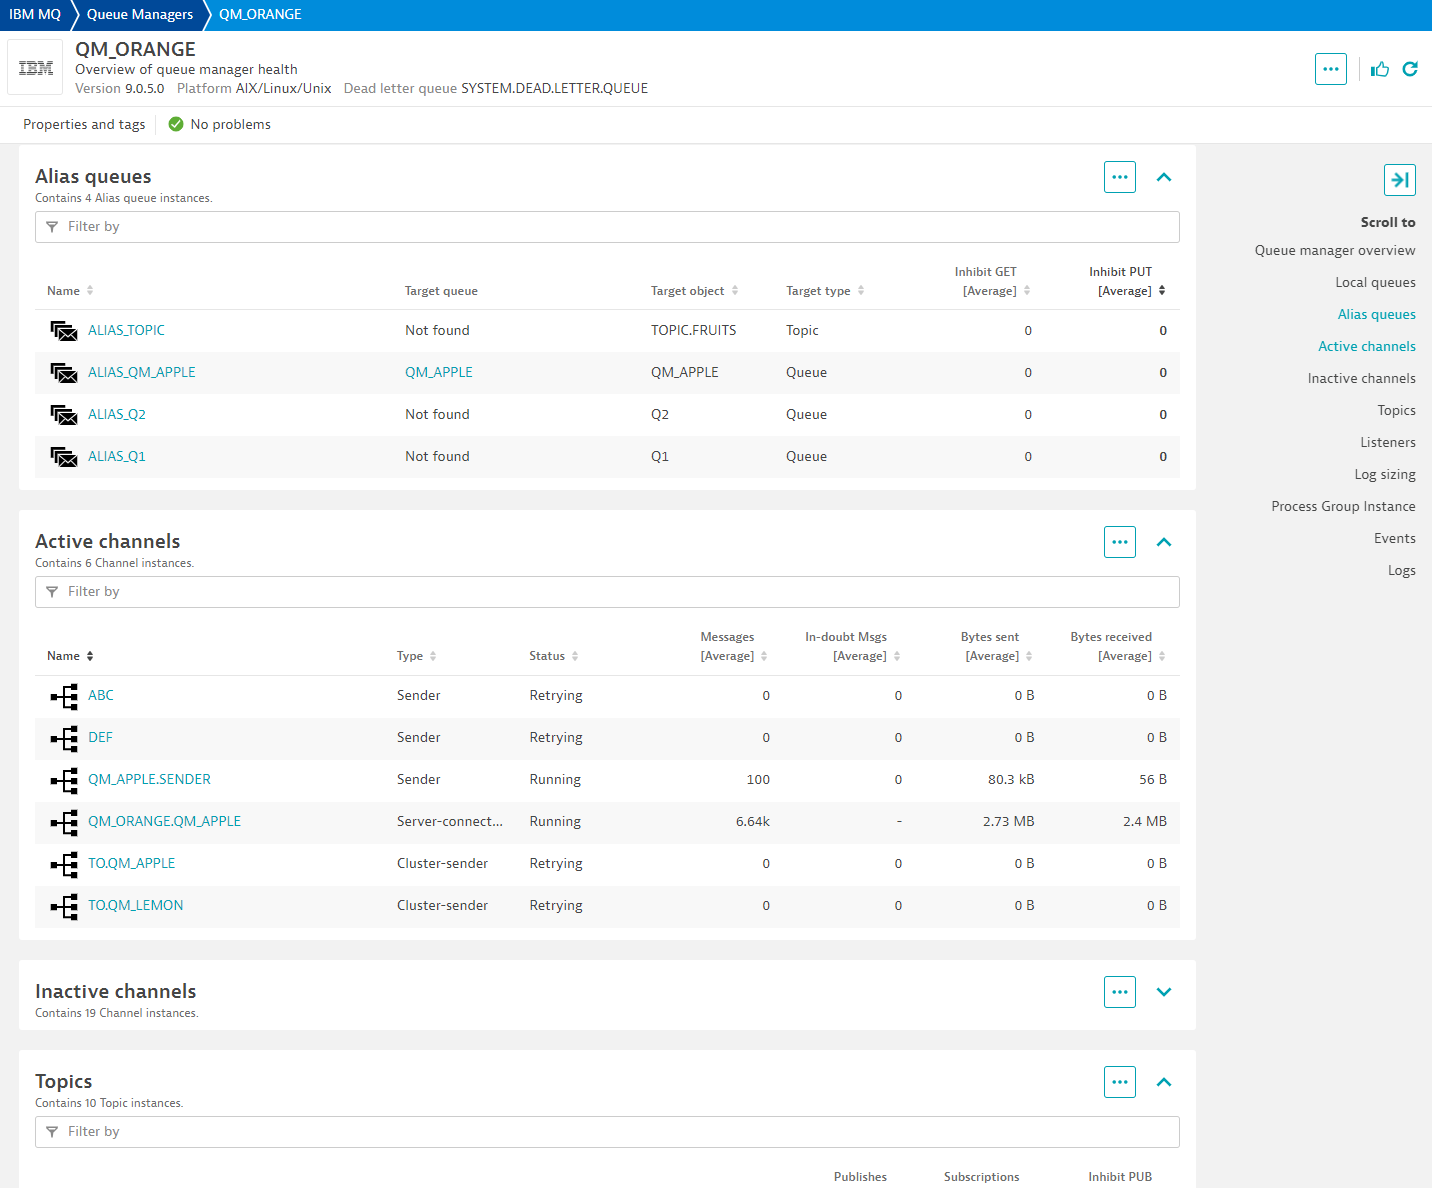
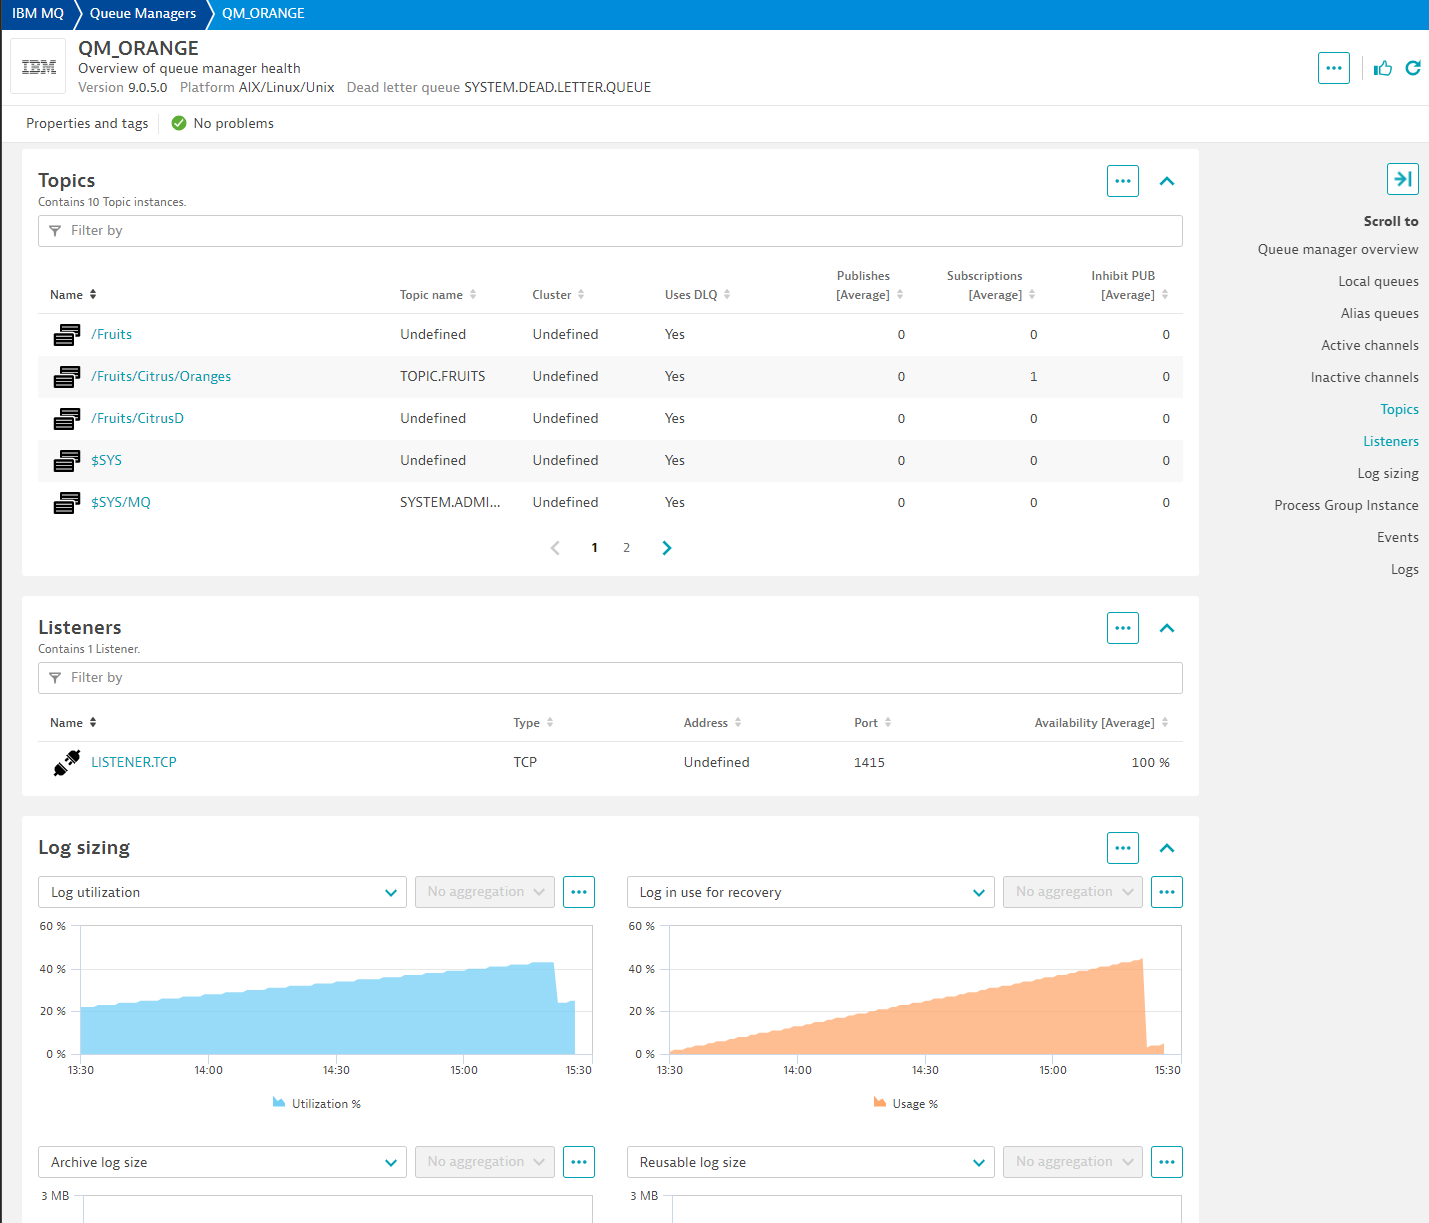
Screenshots
Extension content
Feature sets
Below is a complete list of the feature sets provided in this version. To ensure a good fit for your needs, individual feature sets can be activated and deactivated by your administrator during configuration.
| Metric name | Metric key | Description | Unit |
|---|---|---|---|
| Availability | ibmmq.listener.availability | Percentage this listener was running and available. | Percent |
| Metric name | Metric key | Description | Unit |
|---|---|---|---|
| Last message sent | ibmmq.channel.last_msg | Time when last message was sent, or MQI call was handled | Second |
| Network time short | ibmmq.channel.nettime_short | Amount of time, in microseconds, to send an end of batch request to the remote end of the channel and receive a response over a short period. | MicroSecond |
| Network time long | ibmmq.channel.nettime_long | Amount of time, in microseconds, to send an end of batch request to the remote end of the channel and receive a response over a longer period. | MicroSecond |
| XMIT queue time short | ibmmq.channel.xmitqtime_short | Time, in microseconds, that messages remained on the transmission queue before being retrieved over a short period. | MicroSecond |
| XMIT queue time long | ibmmq.channel.xmitqtime_long | Time, in microseconds, that messages remained on the transmission queue before being retrieved over a longer period. | MicroSecond |
| Metric name | Metric key | Description | Unit |
|---|---|---|---|
| Bytes sent | ibmmq.channel.bytes_sent | Number of bytes sent | Byte |
| Bytes received | ibmmq.channel.bytes_rcvd | Number of bytes received | Byte |
| Buffers sent | ibmmq.channel.buffers_sent | Number of buffers sent. | Count |
| Buffers received | ibmmq.channel.buffers_rcvd | Number of buffers received. | Count |
| Metric name | Metric key | Description | Unit |
|---|---|---|---|
| Total pages | ibmmq.queue_manager.usage.pageset.total_pages | The total number of 4 KB pages in the page set. Available only on z/OS IBM MQ | Count |
| Expand count | ibmmq.queue_manager.usage.pageset.expand_cnt | The number of times the page set has been dynamically expanded since restart. Available only on z/OS IBM MQ | Count |
| Unused pages | ibmmq.queue_manager.usage.pageset.unused_pages | The number of pages that are not used (that is, available page sets). Available only on z/OS IBM MQ | Count |
| Persistent pages | ibmmq.queue_manager.usage.pageset.persistent_data_pages | The number of pages holding persistent data. Available only on z/OS IBM MQ | Count |
| Non-persistent pages | ibmmq.queue_manager.usage.pageset.nonpersistent_data_pages | The number of pages holding nonpersistent data. Available only on z/OS IBM MQ | Count |
| Free buffers | ibmmq.queue_manager.usage.buffer_pool.free_buffers | Number of free buffers in buffer pool. Available only on z/OS IBM MQ | Count |
| Percent of free buffers | ibmmq.queue_manager.usage.buffer_pool.percent_free_buffers | Number of free buffers as a percentage of all buffers in the buffer pool. Available only on z/OS IBM MQ | Percent |
| Total buffers | ibmmq.queue_manager.usage.buffer_pool.total_buffers | The number of buffers defined for specified buffer pool. Available only on z/OS IBM MQ | Count |
| Metric name | Metric key | Description | Unit |
|---|---|---|---|
| Channel instances | ibmmq.channel.instances | Number of instances of this channel. This metric is only available to server-connection channels. | Count |
| Current shared conversations | ibmmq.channel.current_sharing_convs | Number of conversations currently active on this channel instance. This parameter is returned only for TCP/IP server-connection channels. | Count |
| Metric name | Metric key | Description | Unit |
|---|---|---|---|
| Connections | ibmmq.queue_manager.connections | Number of active connections to queue manager | Count |
| Queues count | ibmmq.queue_manager.monitored_queues | Number of monitored queues | Count |
| DLQ depth | ibmmq.queue_manager.dlq_depth | Number of messages in dead letter queue | Count |
| Active channels | ibmmq.queue_manager.active_channels | Number of channels in an active current status | Count |
| Metric name | Metric key | Description | Unit |
|---|---|---|---|
| Inhibit publish | ibmmq.topic.inhibit_pub | Whether publishes are not allowed | Unspecified |
| Inhibit subscription | ibmmq.topic.inhibit_sub | Whether subscriptions are not allowed | Unspecified |
| Metric name | Metric key | Description | Unit |
|---|---|---|---|
| Messages | ibmmq.channel.messages | Number of messages sent or received, or number of MQI calls handled. | Count |
| Batches | ibmmq.channel.batches | Number of completed batches | Count |
| In-doubt messages | ibmmq.channel.current_messages | Number of messages in-doubt | Count |
| Metric name | Metric key | Description | Unit |
|---|---|---|---|
| Long retries left | ibmmq.channel.long_retries_left | Number of long retry attempts remaining | Count |
| Short retries left | ibmmq.channel.short_retries_left | Number of short retry attempts remaining | Count |
| Metric name | Metric key | Description | Unit |
|---|---|---|---|
| Availability | ibmmq.queue_manager.availability | Percentage of time queue manager was reachable and available to this extension. While a queue manager sometimes may be up and running, availability is within the context of this extension. | Percent |
| Uptime | ibmmq.queue_manager.uptime | Time in seconds since last time queue manager started | Second |
| Metric name | Metric key | Description | Unit |
|---|---|---|---|
| Log utilization | ibmmq.queue_manager.log_utilization | Percentage estimate of how well the queue manager workload is contained within the primary log space | Percent |
| Log in use | ibmmq.queue_manager.log_in_use | Percentage of the primary log space in use for restart recovery | Percent |
| Log archive size | ibmmq.queue_manager.log_archive_size | Amount of space occupied, in megabytes, by log extents no longer required for restart or media recovery, but waiting to be archived. | MegaByte |
| Log reuse size | ibmmq.queue_manager.log_reuse_size | Amount of space occupied, in megabytes, by log extents available to be reused. | MegaByte |
| z/OS Total log data sets | ibmmq.queue_manager.total_log_data_sets | The total number of active log data sets. | Count |
| z/OS Full log data sets | ibmmq.queue_manager.full_log_data_sets | The total number of full active log data sets that have not yet been archived. | Count |
| Metric name | Metric key | Description | Unit |
|---|---|---|---|
| Channel status | ibmmq.channel.status | Used to round up channel status counts for alerting and charting purposes | Unspecified |
| Metric name | Metric key | Description | Unit |
|---|---|---|---|
| Depth | ibmmq.queue.depth | Number of messages in queue | Count |
| Depth percentage | ibmmq.queue.depth_percent | Percentage of messages filling up queue | Percent |
| Metric name | Metric key | Description | Unit |
|---|---|---|---|
| Publish count | ibmmq.topic.pub_cnt | The number of applications currently publishing to the topic. | Count |
| Subcription count | ibmmq.topic.sub_cnt | The number of subscribers for this topic string, including durable subscribers who are not currently connected. | Count |
| Metric name | Metric key | Description | Unit |
|---|---|---|---|
| Open input handles | ibmmq.queue.open_input_handles | Number of handles opened by applications for input | Count |
| Open output handles | ibmmq.queue.open_output_handles | Number of handles opened by applications for output | Count |
| Metric name | Metric key | Description | Unit |
|---|---|---|---|
| Enqueue count | ibmmq.queue.enqueue_cnt | Number of messages enqueued. This count includes messages that have been put to the queue, but have not yet been committed. Enqueue rate also comes with this metric. | Count |
| Dequeue count | ibmmq.queue.dequeue_cnt | Number of messages dequeued. This count includes messages that have been successfully retrieved (with a nonbrowse MQGET) from the queue, even though the MQGET has not yet been committed. Dequeue rate also comes with this metric. | Count |
| Metric name | Metric key | Description | Unit |
|---|---|---|---|
| In-doubt | ibmmq.channel.in_doubt | Whether the channel is currently in doubt. 0 = No. 1 = Yes | Unspecified |
| Metric name | Metric key | Description | Unit |
|---|---|---|---|
| Inhibit GET | ibmmq.queue.inhibit_get | Whether queue inhibits MQGET | Unspecified |
| Inhibit PUT | ibmmq.queue.inhibit_put | Whether queue inhibits MQPUT | Unspecified |
| Metric name | Metric key | Description | Unit |
|---|---|---|---|
| Oldest message | ibmmq.queue.oldest_message | Age in seconds of the oldest message on the queue. | Second |
| Uncommitted messages | ibmmq.queue.uncommitted_messages | Number of handles opened by applications for output | Count |
| Last GET | ibmmq.queue.last_get | Time at which the last message was successfully read from the queue. | MilliSecond |
| Last PUT | ibmmq.queue.last_put | Time at which the last message was successfully put in queue. | MilliSecond |
| Short time indicator | ibmmq.queue.time_indicator_short | Amount of time that a message spent on the queue over a short period. | MicroSecond |
| Long time indicator | ibmmq.queue.time_indicator_long | Amount of time that a message spent on the queue over a long period. | MicroSecond |

Full version history
Full version history
- Resolves a java error dependency on java.time.Instant#seconds
Full version history
- Credential Vault support was added.
- Ability to Rename/Prefix queue managers allowing you to have same queue manager names from different environments or datacenters.
- Minor fixes.
Full version history
- Improved memory consumption.
- Added Connection name list and Connected host properties to MQ objects (Remote deployment only).
- Fixed non-ascii characters in description fields causing rejection.
- Fixed issue causing extension initialization problems on some rare use cases.
- Fixed an issue with filters no picking up new channels.
Full version history
- Solved an issue with connections that gave a MQRC_QMGR_NAME_ERROR error
Full version history
- Solved a communication error with cluster when sending Topology data.
- Added Management zone support to metrics.
- Added type of activation, configuration labels and description to Queue manager metadata for rapid configuration lookup.
- Various UI fixes
Full version history
- ⚠️ For customers upgrading from versions 3.0.x, new entities will be created for all objects (queue managers, queues, channels, topics, listeners). You will see double entities temporarily, and it will fix itself over time. Your old entities will eventually fall off. Please update any references to any existing entities in any custom alert rules or any custom dashboards you may have created. This change does not affect customers coming from 1.x.x or 2.x.x versions. Please disregard this warning if you are not upgrading from 3.0.x.
- Added support to Remote (ActiveGate) deployment, therefore consolidating activations.
- Added Remote queues
- Made adjustments to Unified Analysis screens to reflect new metrics and deployment.
- Support for z/OS and AIX on Remote deployment only.
- Fixed issue with circular dependencies in libraries.
Full version history
- Fixed issue with Advanced Mode object collection
Full version history
Release notes:
- Developed in Dynatrace's Extension Framework 2.0
- New metrics.
- New configuration screen.
- New dashboards.
- New filters.
- Supports Alias queues.
- New topic metrics.
- New entities. You can now tag entities too.
- New relationships.
- Ability to select feature sets of metrics to collect.