IBM Z (Mainframe) monitoring
Monitor your entire stack with a single solution, and control the sprawl.
Siloed tools and data don’t work for today’s complex environments
Dynatrace monitors and analyzes everything automatically, from top to bottom
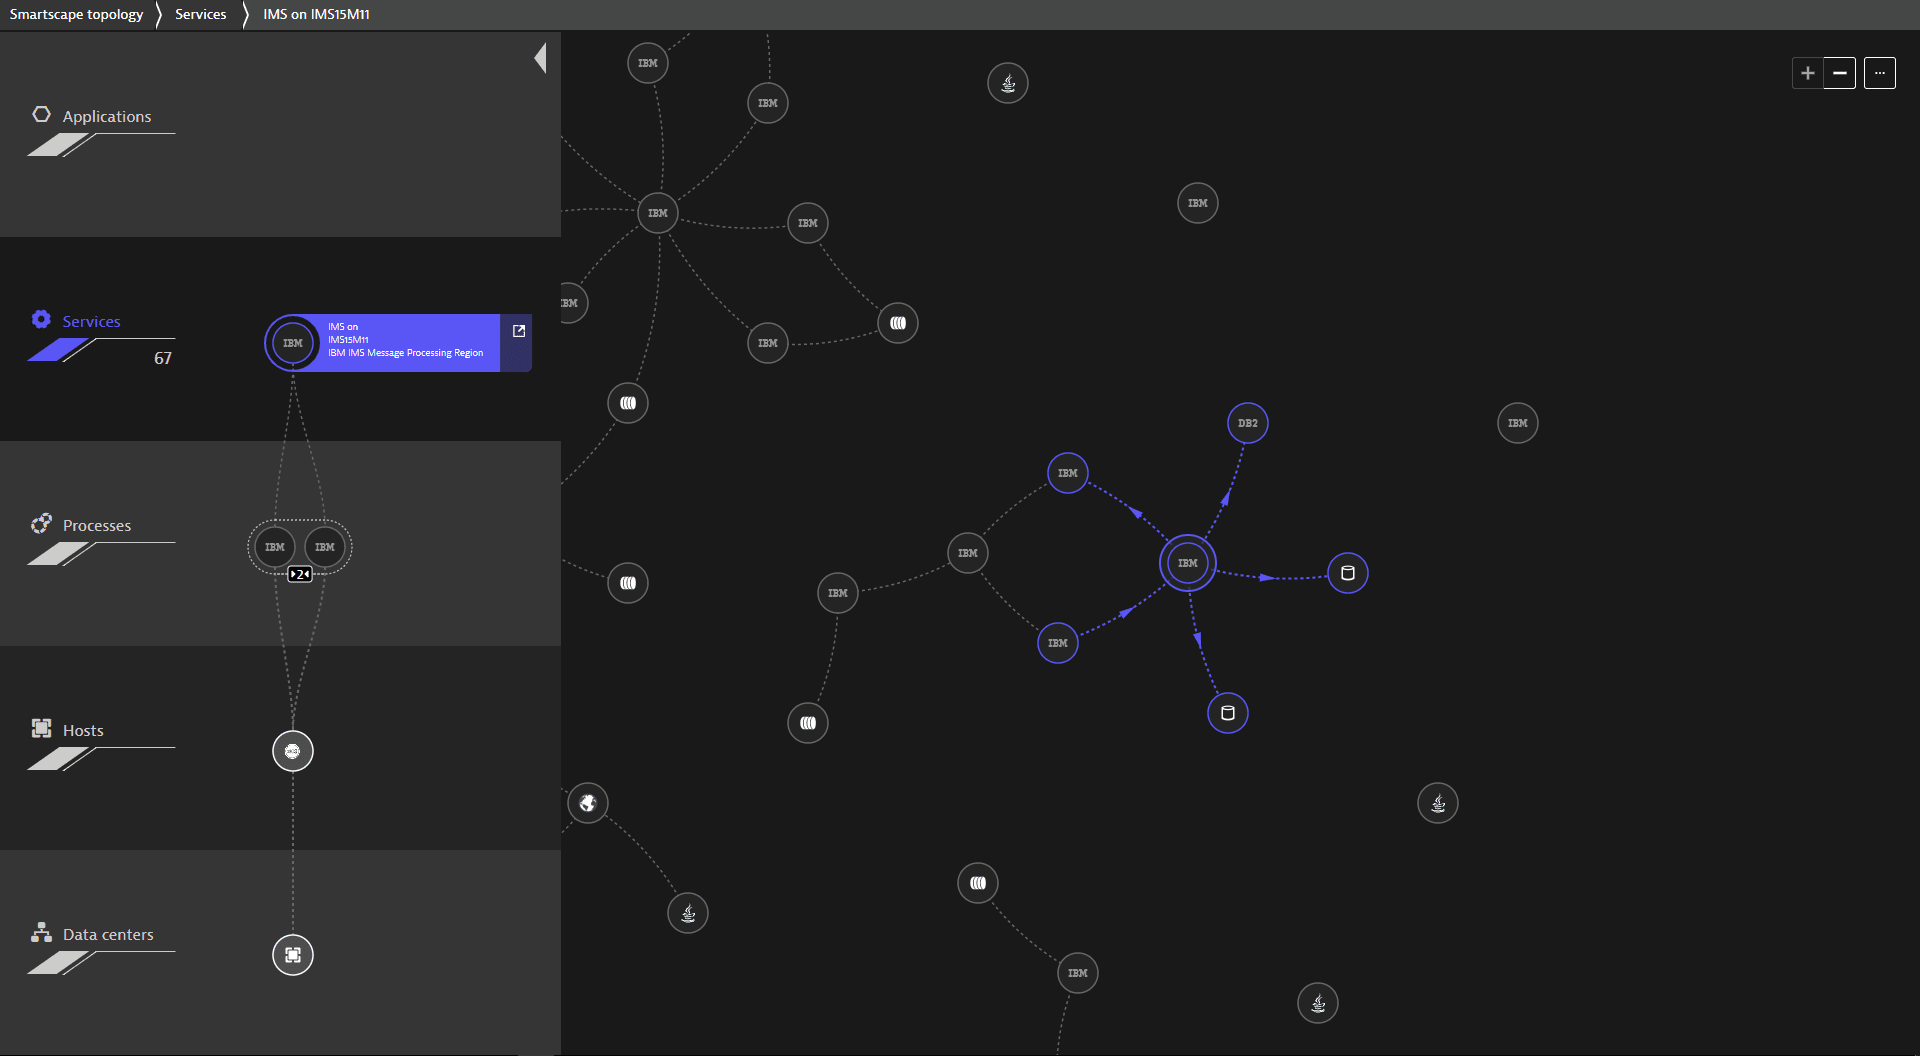
See how everything is connected
Dynatrace automatically discovers, maps and monitors every component of the full stack, from the application, the underlying infrastructure, and the experience of all users.
- On the host level, Dynatrace shows the physical mainframe or logical partitions (LPARs).
- Processes represent the CICS and the IMS regions themselves.
- Services show each interaction with a region and how those service calls are connected.
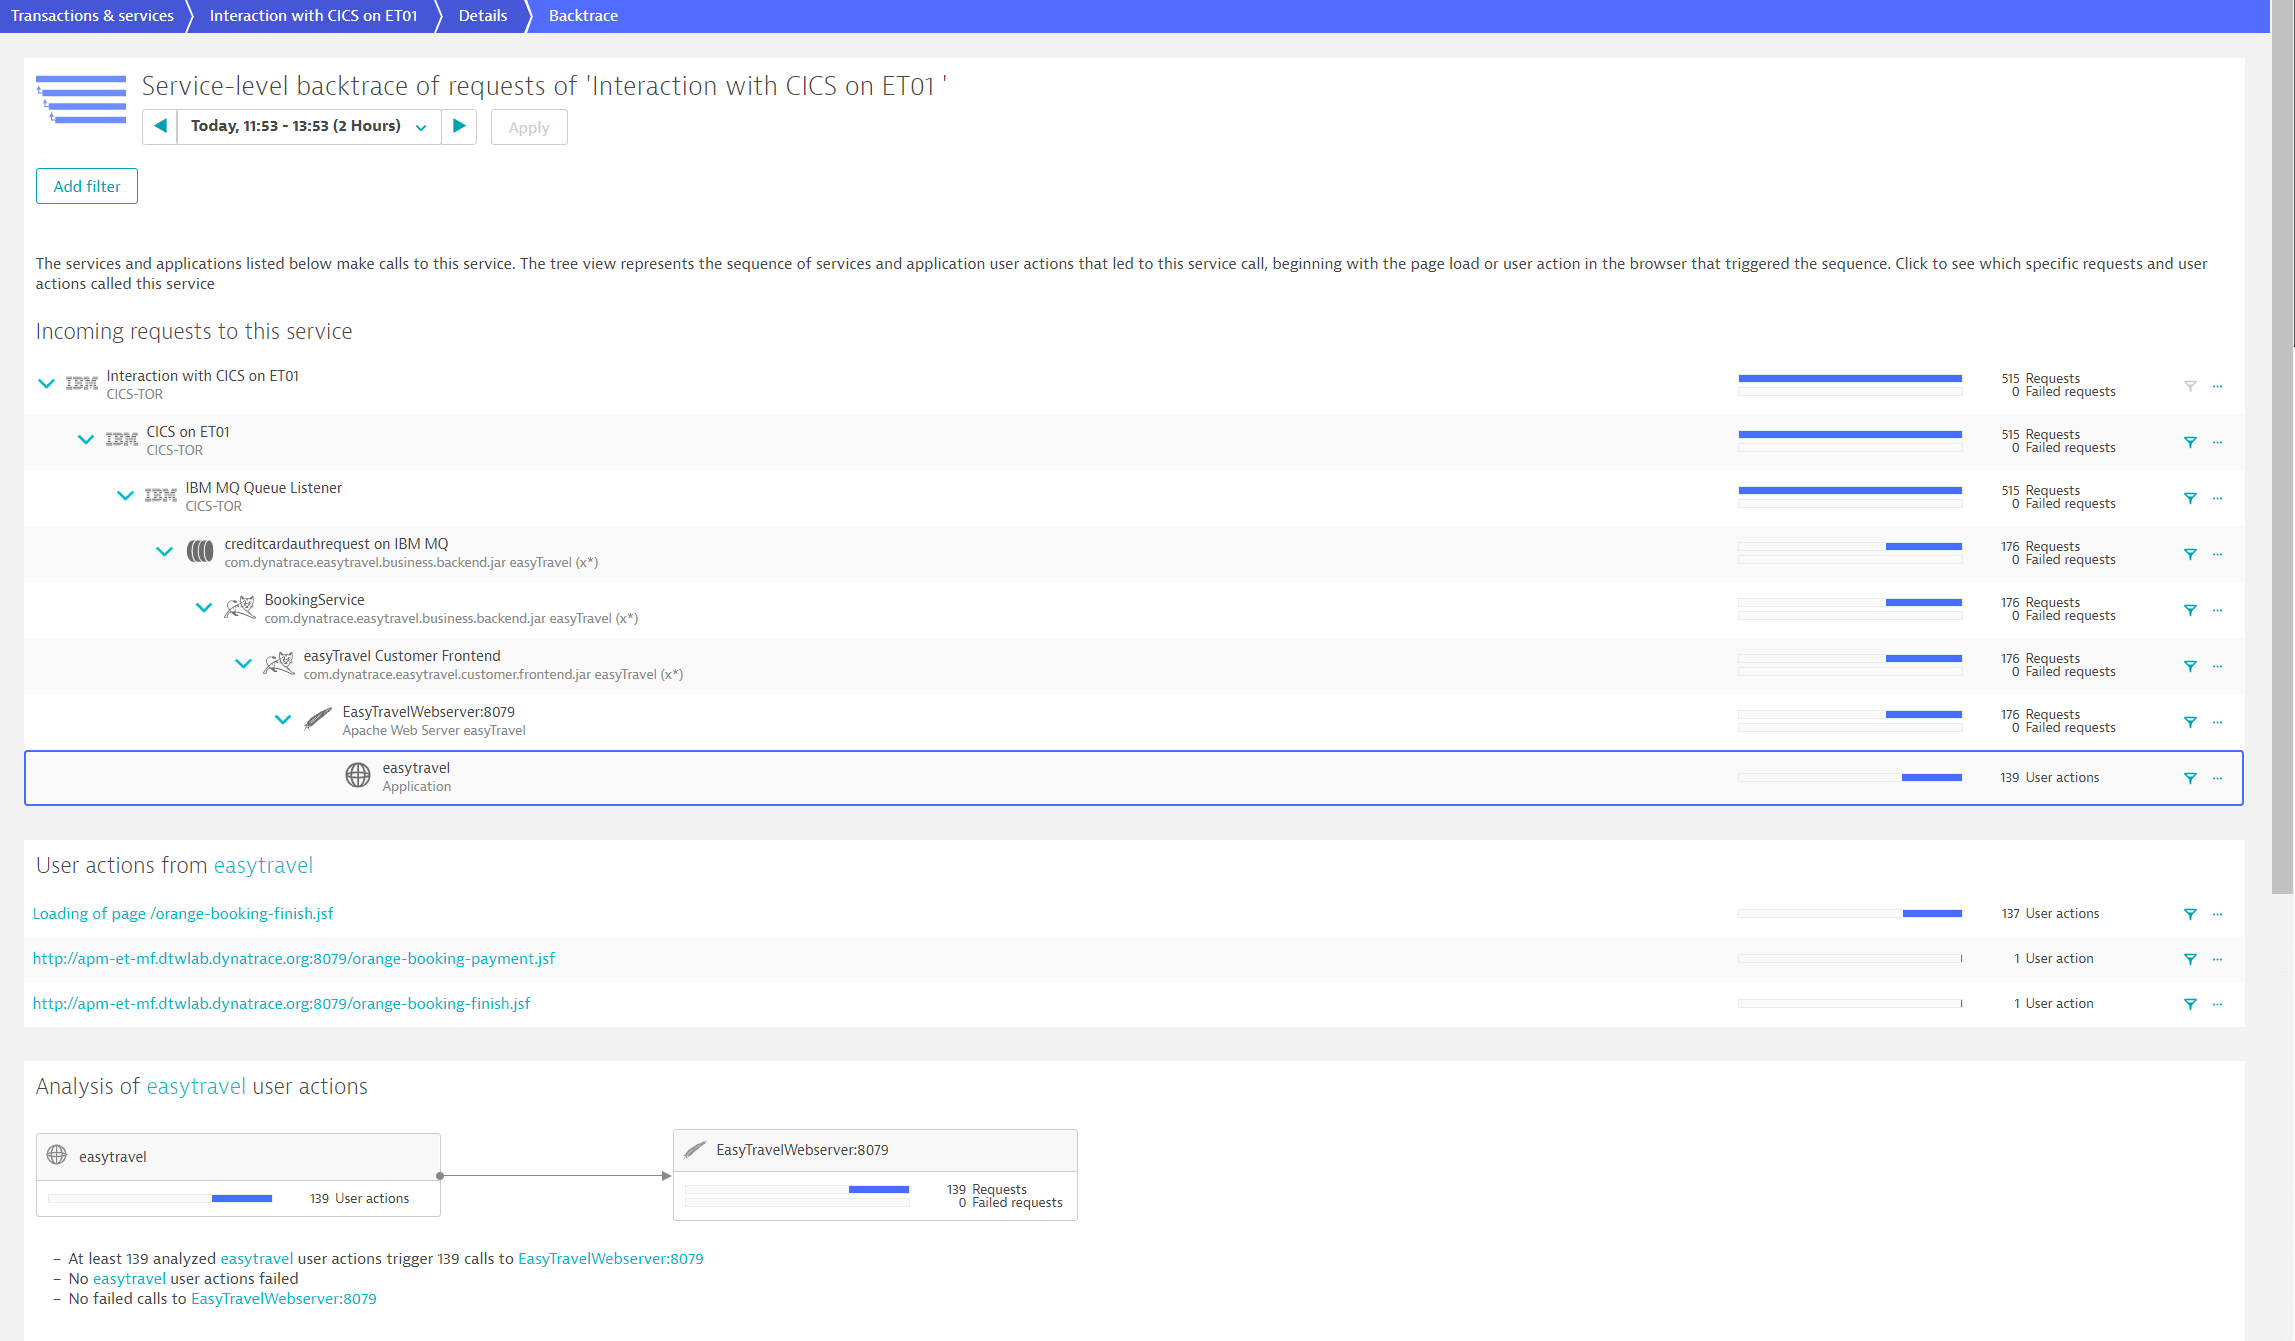
Who's calling?
Quickly trace every transaction — end-to-end — through messaging services and database interactions, opening up what was previously a black box.
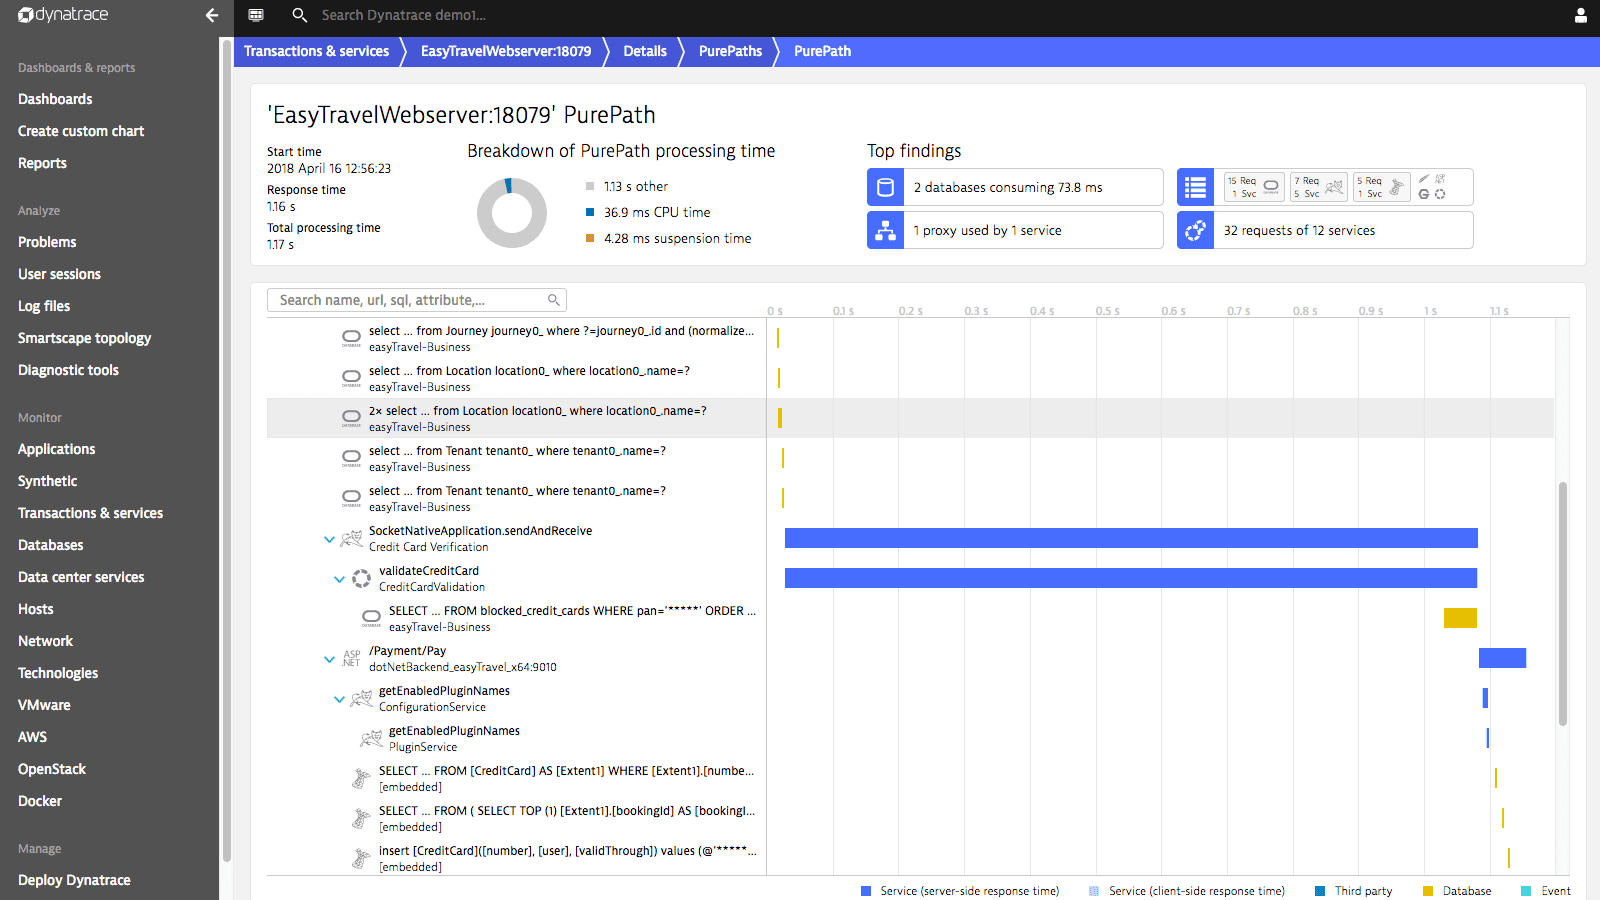
Go from user click to code-level in seconds
Dynatrace has you covered with deep, code-level visibility into each CICS and IMS service, including database statements to DB2 or DL/I.
Dynatrace uses patented PurePath Technology® to capture timing and code-level context for every transaction, across every tier, without gaps or blind spots.

Understand your workloads to significantly reduce the cost of your mainframe
- Easily separate cloud and mobile workload from the rest of the workload using CICS and IMS agents
- As these workloads grow, Dynatrace 24x7 “always on” transaction tracing and accounting collects the data you need to lower IBM pricing
- Exploit IBM zWPC Workload Pricing for Cloud (zWPC) and IBM Z Mobile Workload Pricing to reduce the bill for IBM up to 60% (lower monthly R4HA)
Ready to put the Dynatrace platform to work?
Connect with an observability expert for a live, custom demo of the Dynatrace platform.


