
Default settings are helpful because they allow you to get your applications and services up and running quickly. This is awesome for getting started with development, but you may run into issues when you move your application into production.
Here’s how to check your database for a few easy-to-overlook-but-easy-to-fixTM issues in under two minutes.
Check for administrative overhead
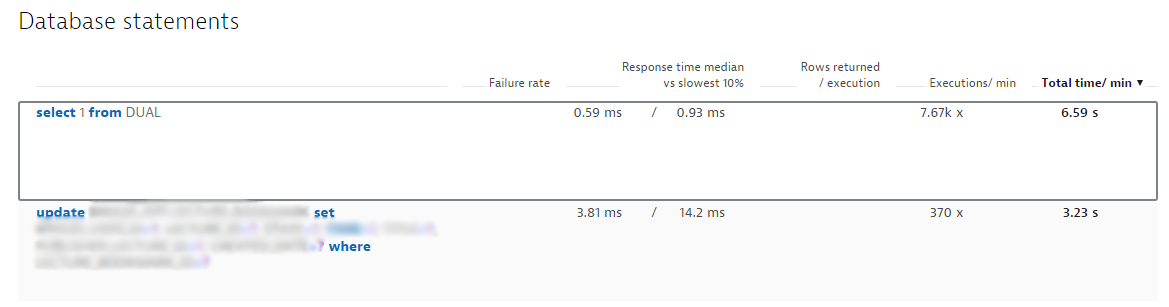
The above list depicts one of our largest customer’s database statements. As you can see, SELECT 1 from DUAL is by far the most common database call (there were many more calls listed, but I got tired of blurring the statements so I cropped them). This statement is only used by the application’s connection pool to find out if the connection is still alive.
So, 7 seconds per minute (i.e., more than 10 %) of database time is used for this single, “administrative” database call. You can usually change this setting in your connection pool’s settings. For example, there are two Tomcat connection pool settings for this:
timeBetweenEvictionRunsMillis |
(int) The number of milliseconds to sleep between runs of the idle connection validation/cleaner thread. This value should not be set under 1 second. It dictates how often we check for idle, abandoned connections, and how often we validate idle connections. The default value is 5000 (5 seconds). |
validationInterval |
(long) avoid excess validation, only run validation at most at this frequency – time in milliseconds. If a connection is due for validation, but has been validated previously within this interval, it will not be validated again. The default value is 30000 (30 seconds). |
Consider if you even need this call
After a quick visit to Google I learned that this call may not even be necessary. According to the Sun GlassFish Enterprise Server Performance Tuning Guide,
If the database connectivity is reliable, you can omit validation.
No one knows your infrastructure better than you, so the decision is up to you. Chances are however that this is a case of a default value that’s not set properly for your environment.
Another default value to evaluate: Fetch size
Dynatrace not only shows you the number of rows returned by each database statement, it also shows the number of fetches that were performed:
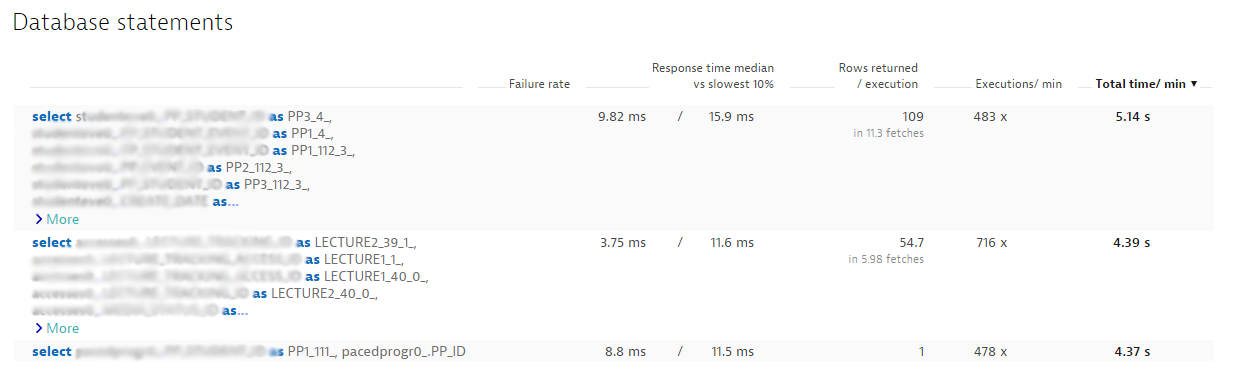
The first entry in the screenshot above (blurred and cropped for obvious reasons) shows that for the relatively small result set of 109 rows and the short response time of 9.82 ms, 11.3 fetches were made. The reason is simple: JDBC’s default fetch size value is set to 10.
I’m convinced that increasing the fetch size to somewhere up in the hundreds could be beneficial to the infrastructure as a whole. 10 ms for a query isn’t bad, but the query is executed about 483 times per minute, which equates to over 5 seconds of total time.
My advice to you: Check your default database settings and experiment with the values. Have some of your most common database statements available to use as benchmarks and run some load tests. I’m pretty sure your performance will improve, especially during increasing load.
If you have another five minutes…
So now you know about two examples of potential database issues that you can investigate in under two minutes. Setting values is easy; finding the best values will take a little more time.
For more in-depth database-performance tuning tips, check out our Five easy steps to improve database performance article.
You’ll be amazed…
…at how simply sorting your database calls by total execution time enables you to identify database performance issues. So, I suggest you open Dynatrace, select your database services, and have a look at the provided metrics.
All the screenshots in this post have been taken from Dynatrace, which allows you to identify database performance insights such as those discussed in this post, in addition to much more—often with only a single mouse click.
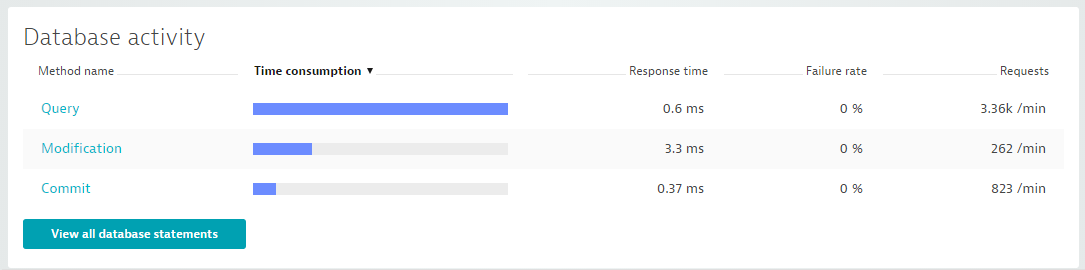
Viewing the metrics mentioned here is really easy, just click View all database statements on any Dynatrace database service page to get started!
Tweet your findings to @Dynatrace! We’d love to hear about and learn from them!


Looking for answers?
Start a new discussion or ask for help in our Q&A forum.
Go to forum