Observability für das Zeitalter der KI
Mit dem führenden Anbieter von KI-gestützten Observability-Lösungen können Sie Daten in Entscheidungen und autonome Maßnahmen umwandeln, die Ihr Unternehmen voranbringen.
Mithilfe von KI analysieren, automatisieren und innovativ sein
Probleme vermeiden, Arbeitsabläufe automatisieren und bessere, sicherere Software schneller bereitstellen.
-
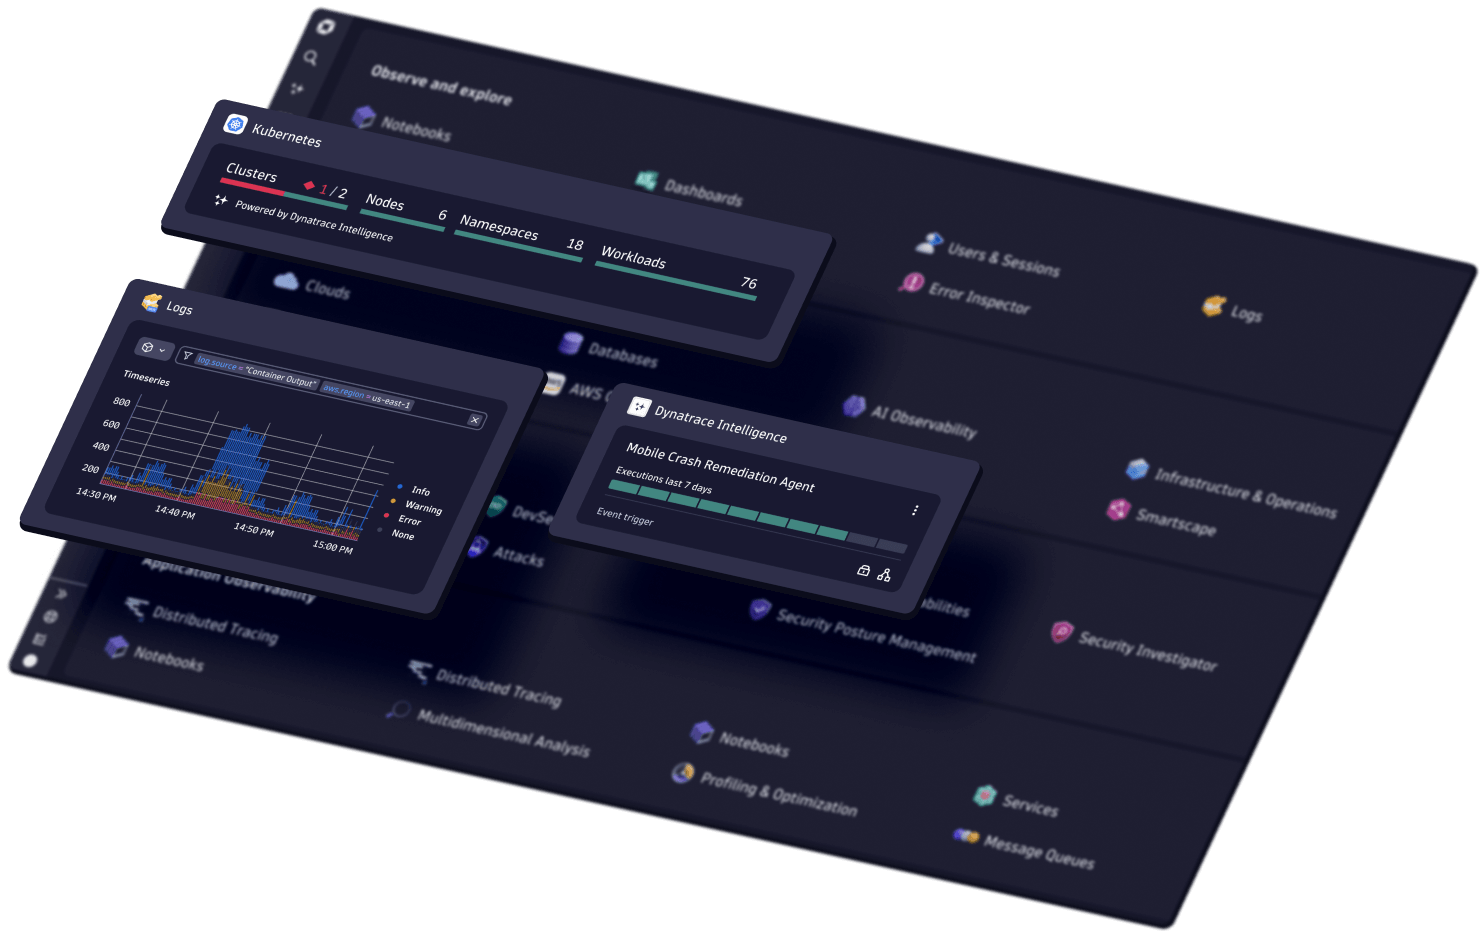
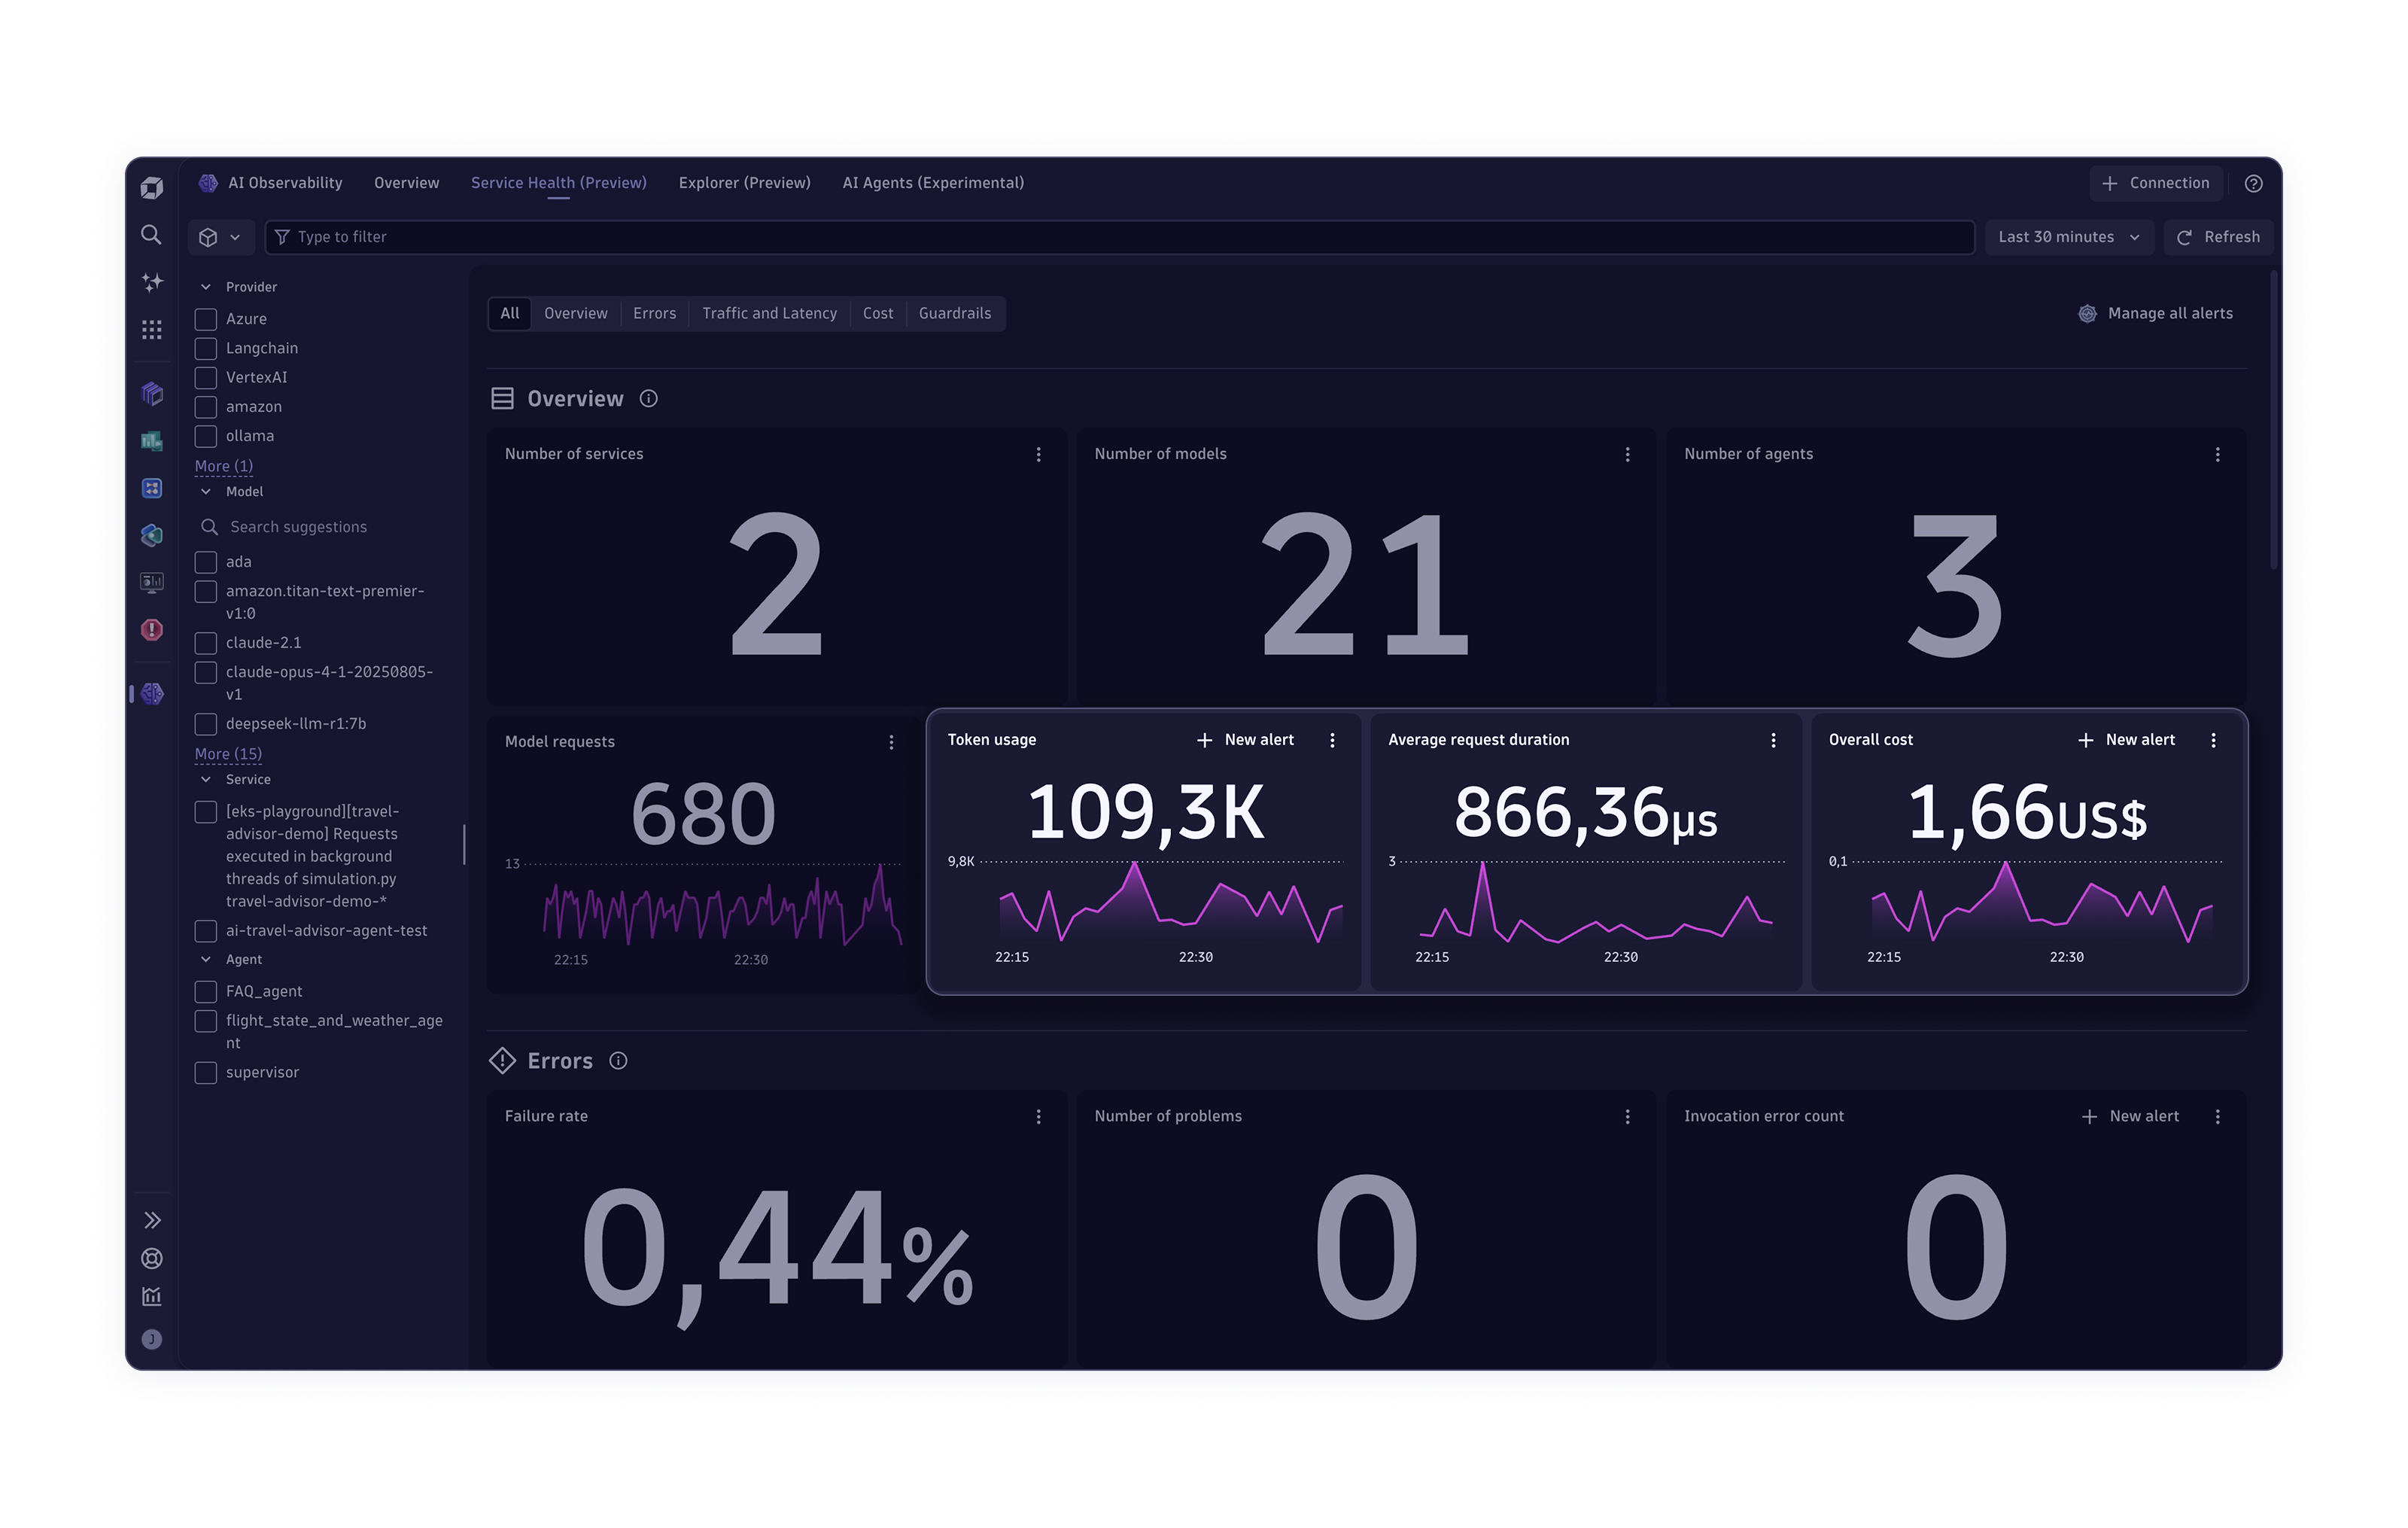
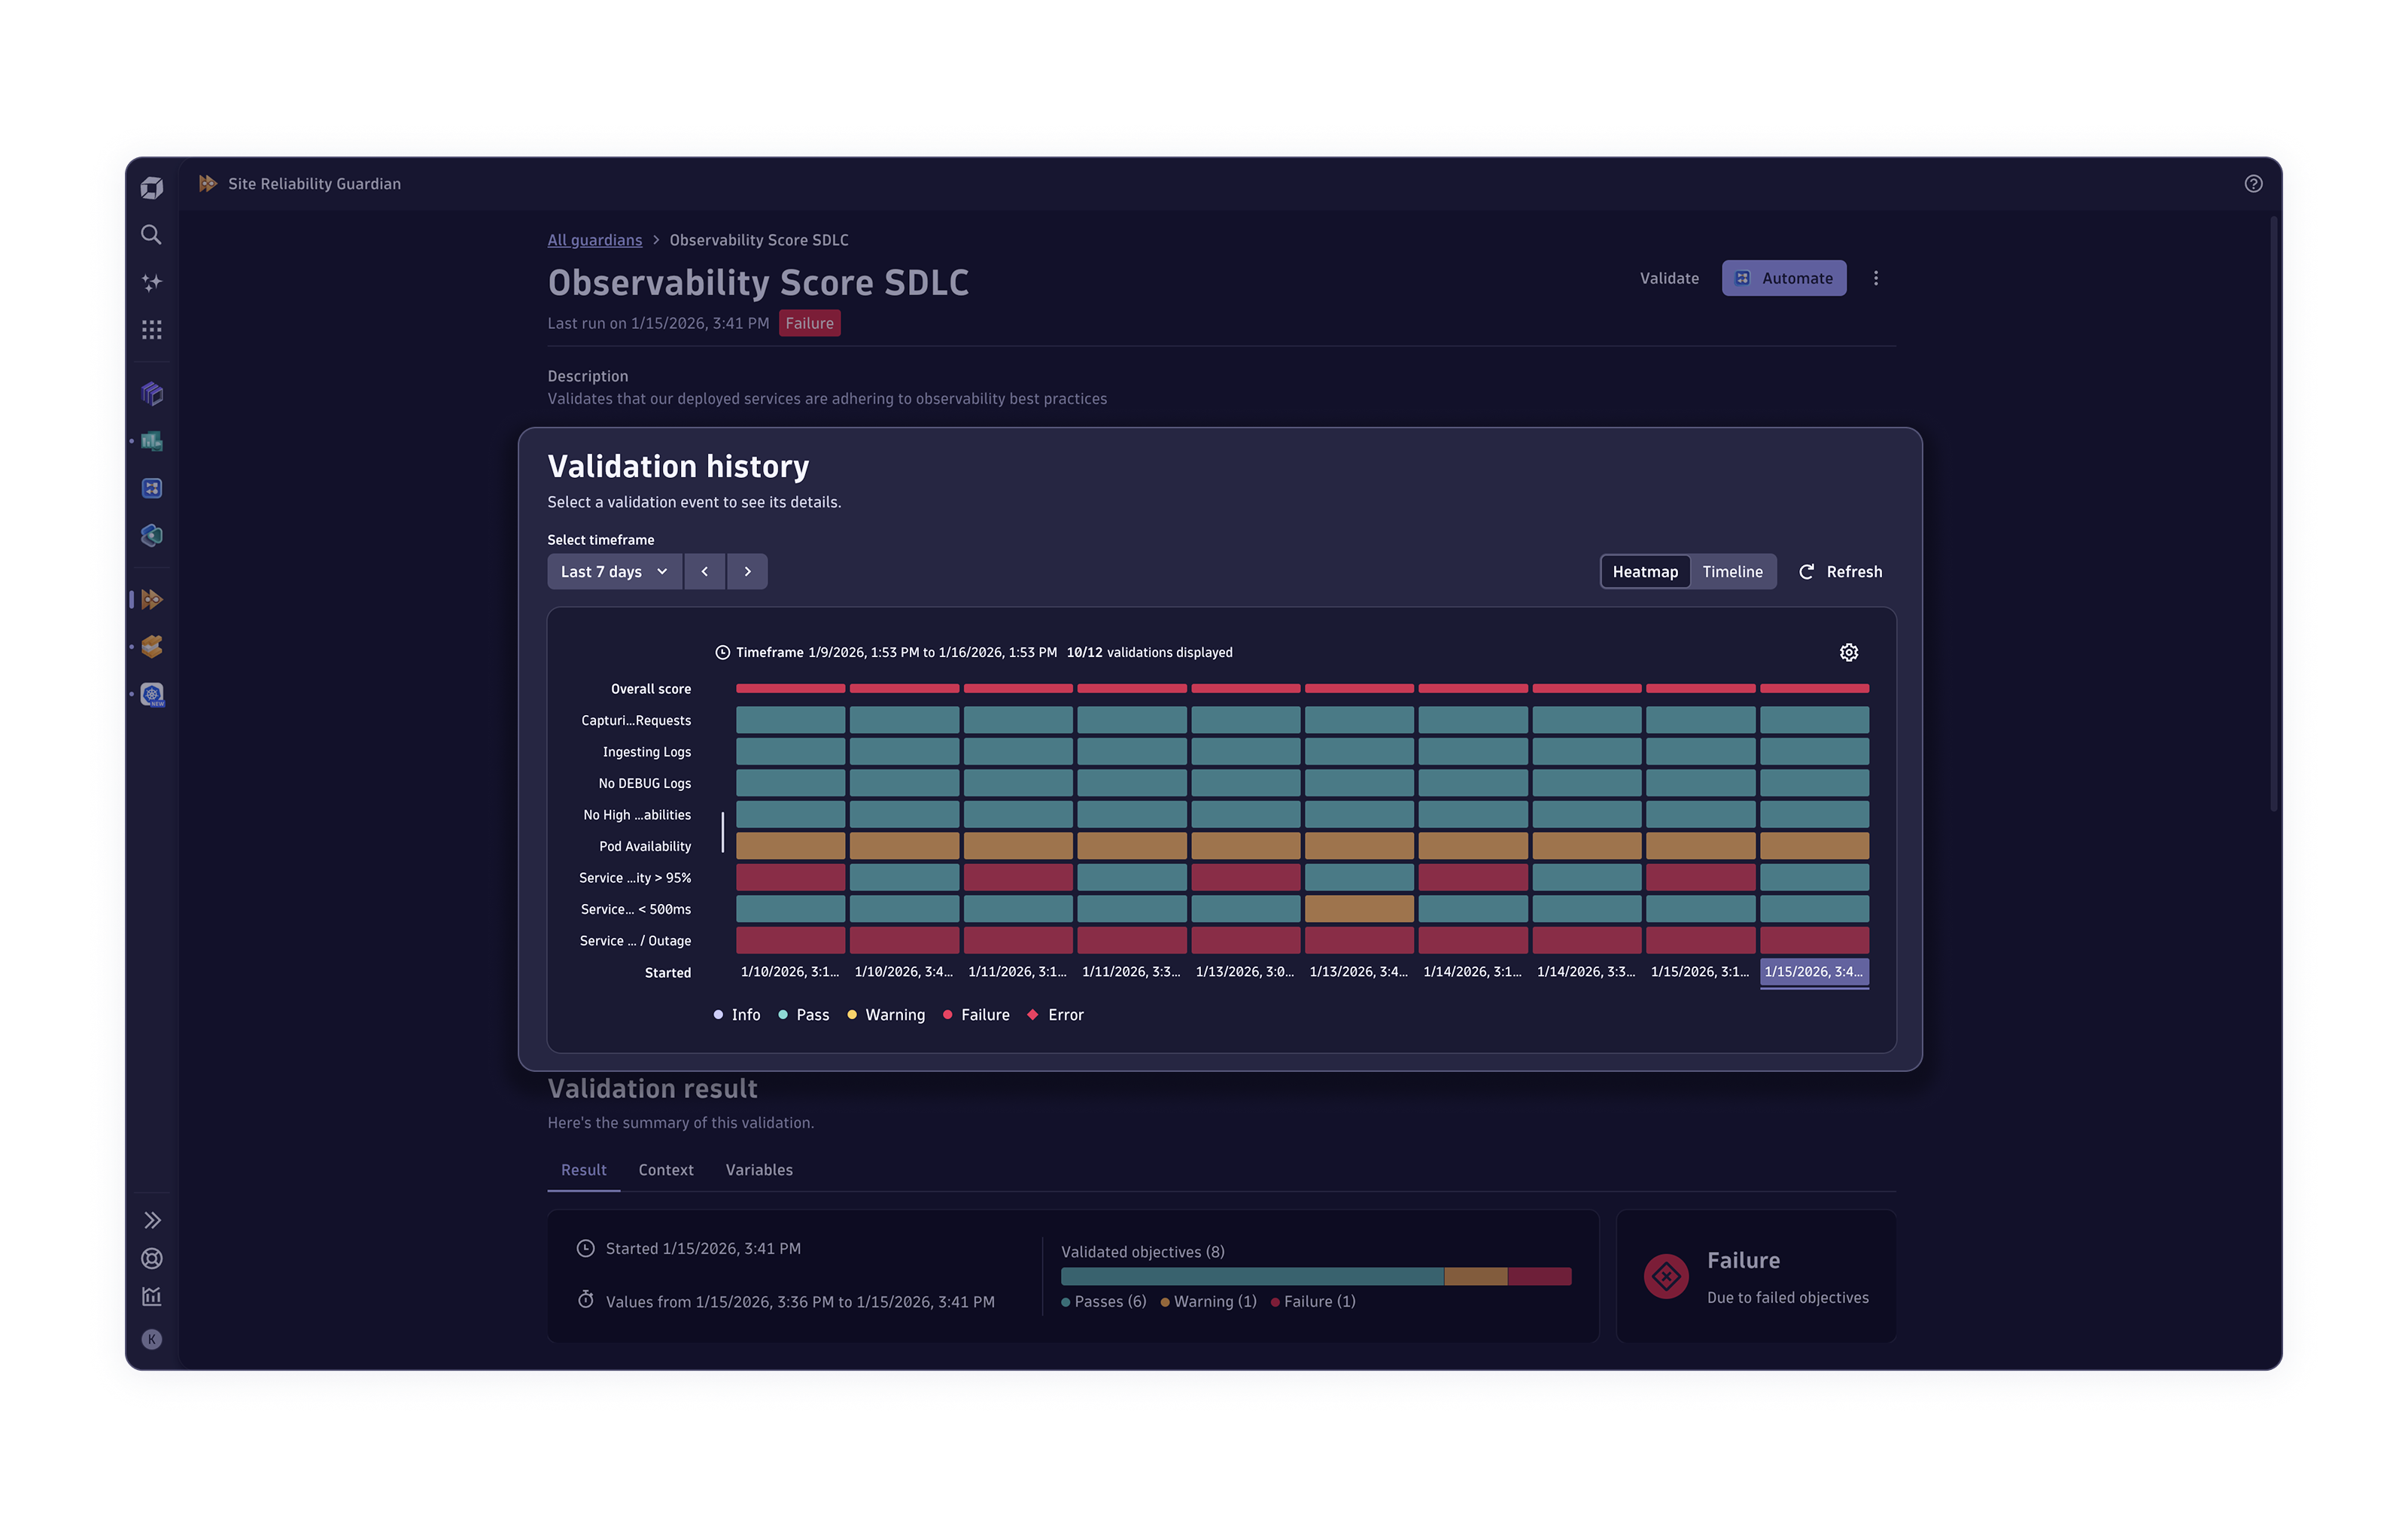
KI-Observability
-
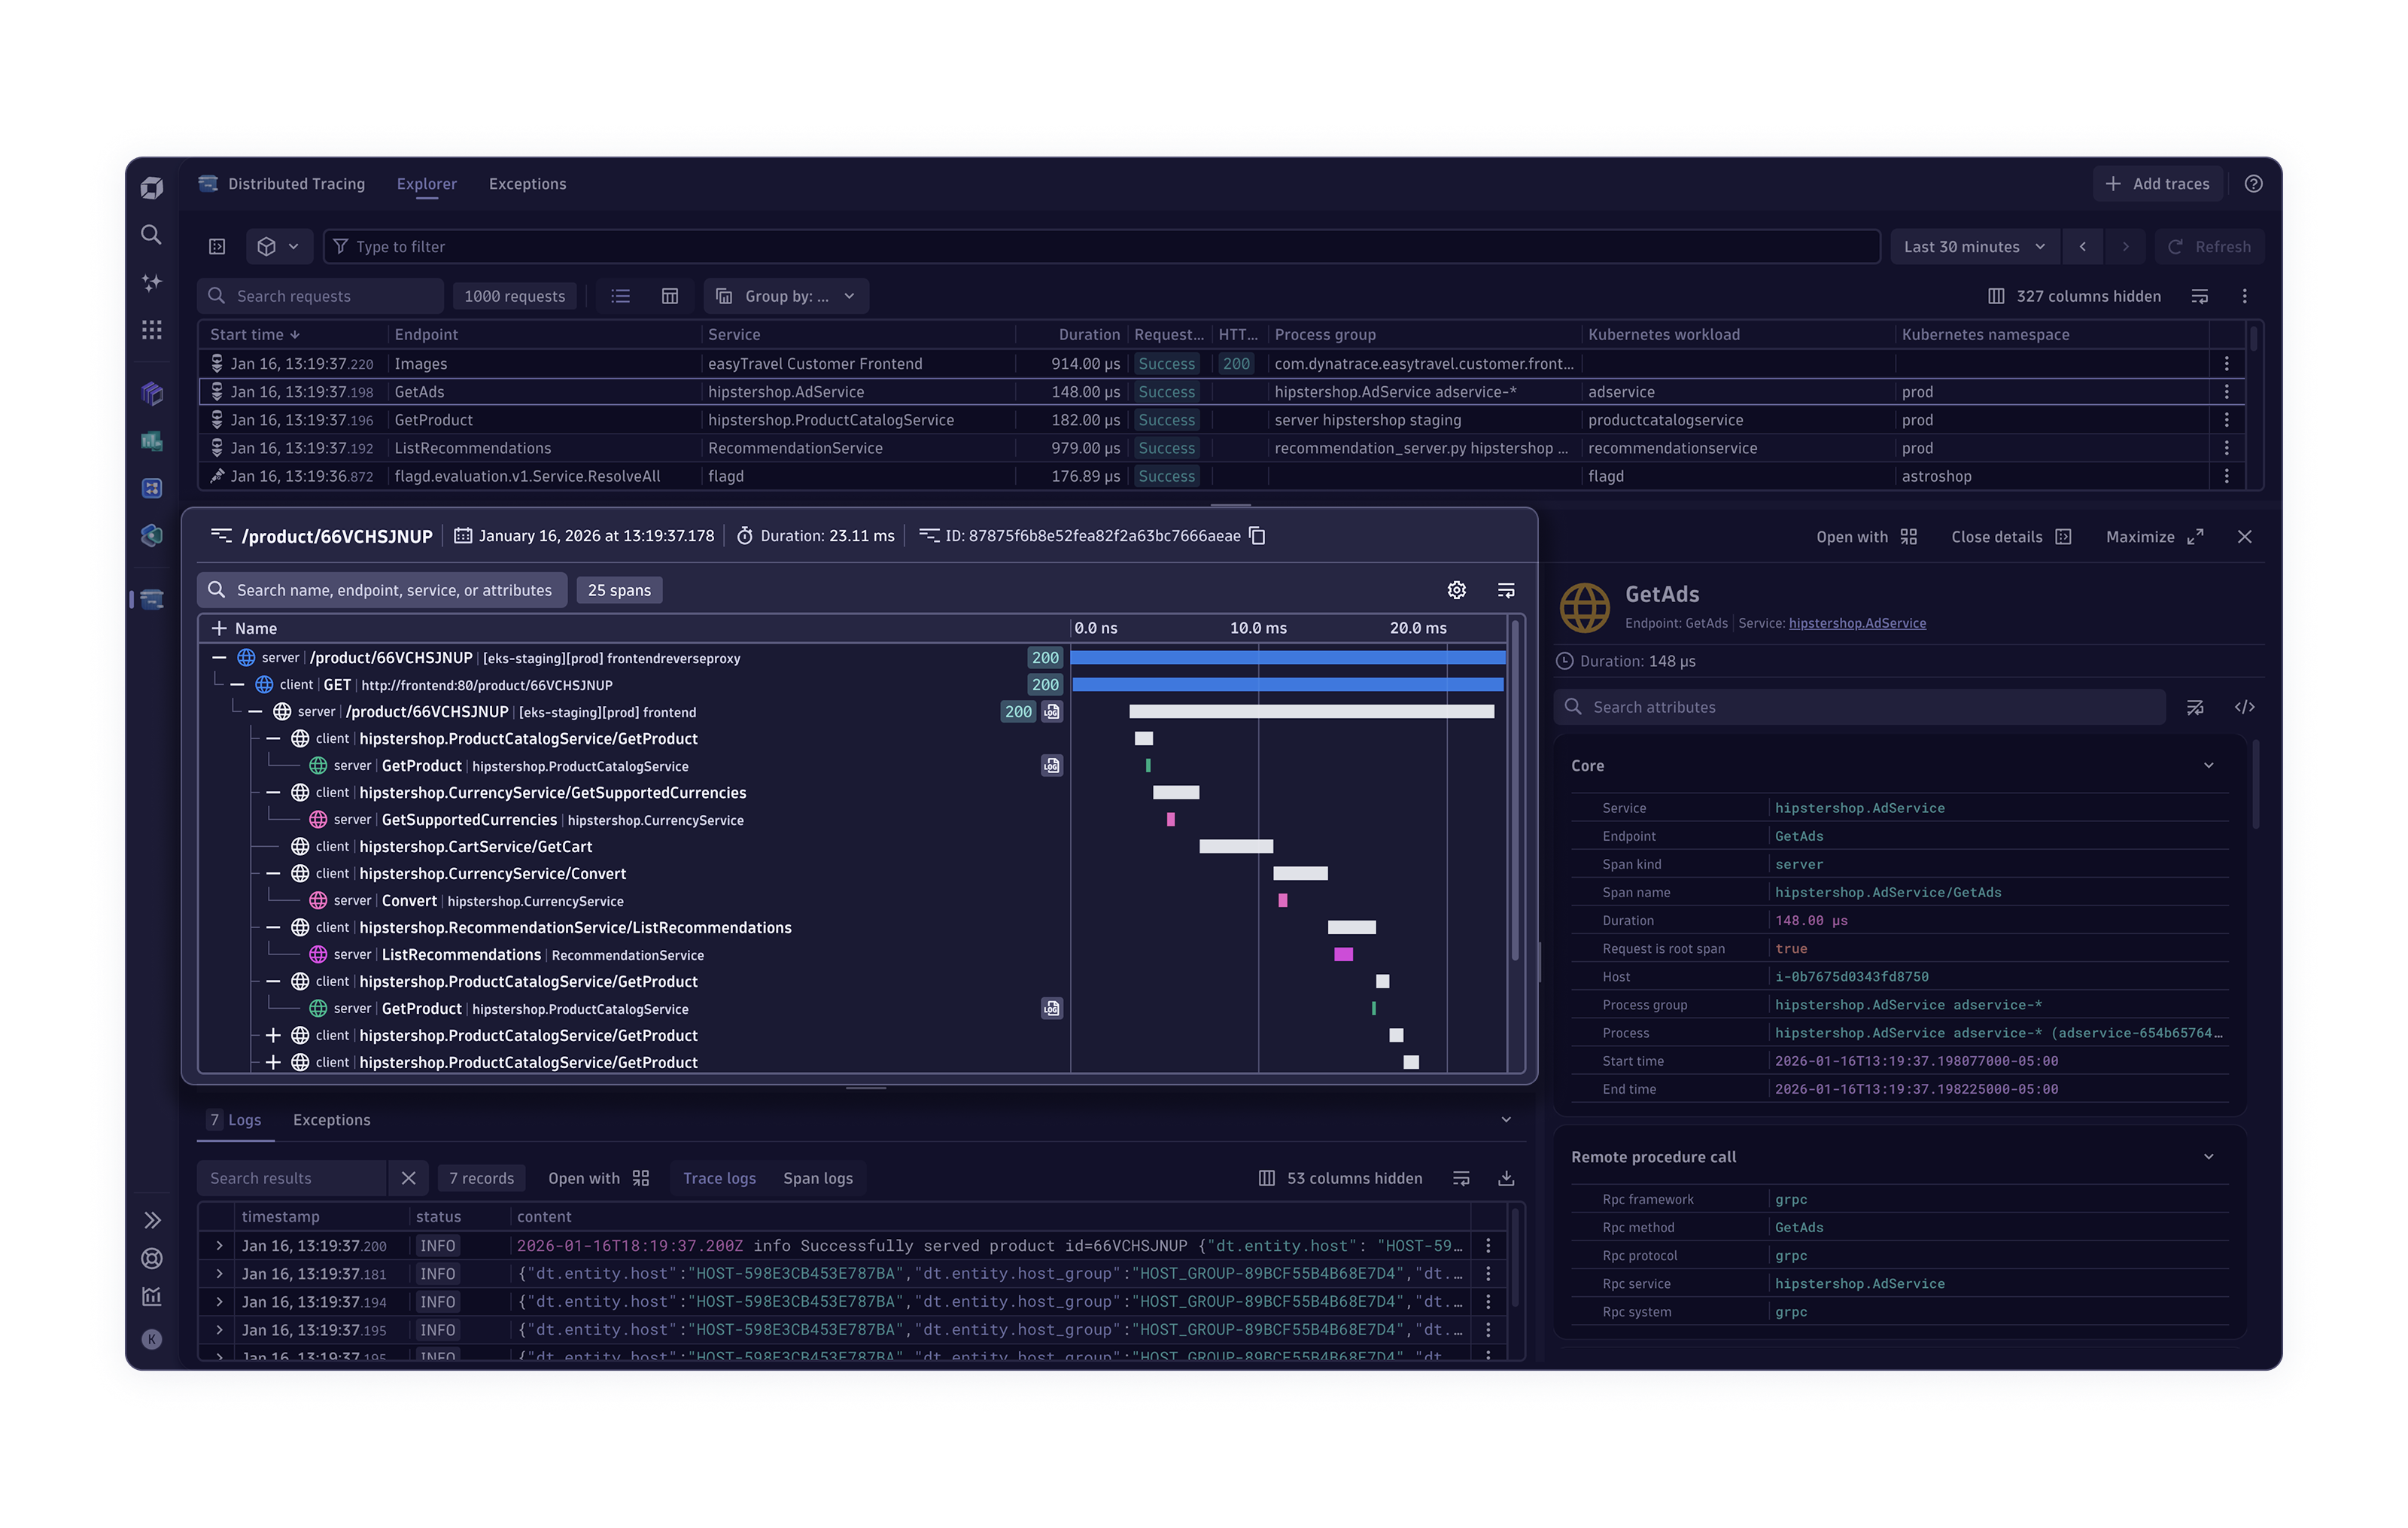
Anwendungs-Observability
-
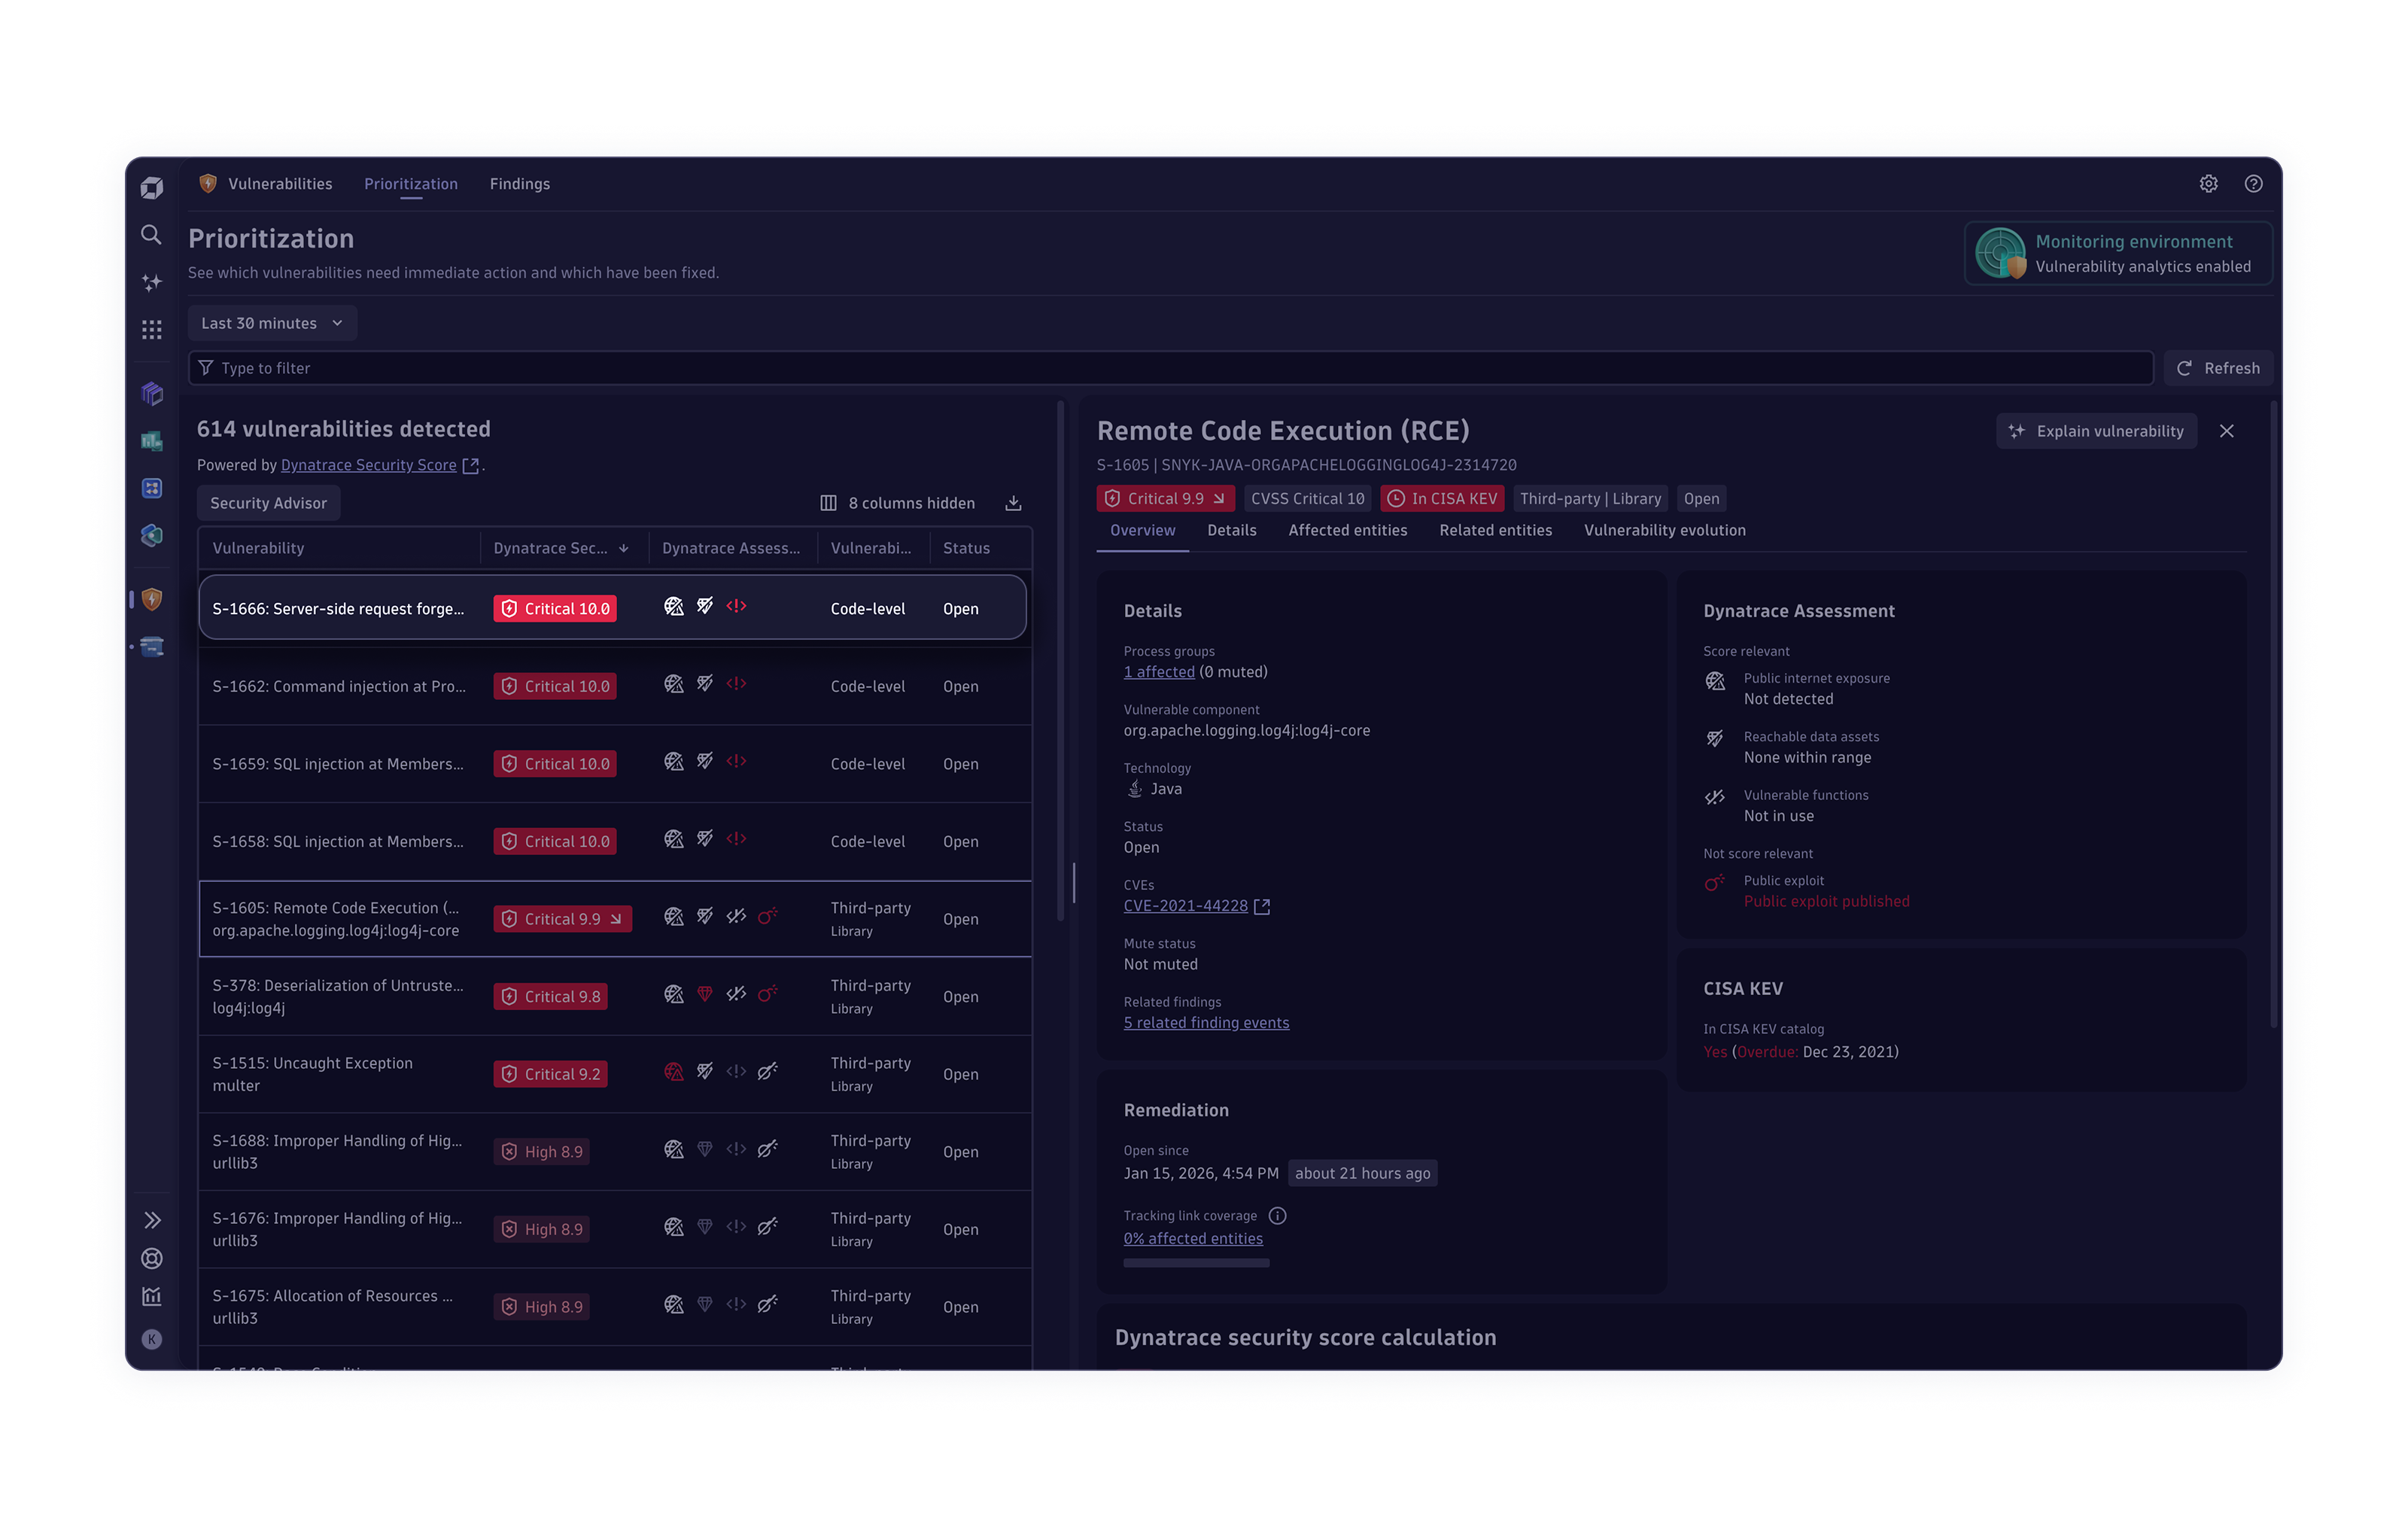
Anwendungssicherheit
-
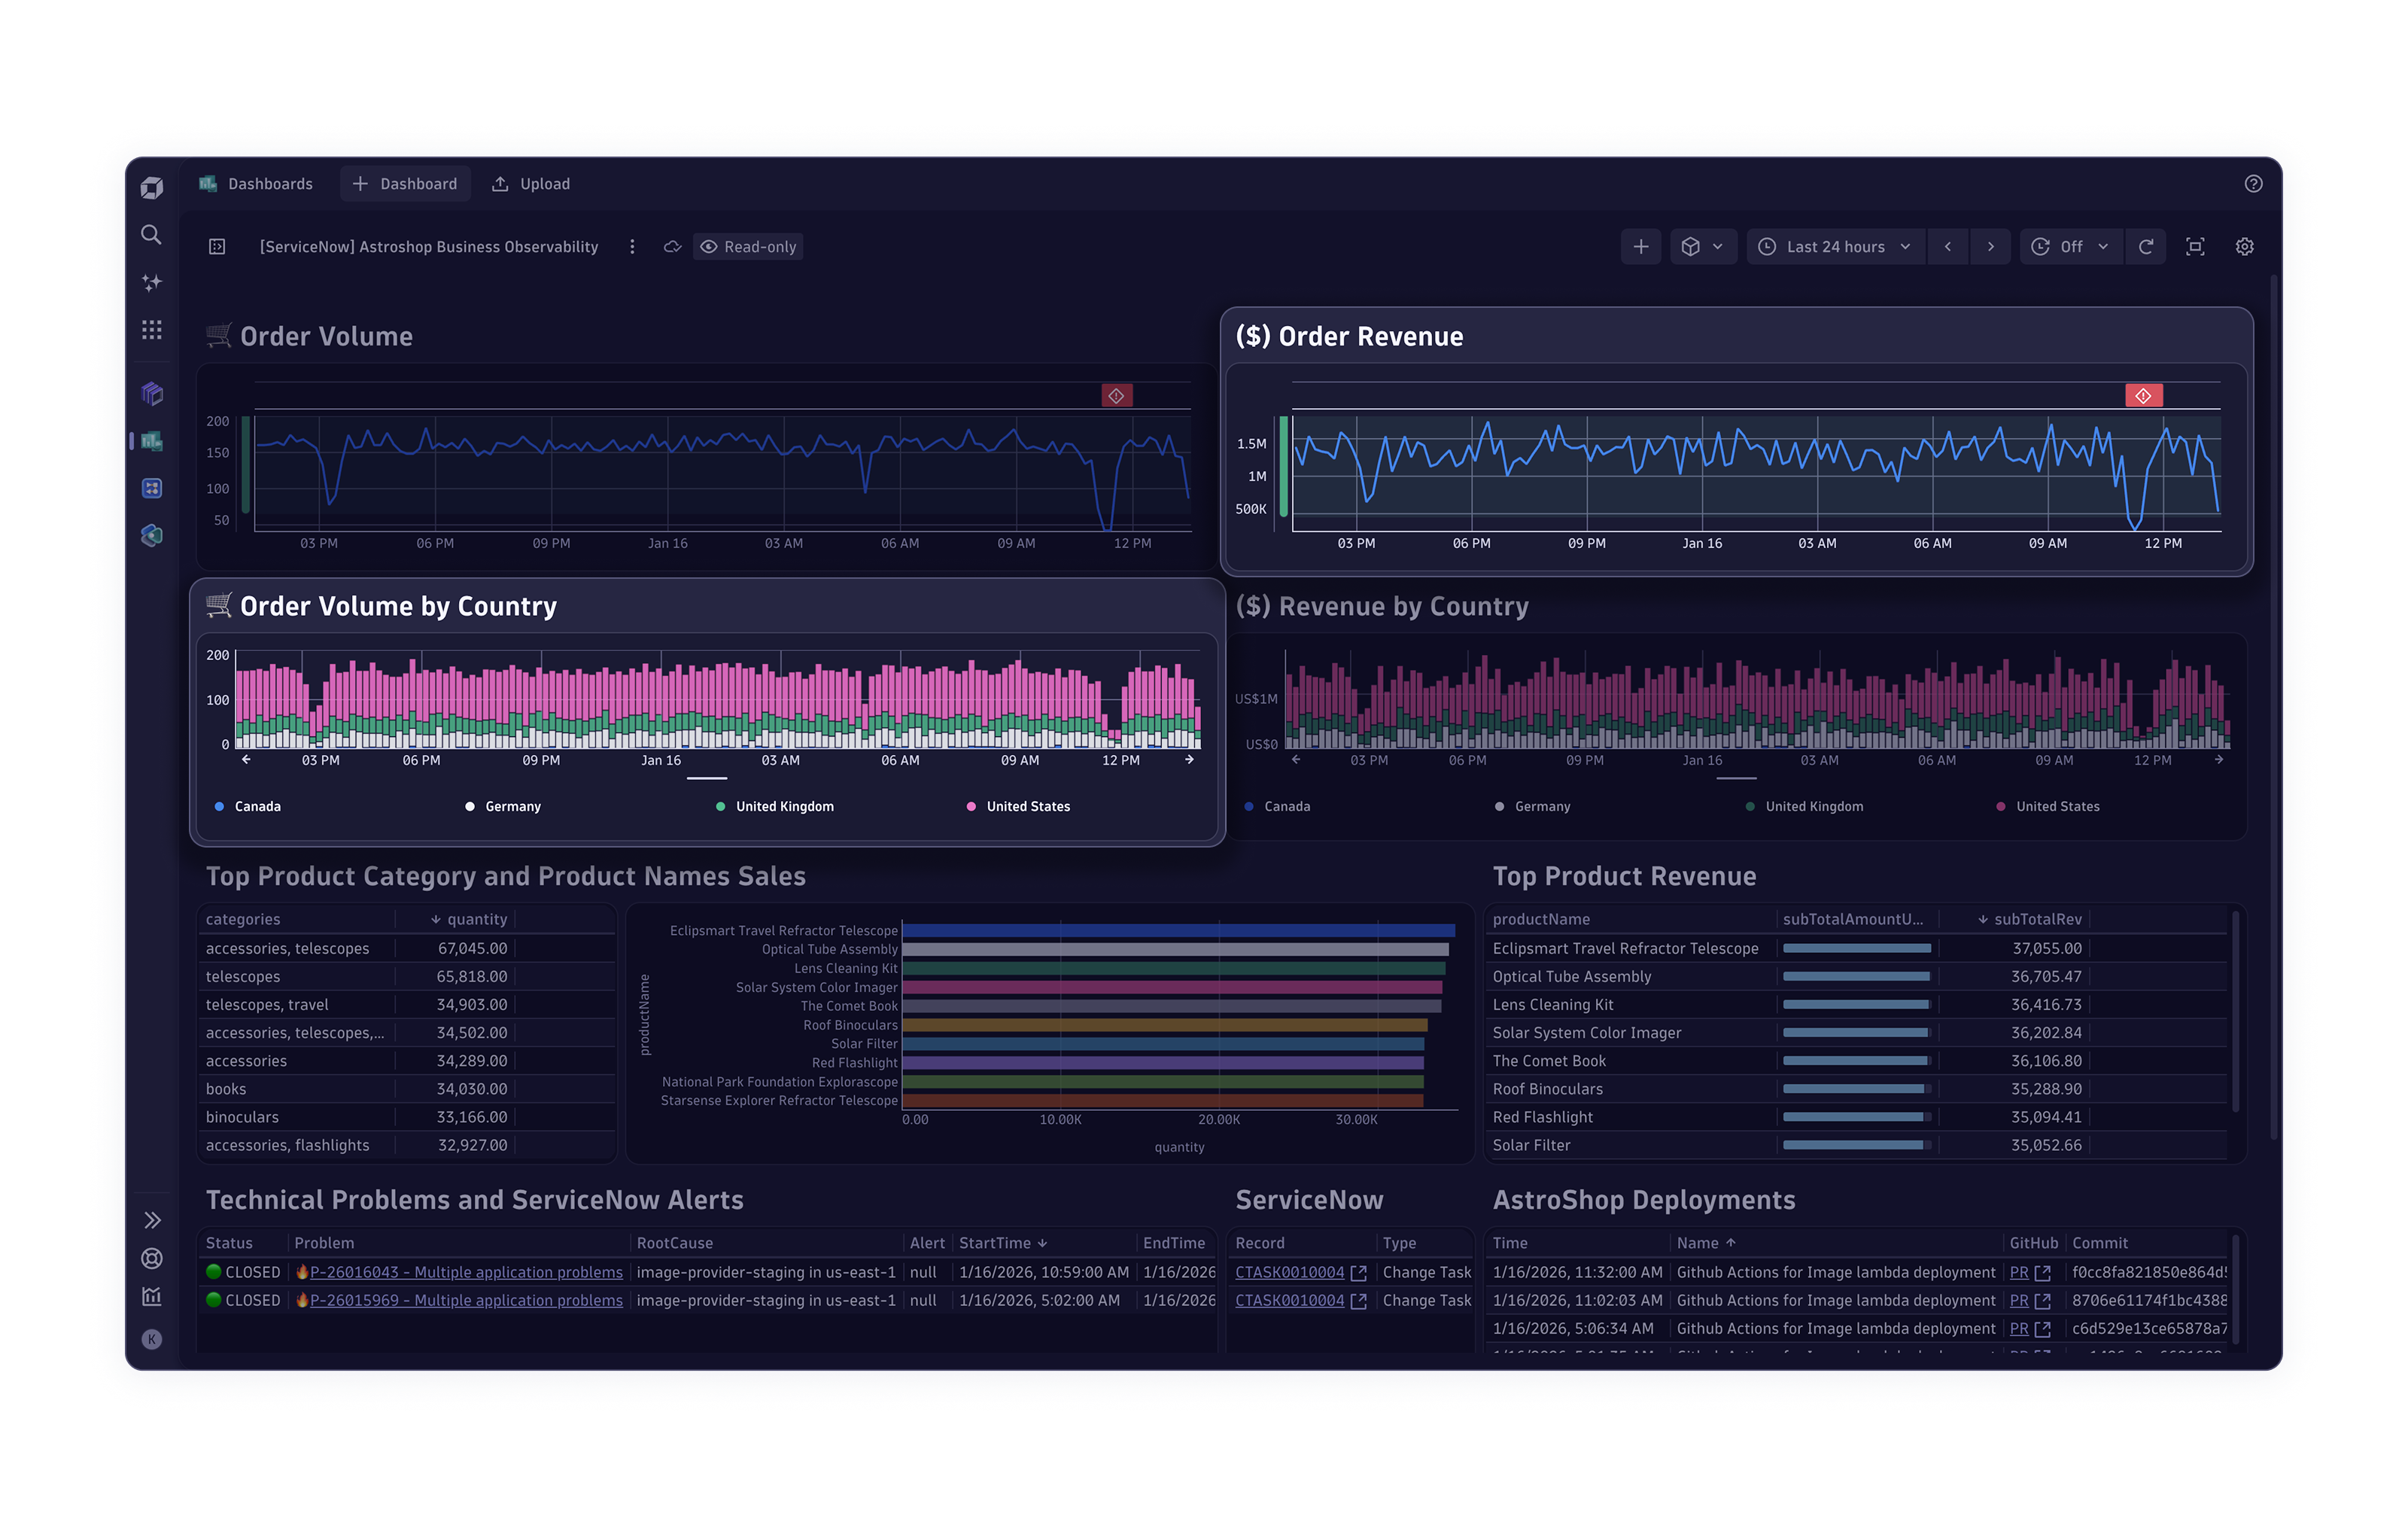
Observability für Unternehmen
-
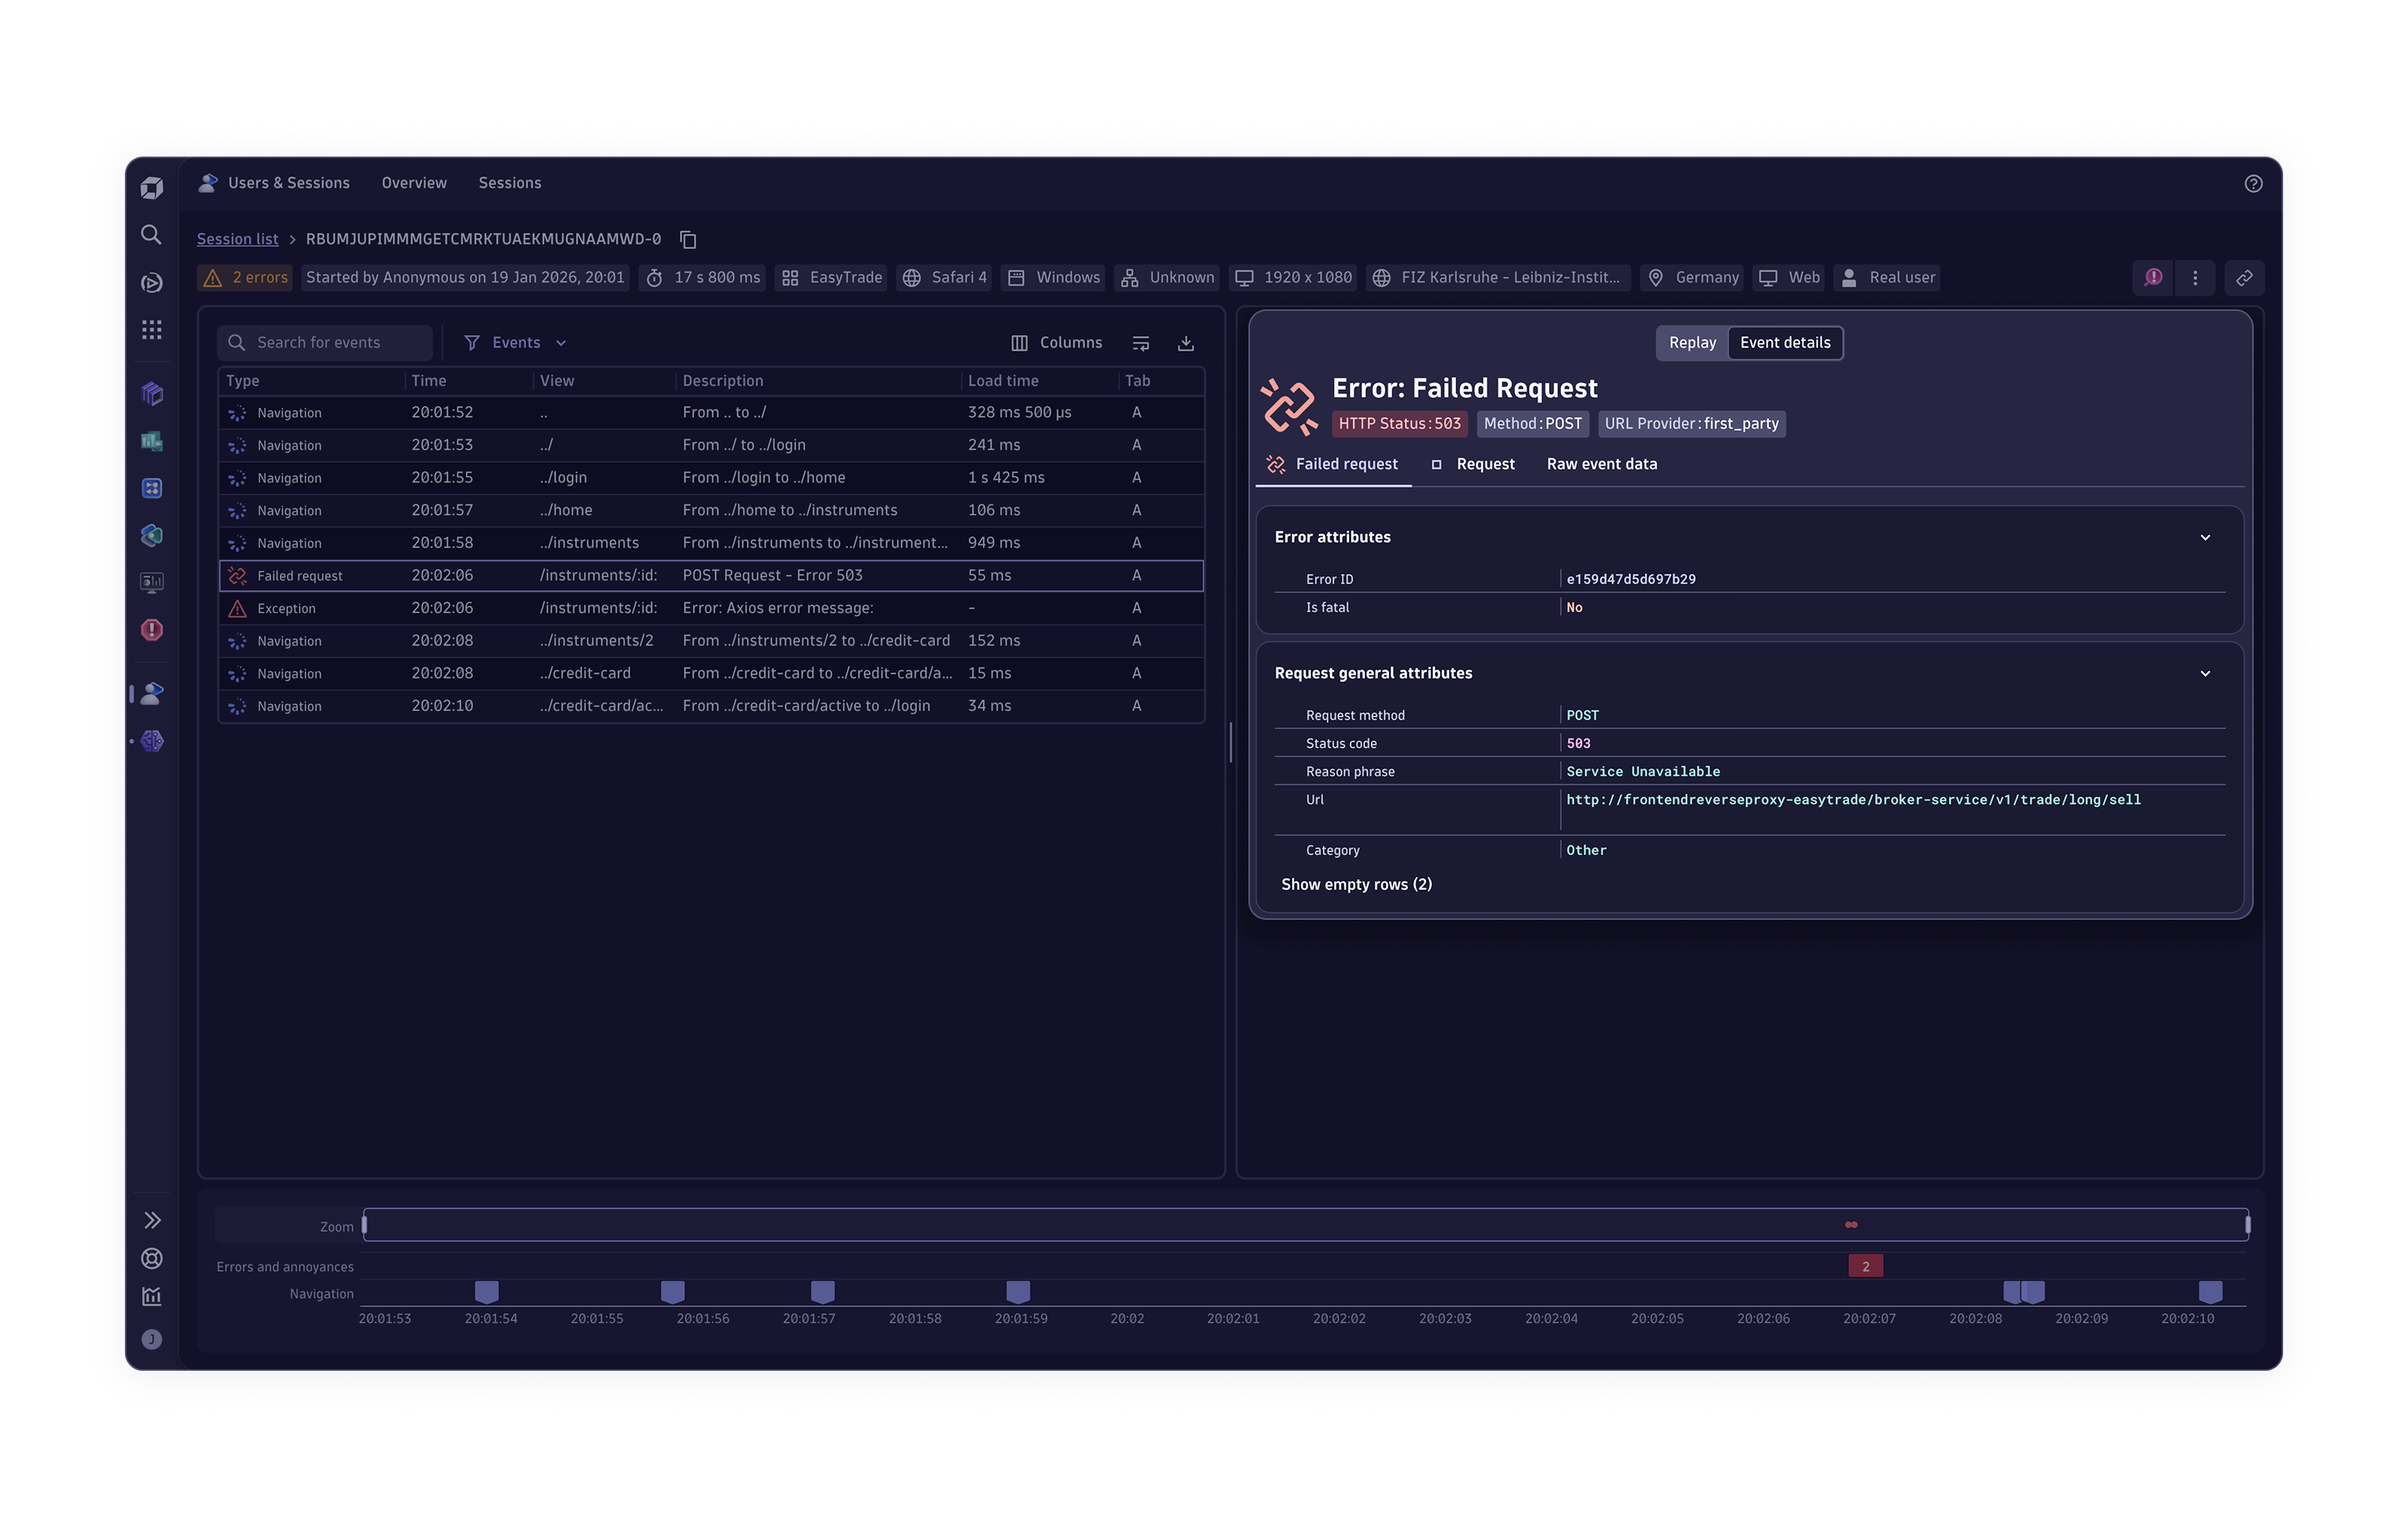
Digitale Angebote
-
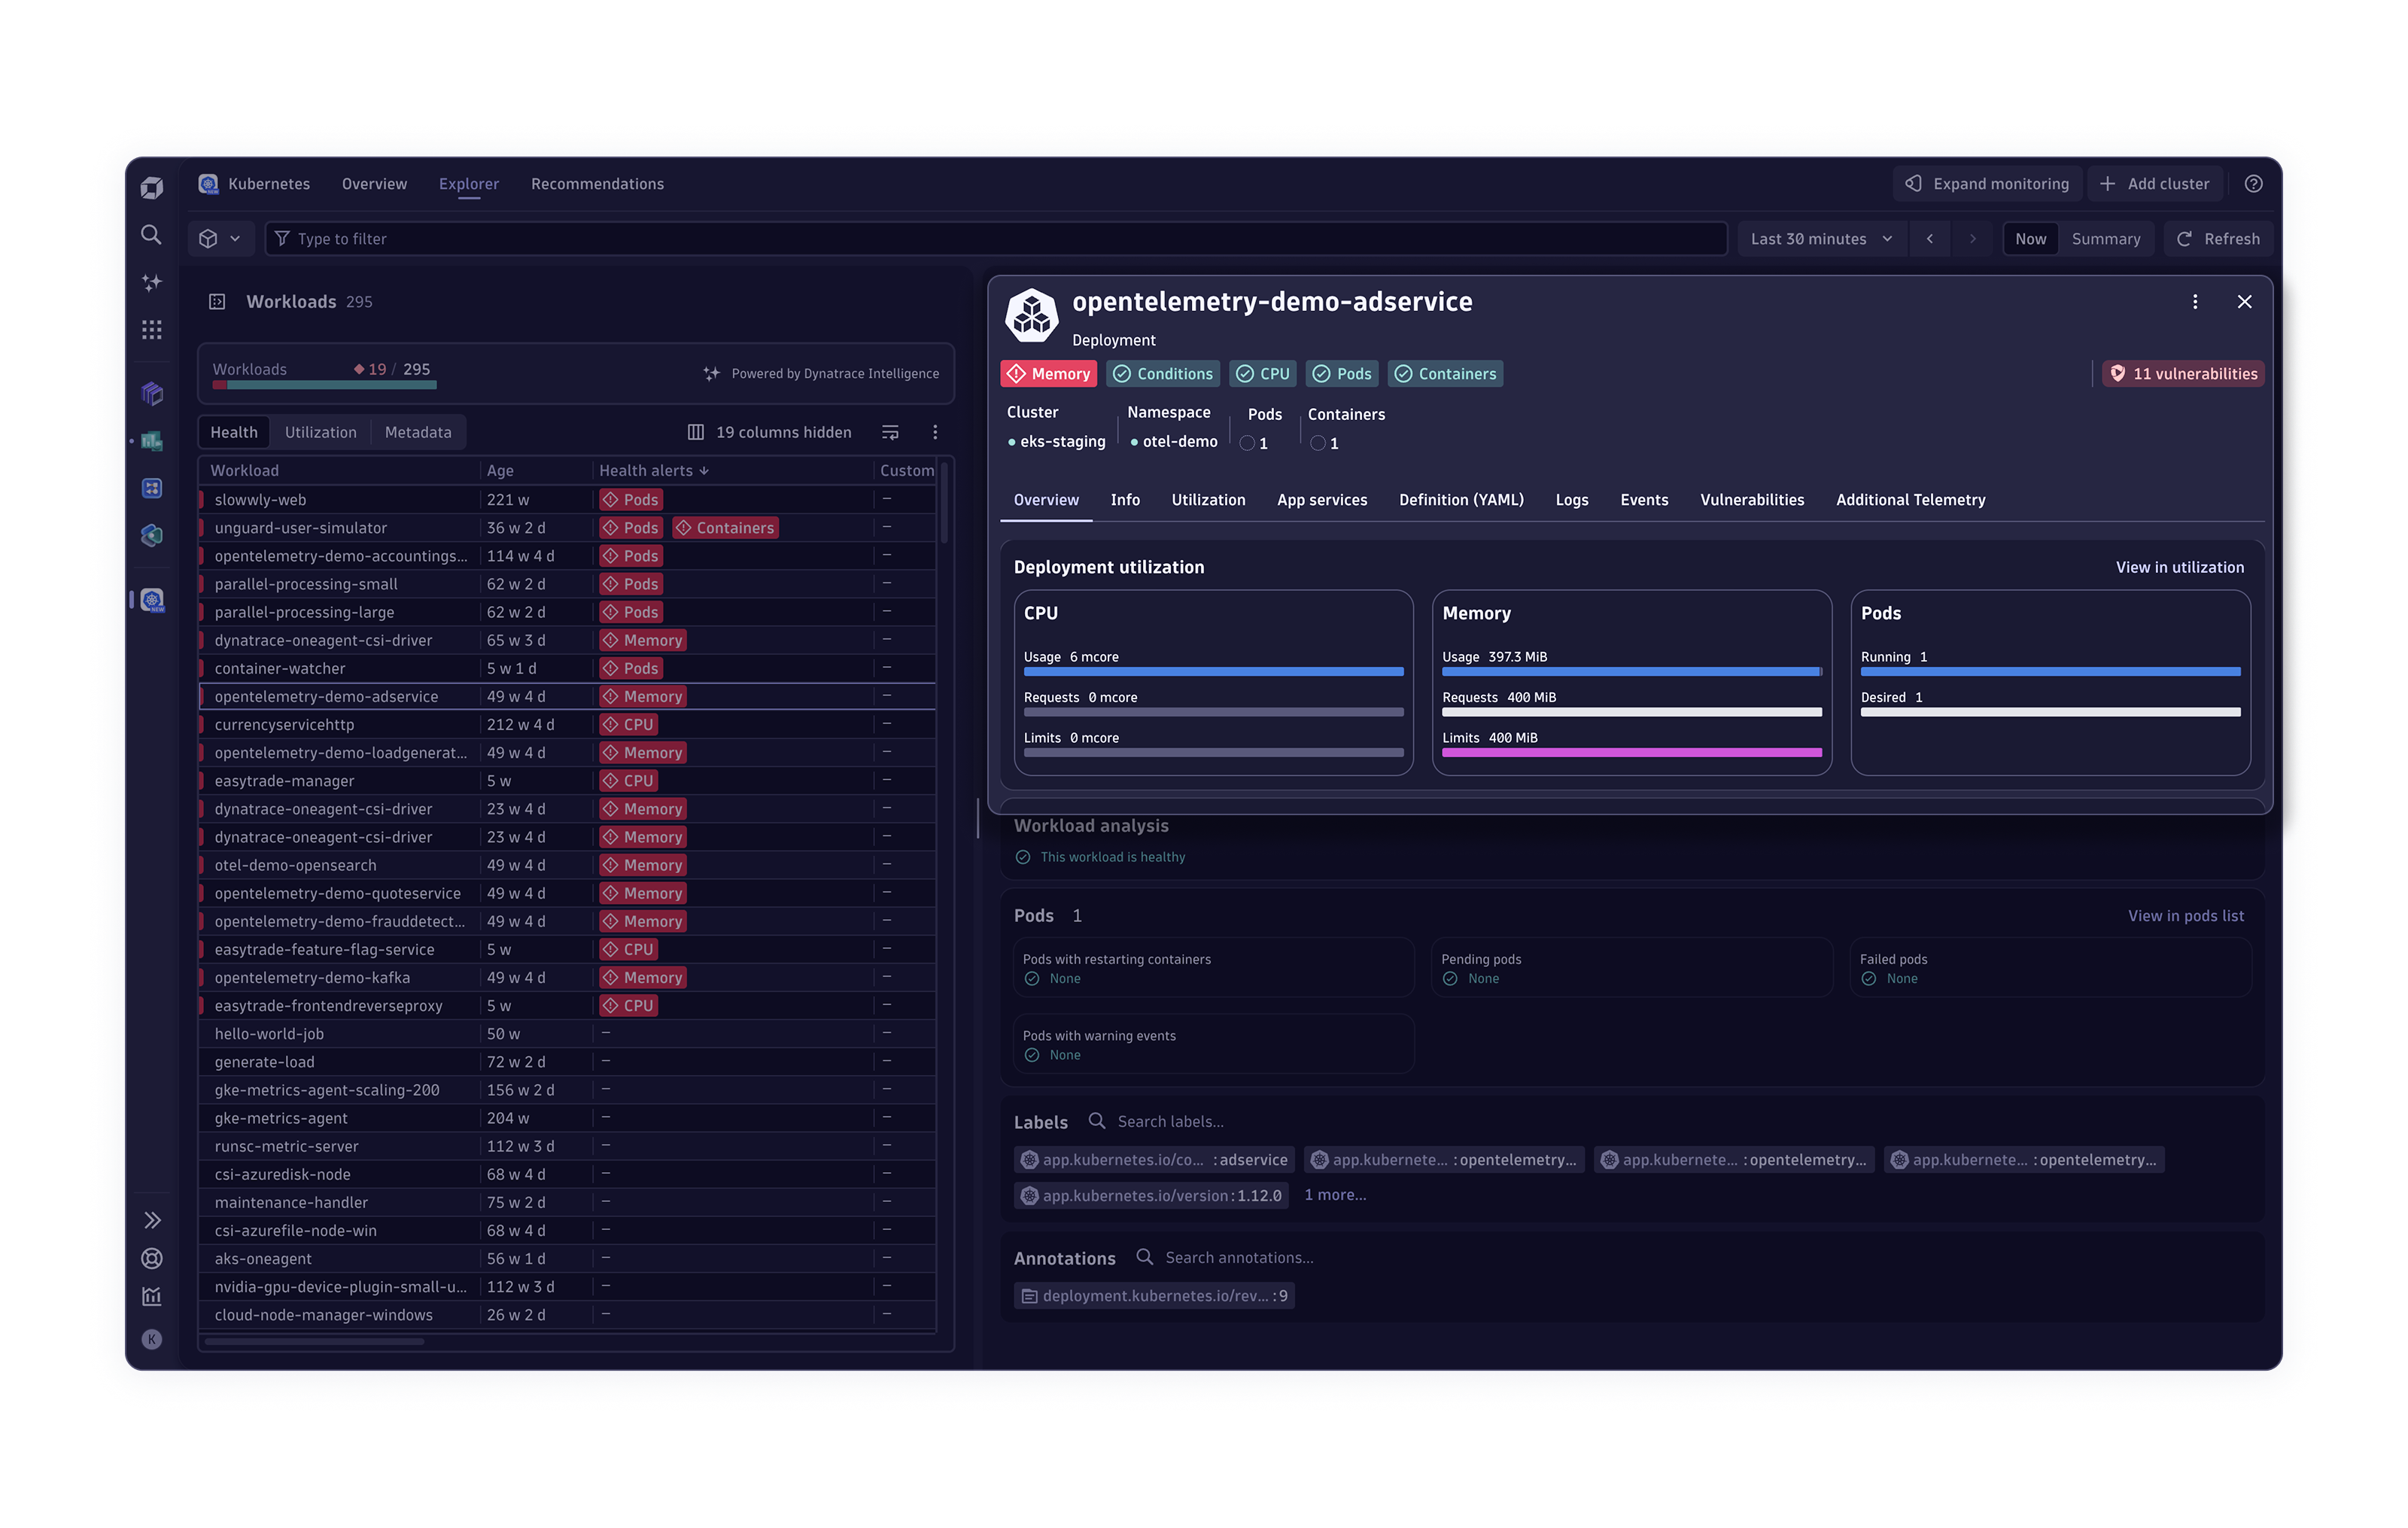
Infrastruktur-Observability
-
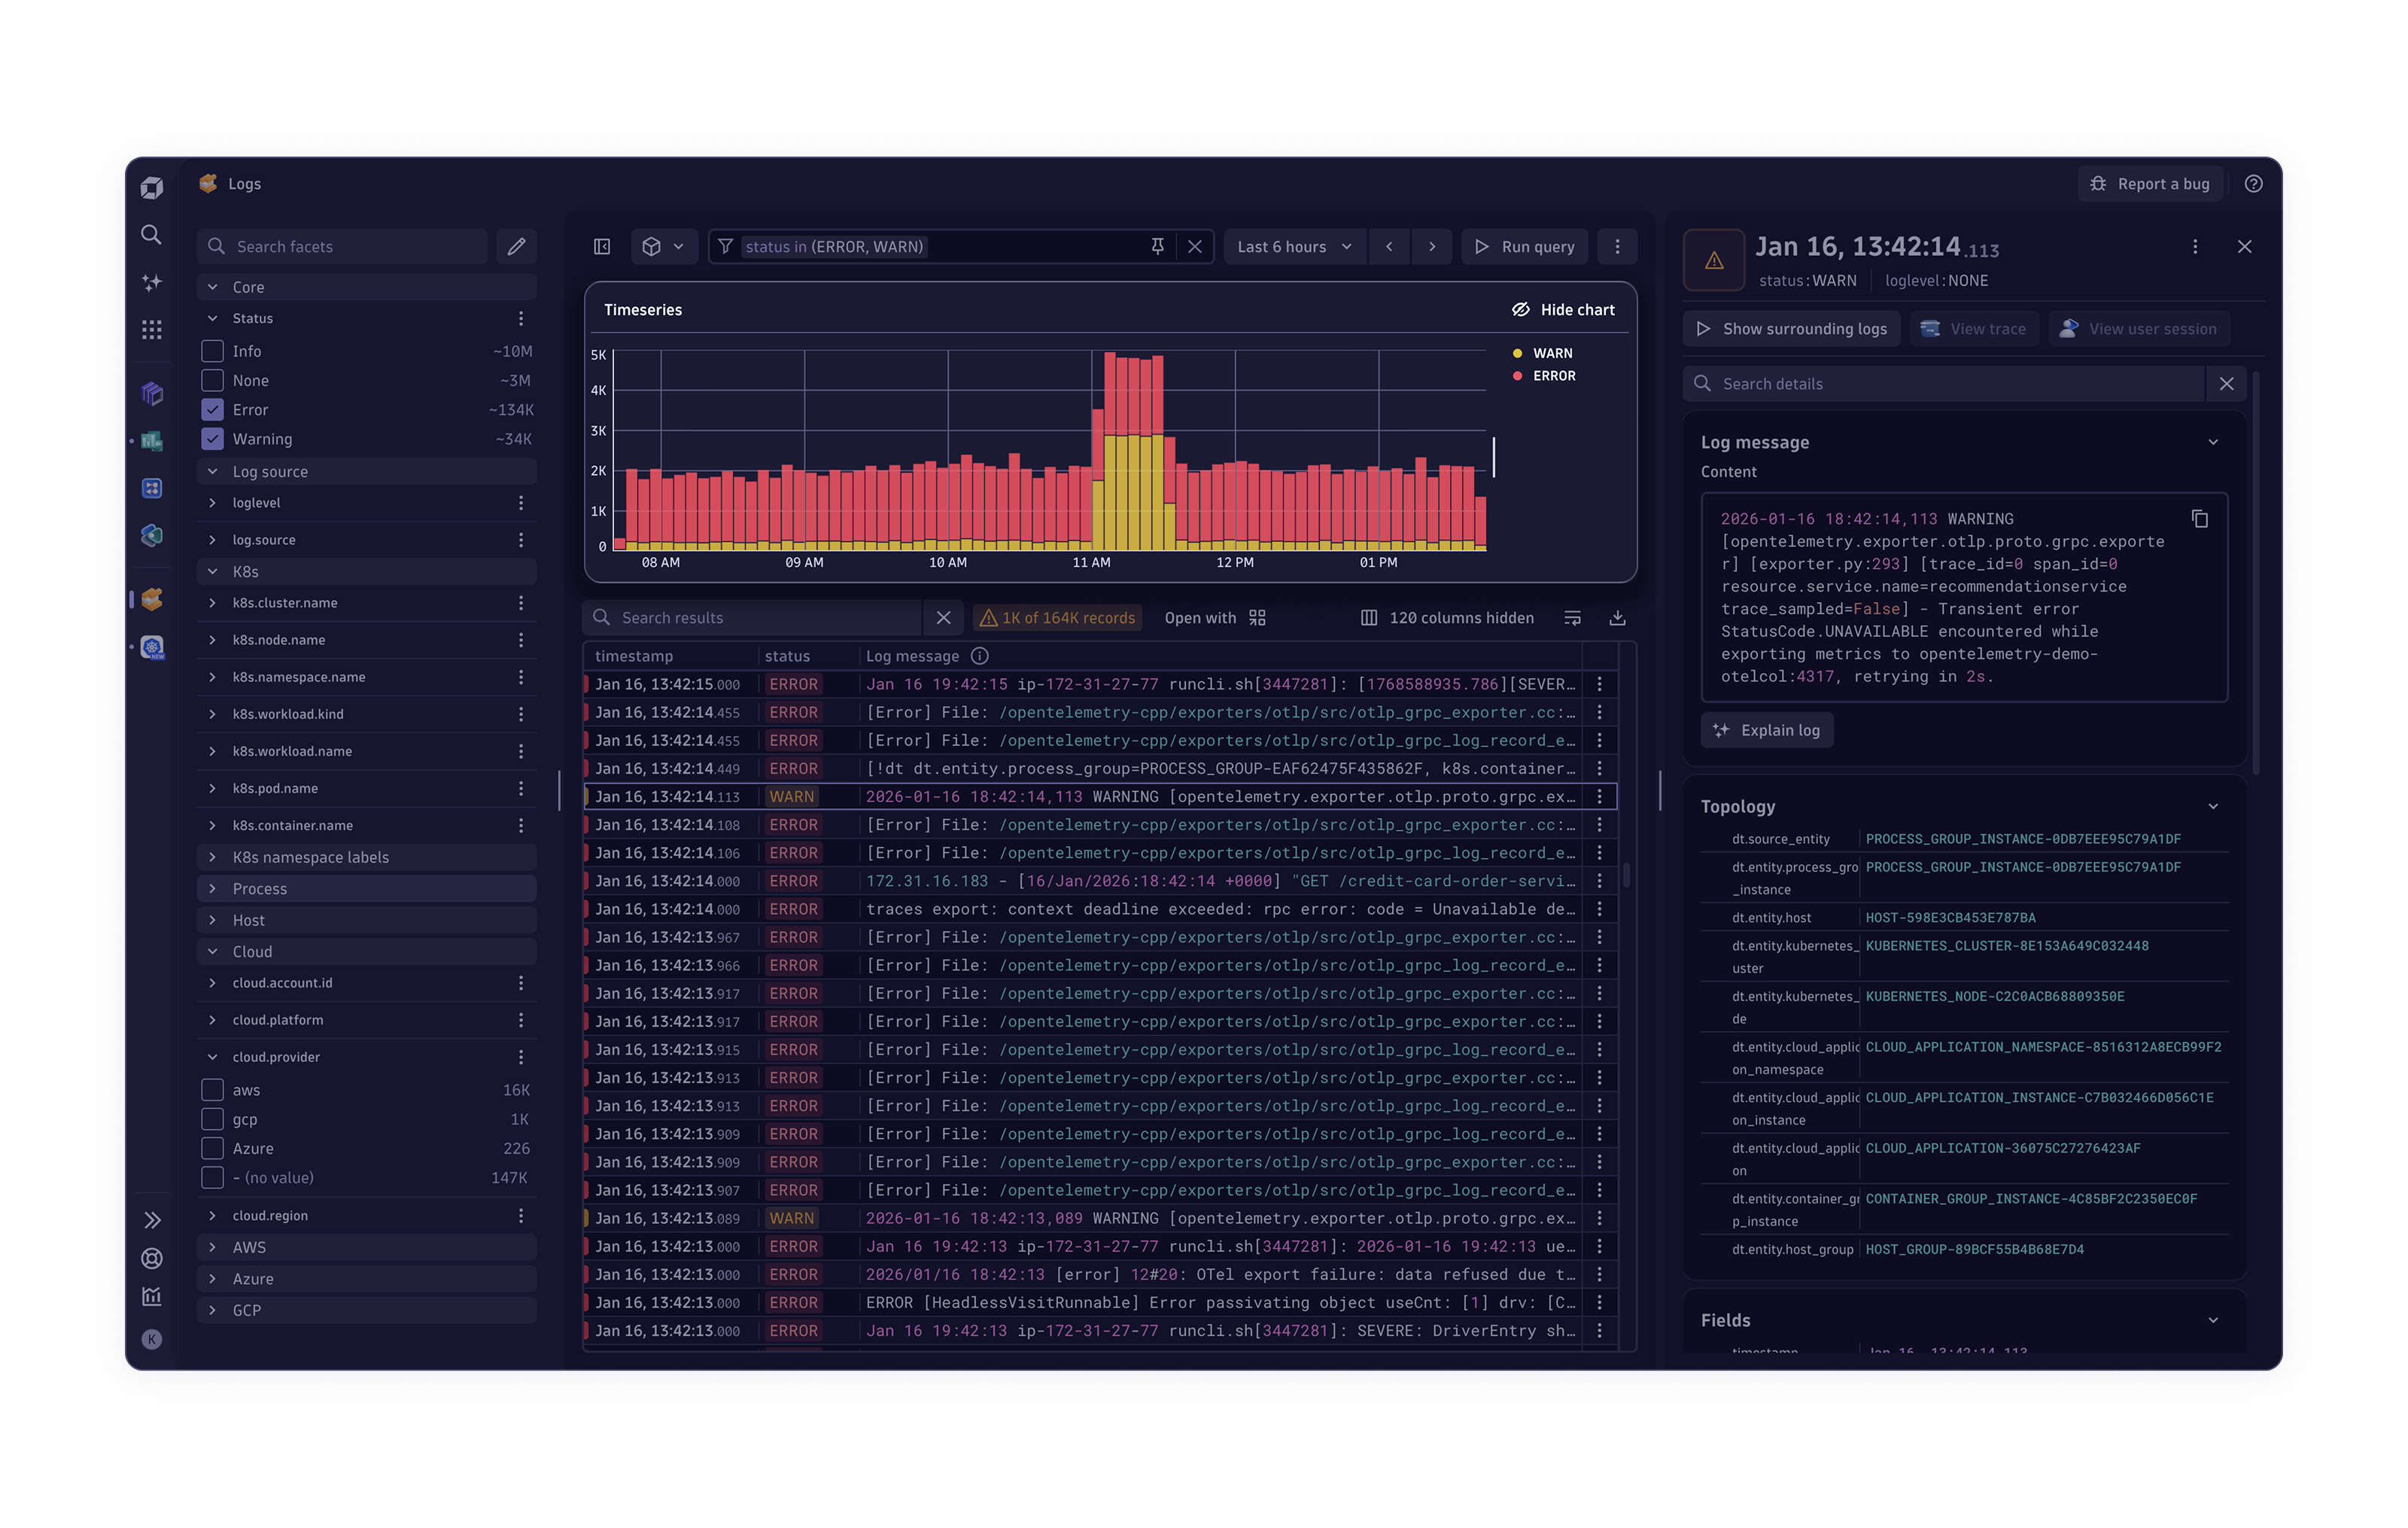
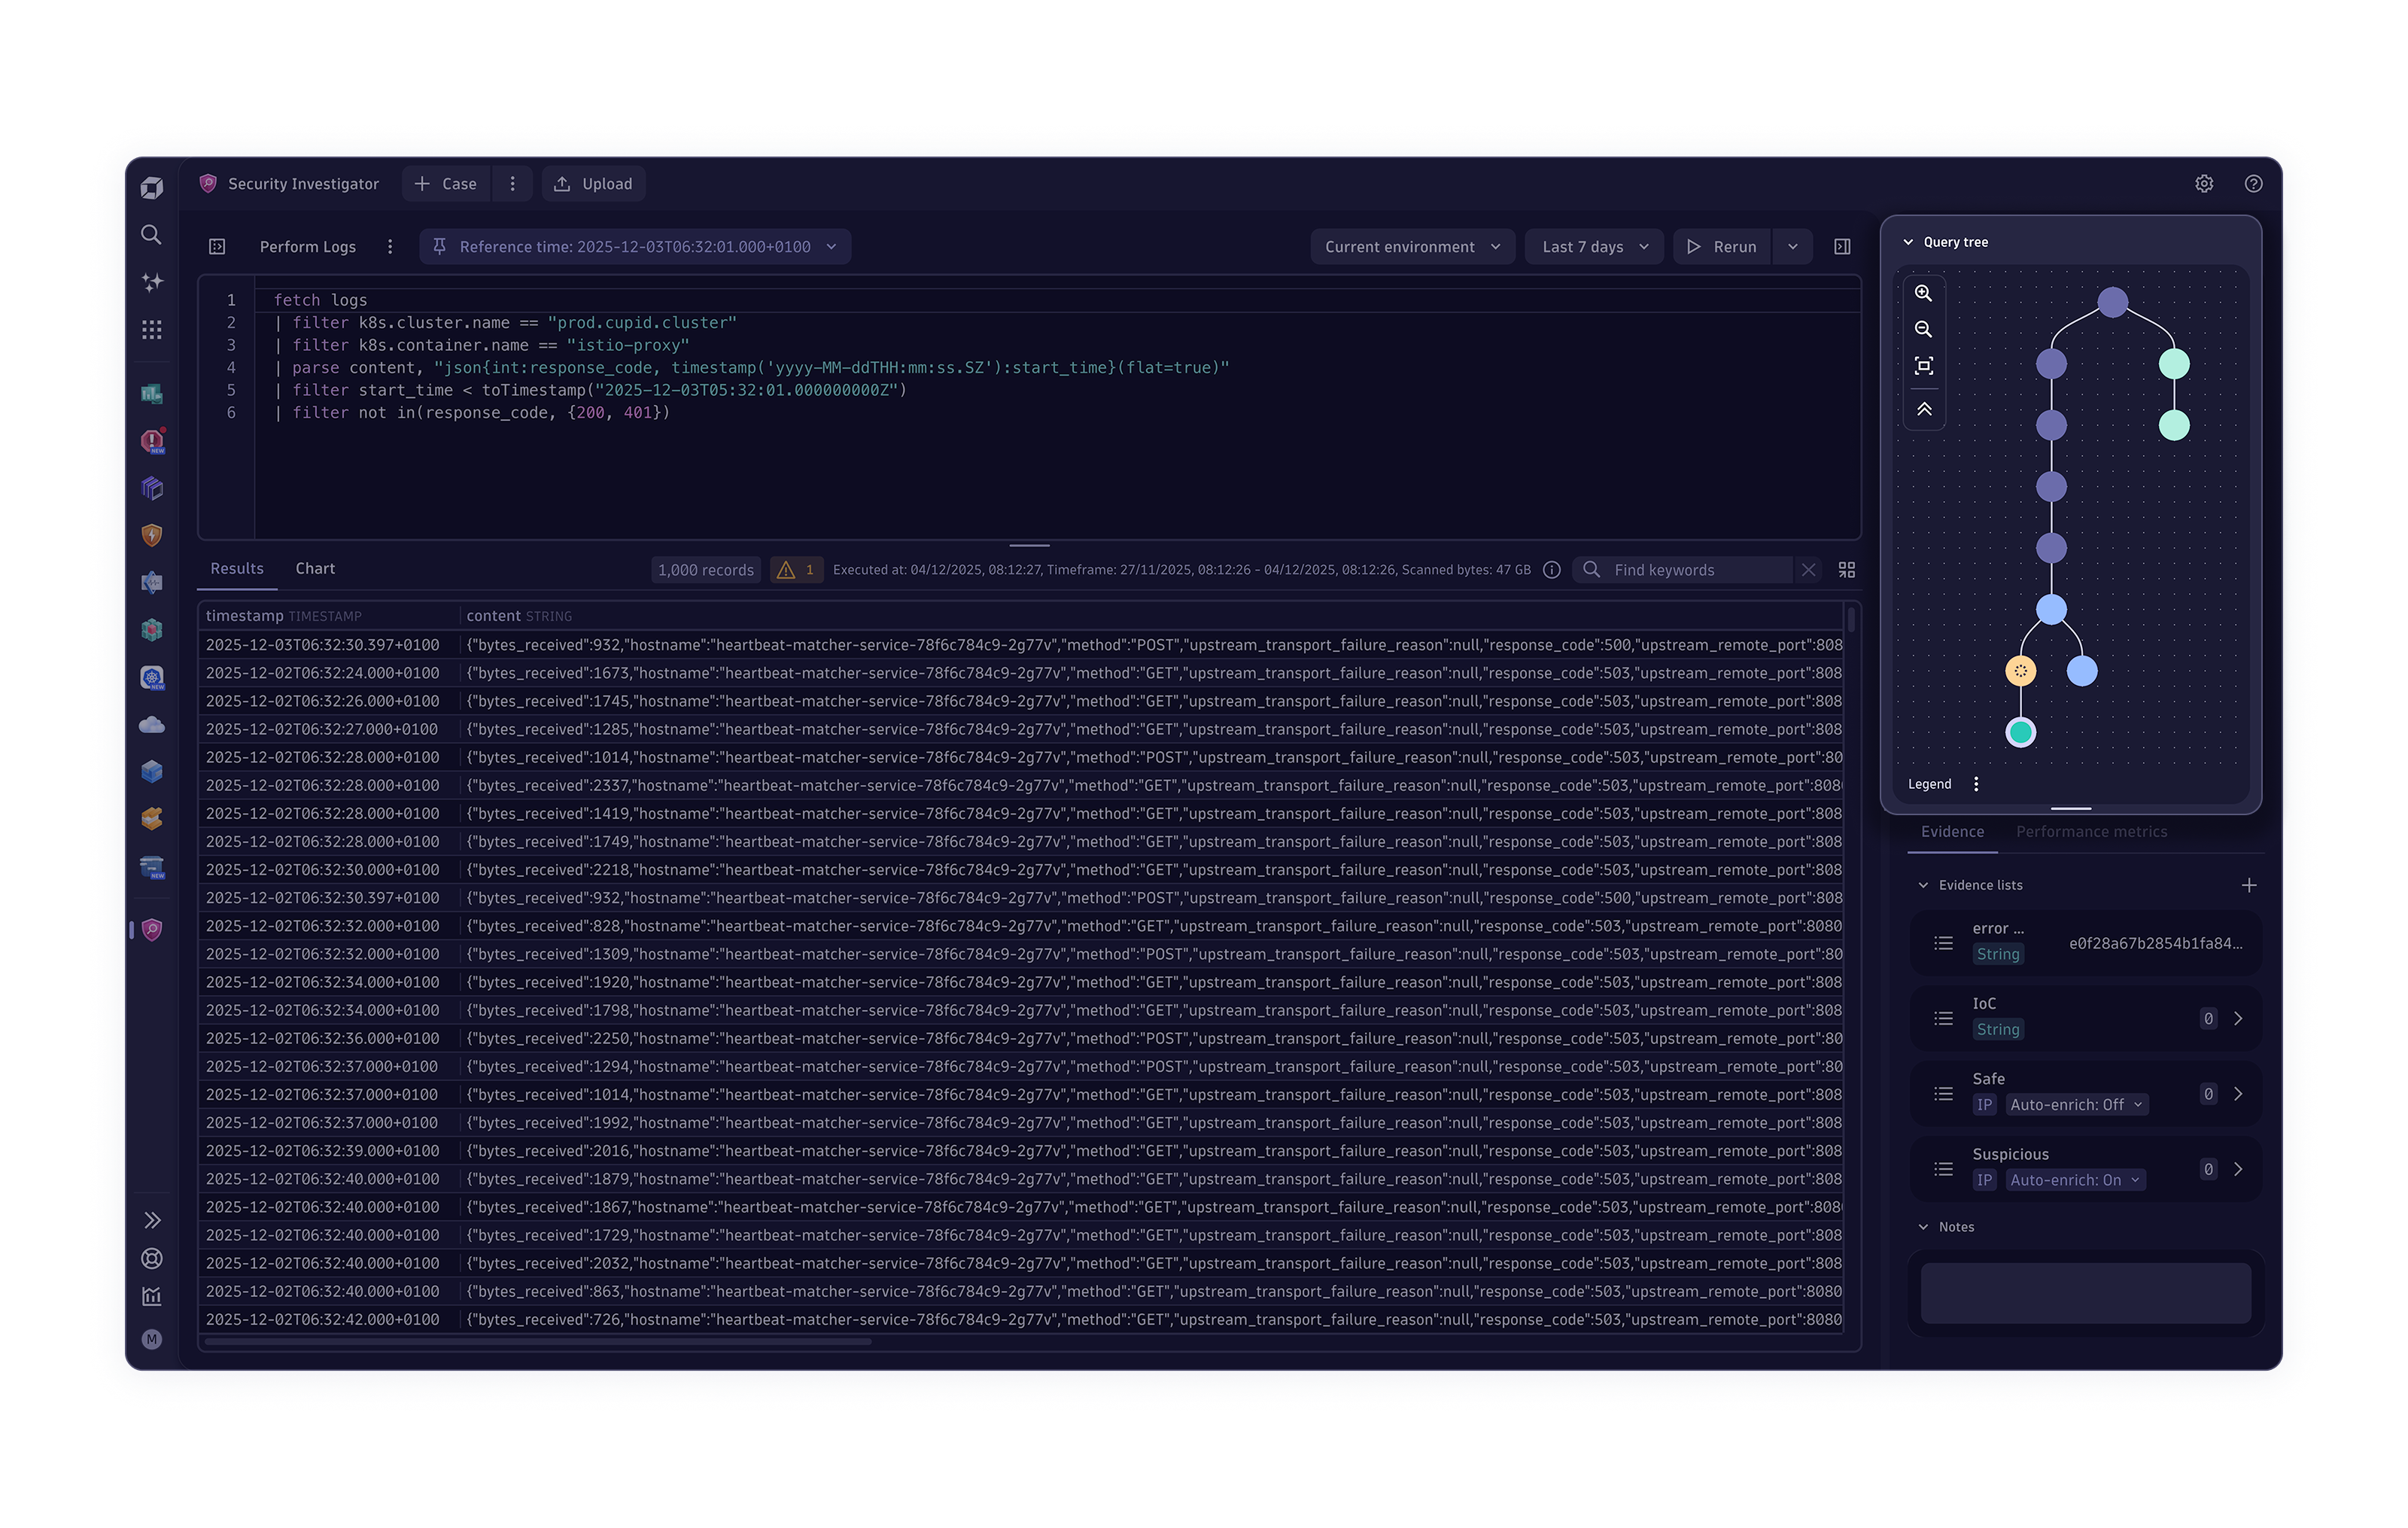
Log-Analyse
-
Softwarelieferung
-
Threat-Observability


"Die Zukunft der Observability ist präventiv und autonom und nutzt deterministische KI sowie KI-Agenten, um Maßnahmen über Cloud-Plattformen, Entwicklertools und das IT-Servicemanagement hinweg zu koordinieren."
- Stephen Elliot, Vice President, I&O, Cloud Operations, and DevOps at IDC
Erfahren Sie auf der Perform 2026, wie wir dies mit der Einführung von Dynatrace Intelligence möglich machen.
Die weltweit führenden Unternehmen entfalten ihre Wirkung dort, wo es darauf ankommt
Lernen Sie die Kunden kennen, die mit Dynatrace bessere Geschäftsergebnisse erzielen.


Unsere neuesten Forschungsergebnisse und Erkenntnisse
 REPORTReport:
Der Stand von Observability 2025
Informieren Sie sich, wie führende Unternehmen kontextbezogene Echtzeit-Daten für eine vertrauenswürdige KI nutzen und die Transformation voranbringen. Höchstbewertungen für „Completeness of Vision“ und „Ability to Execute“
 The Forrester Wave™️: Report „Artificial Intelligence for IT Operations (AIOps)“
Lesen Sie nach, warum wir in den Kategorien für aktuelles Angebot und Strategie Bestnoten erreicht haben.


Starten Sie mit Dynatrace
Beginnen Sie Ihre 15-tägige kostenlose Testphase oder machen Sie sich in unserer Sandbox-Umgebung mit der Plattform vertraut.