
You deploy a small change to a Node.js service. All tests pass. You top off your coffee. Fifteen minutes later, alerts start firing.
Your once-snappy API endpoint is crawling. Dashboards light up. Slack fills with “Anyone seeing latency?” messages. You open the logs and start the familiar dance: grep, trace, redeploy, repeat.
We’ve all been there. The hardest part isn’t fixing the bug — it’s finding it.
Why we lose hours chasing logs and people
As developers, we have telemetry overload — yet still lack the one piece of context we need: What line of code introduced the regression?
Modern cloud-native systems aren’t just applications anymore, they’re distributed systems. When something has already happened, the first question isn’t what happened, it’s where?
And in distributed systems, “where” can mean:
- Any container replica
- Any downstream API call
- Any async job or queue consumer
- Any recent deployment or configuration change
Each service has its own logs, metrics, and traces — often split across different tools and dashboards. Context lives in Slack threads. Deployment history lives somewhere else. Institutional knowledge lives in someone’s head.
So, you correlate timestamps manually. You pivot across dashboards. You ask in Slack.
This isn’t debugging — it’s archaeology.
Finding the source means pulling in Dev, Ops, SRE, and application owners — trying to piece together the context of both code and infrastructure.
In other words, is it the code — or is it the node?
When you need code-level insight
Now imagine a different outcome. You immediately see which function in your code triggered the latency spike — without redeploying, adding debug logs, or trying to reproduce the issue locally.
That’s the promise of code-level observability.
Instead of stitching together logs, metrics, and traces across multiple tools, runtime instrumentation automatically captures what executed, where time was spent, and how requests flowed across services. You move from guessing to knowing.
Manual instrumentation is brittle. It adds overhead, introduces blind spots, and slows down delivery. As builders, you want to focus on the business logic and functionality, not maintaining observability integration.
That’s why platforms like Dynatrace automatically instrument the runtime and correlate traces, logs, and method-level execution into a unified view. With OneAgent, OpenTelemetry support, and open APIs, teams get deep visibility without manual instrumentation or lock-in.
In the Distributed Tracing view, logs, traces, and code-level analysis are correlated into a single problem context. Developers can see what failed, where latency was introduced, and which code path was responsible — without losing focus or switching tools.
Real-world example: Tracing a bad commit in a Node.js microservice
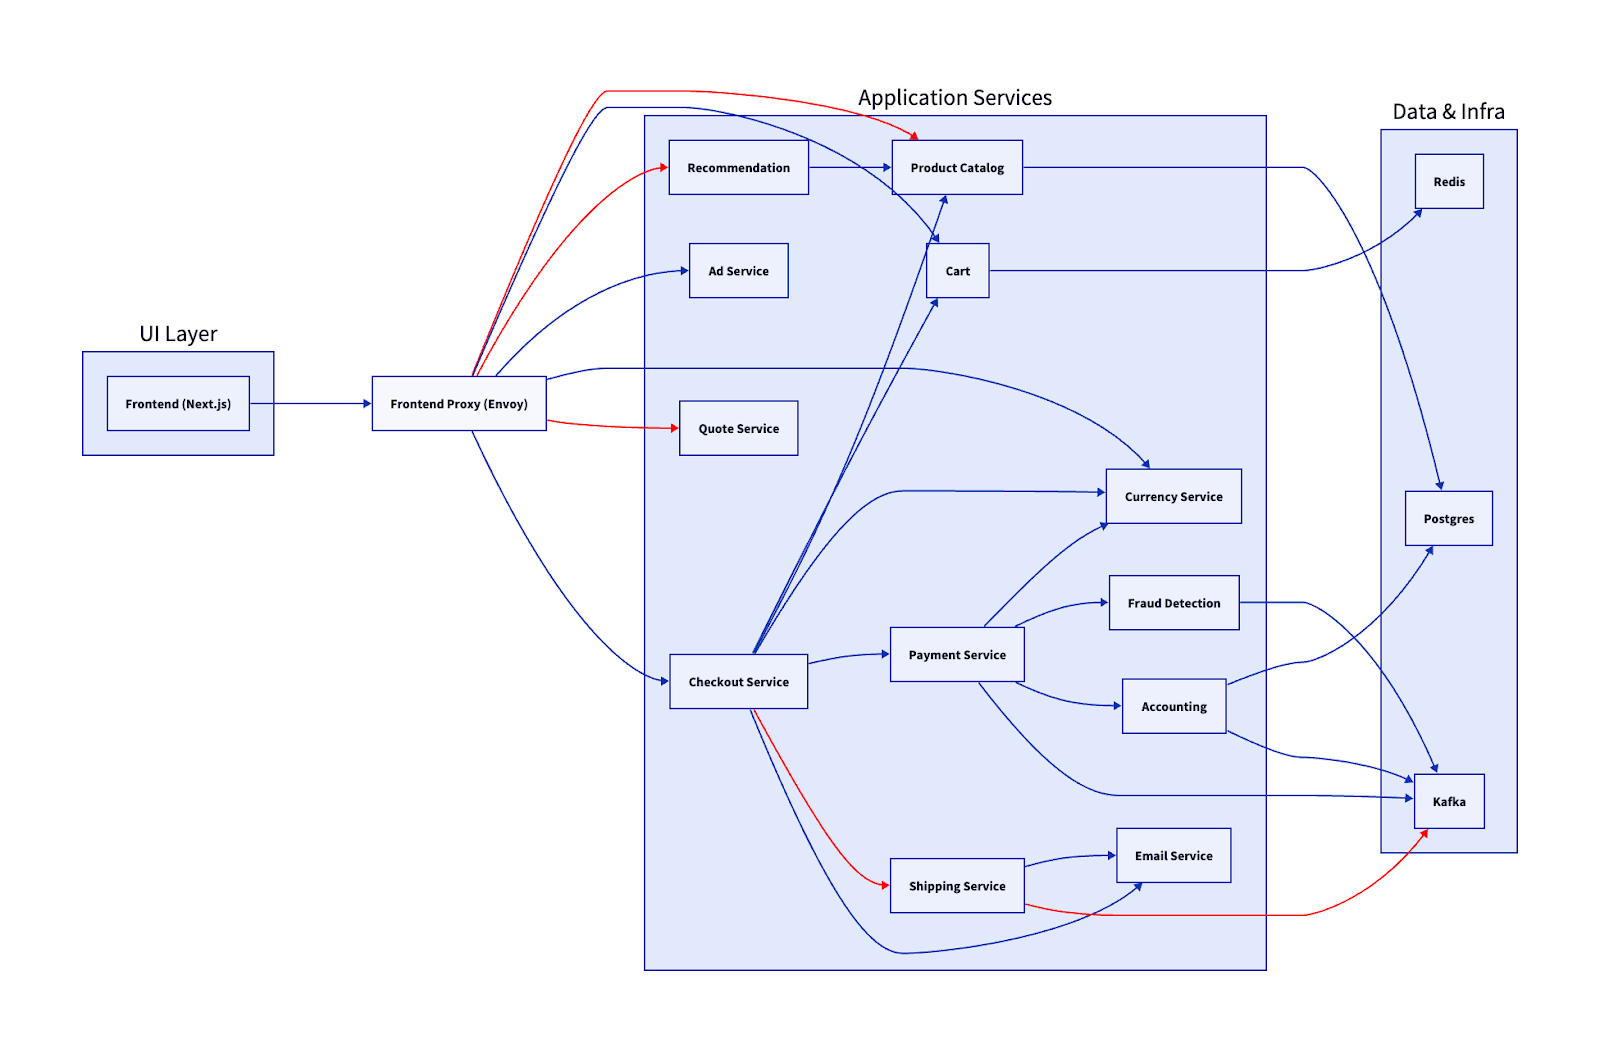
You’ve got a simple Node.js microservice that fetches orders from multiple downstream APIs and returns them to checkout.
// routes/server.js
router.get('/api/orders', async (req, res) => {
const start = performance.now(); // better precision than Date.now()
try {
const orders = await fetchOrders();
const durationMs = performance.now() - start; // ← capture request duration for monitoring
// You would normally send this to your metrics system (Prometheus, StatsD, OpenTelemetry...)
console.log({
endpoint: '/api/orders',
orderCount: orders.length,
durationMs: Math.round(durationMs),
durationHuman: `${durationMs.toFixed(1)}ms`
});
res.json(orders);
} catch (err) {
// duration even on error is useful for observability
const durationMs = performance.now() - start;
console.error({
endpoint: '/api/orders',
error: err.message,
durationMs: Math.round(durationMs)
});
res.status(500).json({ error: 'Failed to fetch orders' });
}
});
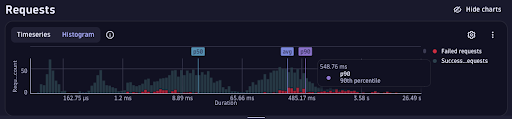
After a recent commit, latency climbs to 600ms and error rates spike. Logs show scattered warnings. Locally, everything looks fine. Under light load, tests still pass.
This is the kind of regression that eats up entire afternoons.
The data you need is split across:
- Application logs
- Distributed traces
- Kubernetes events
- Deployment history
What the trace reveals
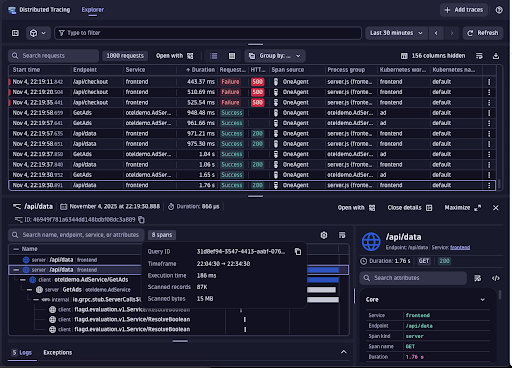
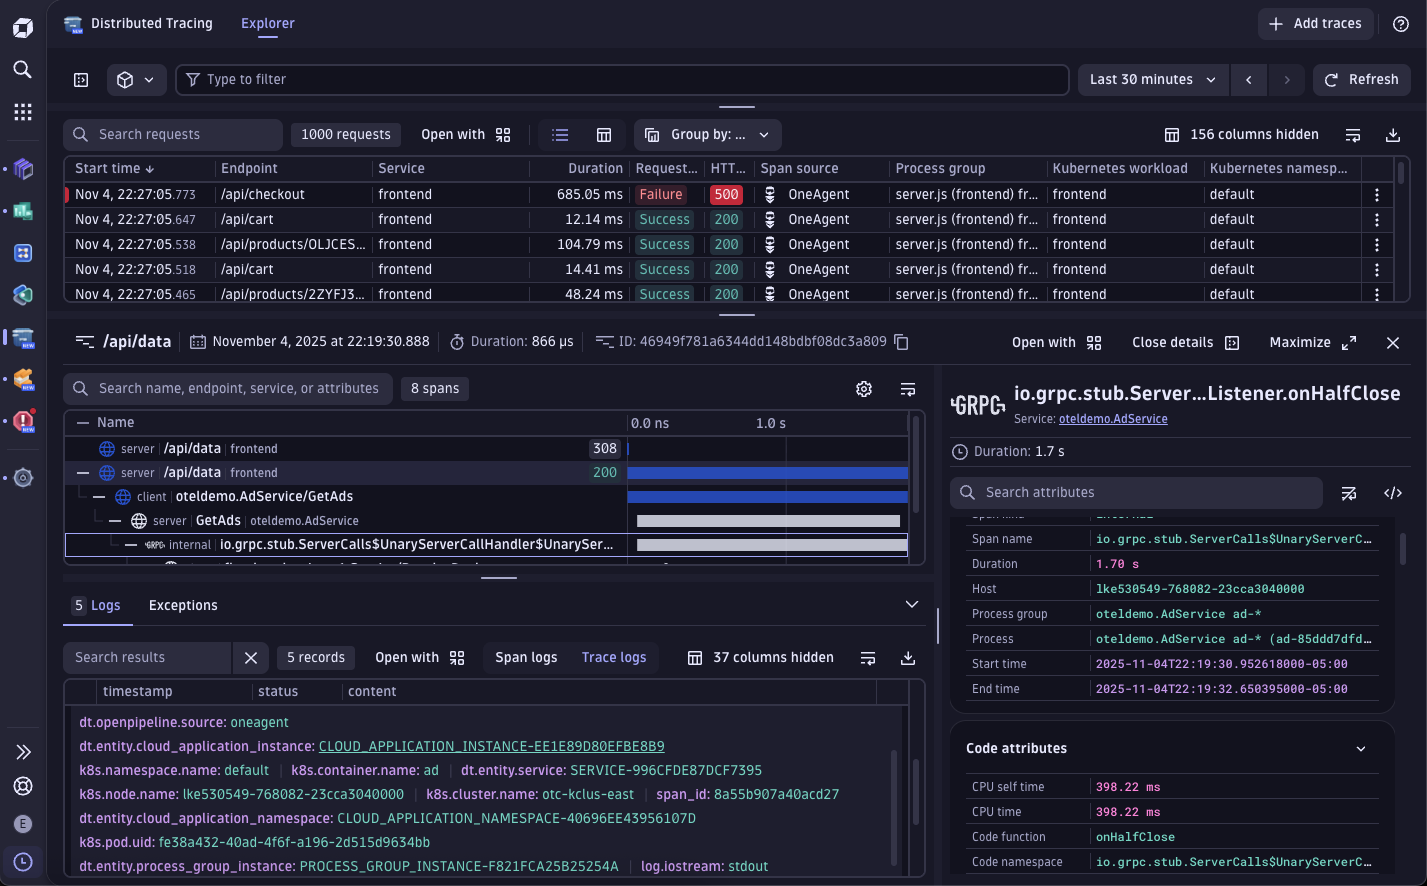
Opening the distributed trace view in Dynatrace (PurePath®) you can inspect the full execution path of a single request — across services, methods, and downstream dependencies.
You immediately see:
- Failed
/api/checkoutrequests - Elevated response times
- A downstream gRPC calls consuming the majority of request time
From logs alone, you only see where errors surfaced:
callErrorFromStatus (/app/node_modules/@grpc/grpc-js/build/src/call.js:32)

Object.onReceiveStatus (/app/node_modules/@grpc/grpc-js/build/src/client.js:193)

Object.onReceiveStatus (/app/node_modules/@grpc/grpc-js/build/src/client-interceptors.js:361)

Object.onReceiveStatus (/app/node_modules/@grpc/grpc-js/build/src/client-interceptors.js:324)

<anonymous> (/app/node_modules/@grpc/grpc-js/build/src/resolving-call.js:129)

AsyncLocalStorage.run (node:internal/async_local_storage/async_hooks:91)

process.processTicksAndRejections (node:internal/process/task_queues:85)

ServiceClientImpl.makeUnaryRequest (/app/node_modules/@grpc/grpc-js/build/src/client.js:161)

ServiceClientImpl.<anonymous> (/app/node_modules/@grpc/grpc-js/build/src/make-client.js:105)

AsyncLocalStorage.run (node:internal/async_local_storage/async_hooks:91)

<anonymous> (/app/node_modules/@opentelemetry/instrumentation-grpc/build/src/clientUtils.js:130)

<anonymous> (/app/node_modules/@opentelemetry/instrumentation-grpc/build/src/instrumentation.js:215)

AsyncLocalStorage.run (node:internal/async_local_storage/async_hooks:91)

AsyncLocalStorageContextManager.with (/app/node_modules/@opentelemetry/context-async-hooks/build/src/AsyncLocalStorageContextManager.js:33)
The logs tell you where the exception bubbled up. It does not tell you where the regression started. The trace timeline adds the additional context.
The root cause
Method-level timing shows that fetchOrders() is now executing downstream lookups sequentially instead of in parallel.
// routes/server.js

router.get('/api/orders', async (req, res) => {

const start = Date.now();

const orders = await fetchOrders();

const duration = Date.now() - start;

console.log(`Request completed in ${duration}ms`);

res.json(orders);

});
Under low traffic, this isn’t obvious.
Under load, latency compounds.
Now our dev team can update the code to fix the issue:
// fixed version of fetchOrders

async function fetchOrders() {

// run order detail lookups in parallel

const results = await Promise.all(orderIds.map(getOrderDetail));

return results;

}
The regression only surfaced once concurrency increased— something unit testing didn’t expose.
By correlating runtime traces with deployment metadata, you can see exactly when the behavior changed and which commit introduced it.
How you can cut MTTR from hours to minutes
Depending upon the scenario, we often get judged not by how fast we ship — but by how fast we recover. Mean time to repair (MTTR) is what builds (or breaks) trust between Developers and SREs.
That’s why instrumentation and observability need to be placed before code reaches production — not added after something breaks.
Here’s what happens when you move from manual debugging to connected code-level insight:
| Workflow | Average MTTR | Typical Effort |
| Traditional (logs + dashboards) | Several hours | Log triage, manual trace stitching, local reproduction, redeploy |
| Code-level visibility | Often under an hour | Direct trace correlation, method-level timing, commit linkage |
With distributed tracing in Dynatrace, every transaction is captured end-to-end, from your Node.js route to downstream APIs and databases, all correlated with the build and deployment that introduced it.
Instead of debating whether it’s the code or the node, both developers and SREs see the same execution path, the same timeline, and the same root cause.
Enabling code-level analysis in your stack
You don’t need to refactor your application or add manual instrumentation to anything. Here’s how most teams get started:
- Deploy Dynatrace OneAgent on your service host or Kubernetes cluster.
- Enable Node.js auto-instrumentation in enabled (no code changes required.
- Integrate CI/CD metadata so commits, build IDs, and deployment versions appear alongside traces.
- Inspect live traces directly in your IDE (VS Code or IntelliJ) using the Dynatrace plugin — jump from failing span to the exact method instantly.
Within minutes, your next deployment is automatically traced end-to-end — from the first line of code to the live transaction in development through testing and into production.
Less time in tools. More time in flow.
Every debugging session risks pulling you out of flow.
Code-level observability shortens incident response, reduces cognitive load, and replaces guesswork with execution context. Developers gain confidence in what they ship. SREs see fewer escalations and cleaner hand-offs because the root cause is already visible.
Less troubleshooting. More building. That’s the real win.
Explore how Dynatrace connects commits, traces, and runtime behavior — so you can move from incident to resolution without leaving your workflow.
code. observe. deliver.
What’s next?
Learn more about how Live Debugger can be leveraged across production environments to enhance development processes and enable robust application performance.


Looking for answers?
Start a new discussion or ask for help in our Q&A forum.
Go to forum