
You know that moment when everything should be working, but it’s just not? Your deployment went smoothly, the pods are running, and yet — errors. Lots of them.
That’s exactly where I found myself recently. The EasyTrade application was throwing fits, and I needed answers fast. What made this debugging session different, however, was the combination of tools at my disposal: Dynatrace intelligent monitoring paired with the raw power of Gemini CLI accessing the Dynatrace MCP server.
The fact that Gemini CLI can communicate directly with Dynatrace through the MCP protocol means I can stay in my flow. I’m not jumping between tools, losing my train of thought, or rebuilding mental context every few minutes. I ask questions in natural language, and Gemini translates that into precise DQL queries against Grail.
Let’s walk through two tales from the terminal: one about an impatient service, and another about a phantom error that taught me patience.
The impatient service that couldn’t wait
When detection meets investigation
I started my day firing up my email and my terminal. Dynatrace flagged the first problem before I’d even finished my coffee. A notification in my inbox let me know the contentcreator service was experiencing a stuck deployment.
Now, here’s where things get interesting. Dynatrace identified what was broken, but I wanted the gritty details and potential solutions. This is where Gemini CLI comes in clutch.
Instead of clicking through UI panels — nothing wrong with that, by the way — I fired up my terminal and started a conversation with Dynatrace via the Gemini CLI. Think of it as having a debugging buddy who speaks fluent Dynatrace Query Language (DQL) and can pull data from Dynatrace Grail® faster than you can say observability.
As you can see, I asked Gemini to tell me more about the problem. The results were crystal clear. Every log entry showed the same error:
"com.microsoft.sqlserver.jdbc.SQLServerException: The TCP/IP connection to the host db, port 1433 has failed. Error: "Connection refused. Verify the connection properties. Make sure that an instance of SQL Server is running on the host and accepting TCP/IP connections at the port. Make sure that TCP connections to the port are not blocked by a firewall."
The race nobody wins
Here’s the thing about microservices: They’re like orchestra musicians warming up. Everyone’s eager to start playing, but if the conductor — in this case, the database — isn’t ready, you get chaos instead of symphony.
The contentcreator service was starting up and immediately trying to connect to the database. However, SQL Server inside the db pod needed a few extra seconds to initialize. Classic startup race condition. The contentcreator service was essentially knocking on a door that hadn’t fully opened yet.
The fix? Kubernetes startup probes. These probes are brilliant; they’re like a bouncer at a club, making sure nobody rushes in before the venue is ready.
Gemini CLI modified the db service deployment manifest to include a readiness probe that would execute a simple SQL query. The container wouldn’t be marked as “running” until it could successfully respond to that query. Simple, elegant, effective.
I went from error to root cause to the recommended solution to fix, all without leaving the terminal.
After applying the updated manifest and restarting the pods, I turned back to Gemini CLI to run the same log query against the fresh manager pod. Just like that, the database connection errors were gone.
The phantom error and the deployment maze
New problem, different beast
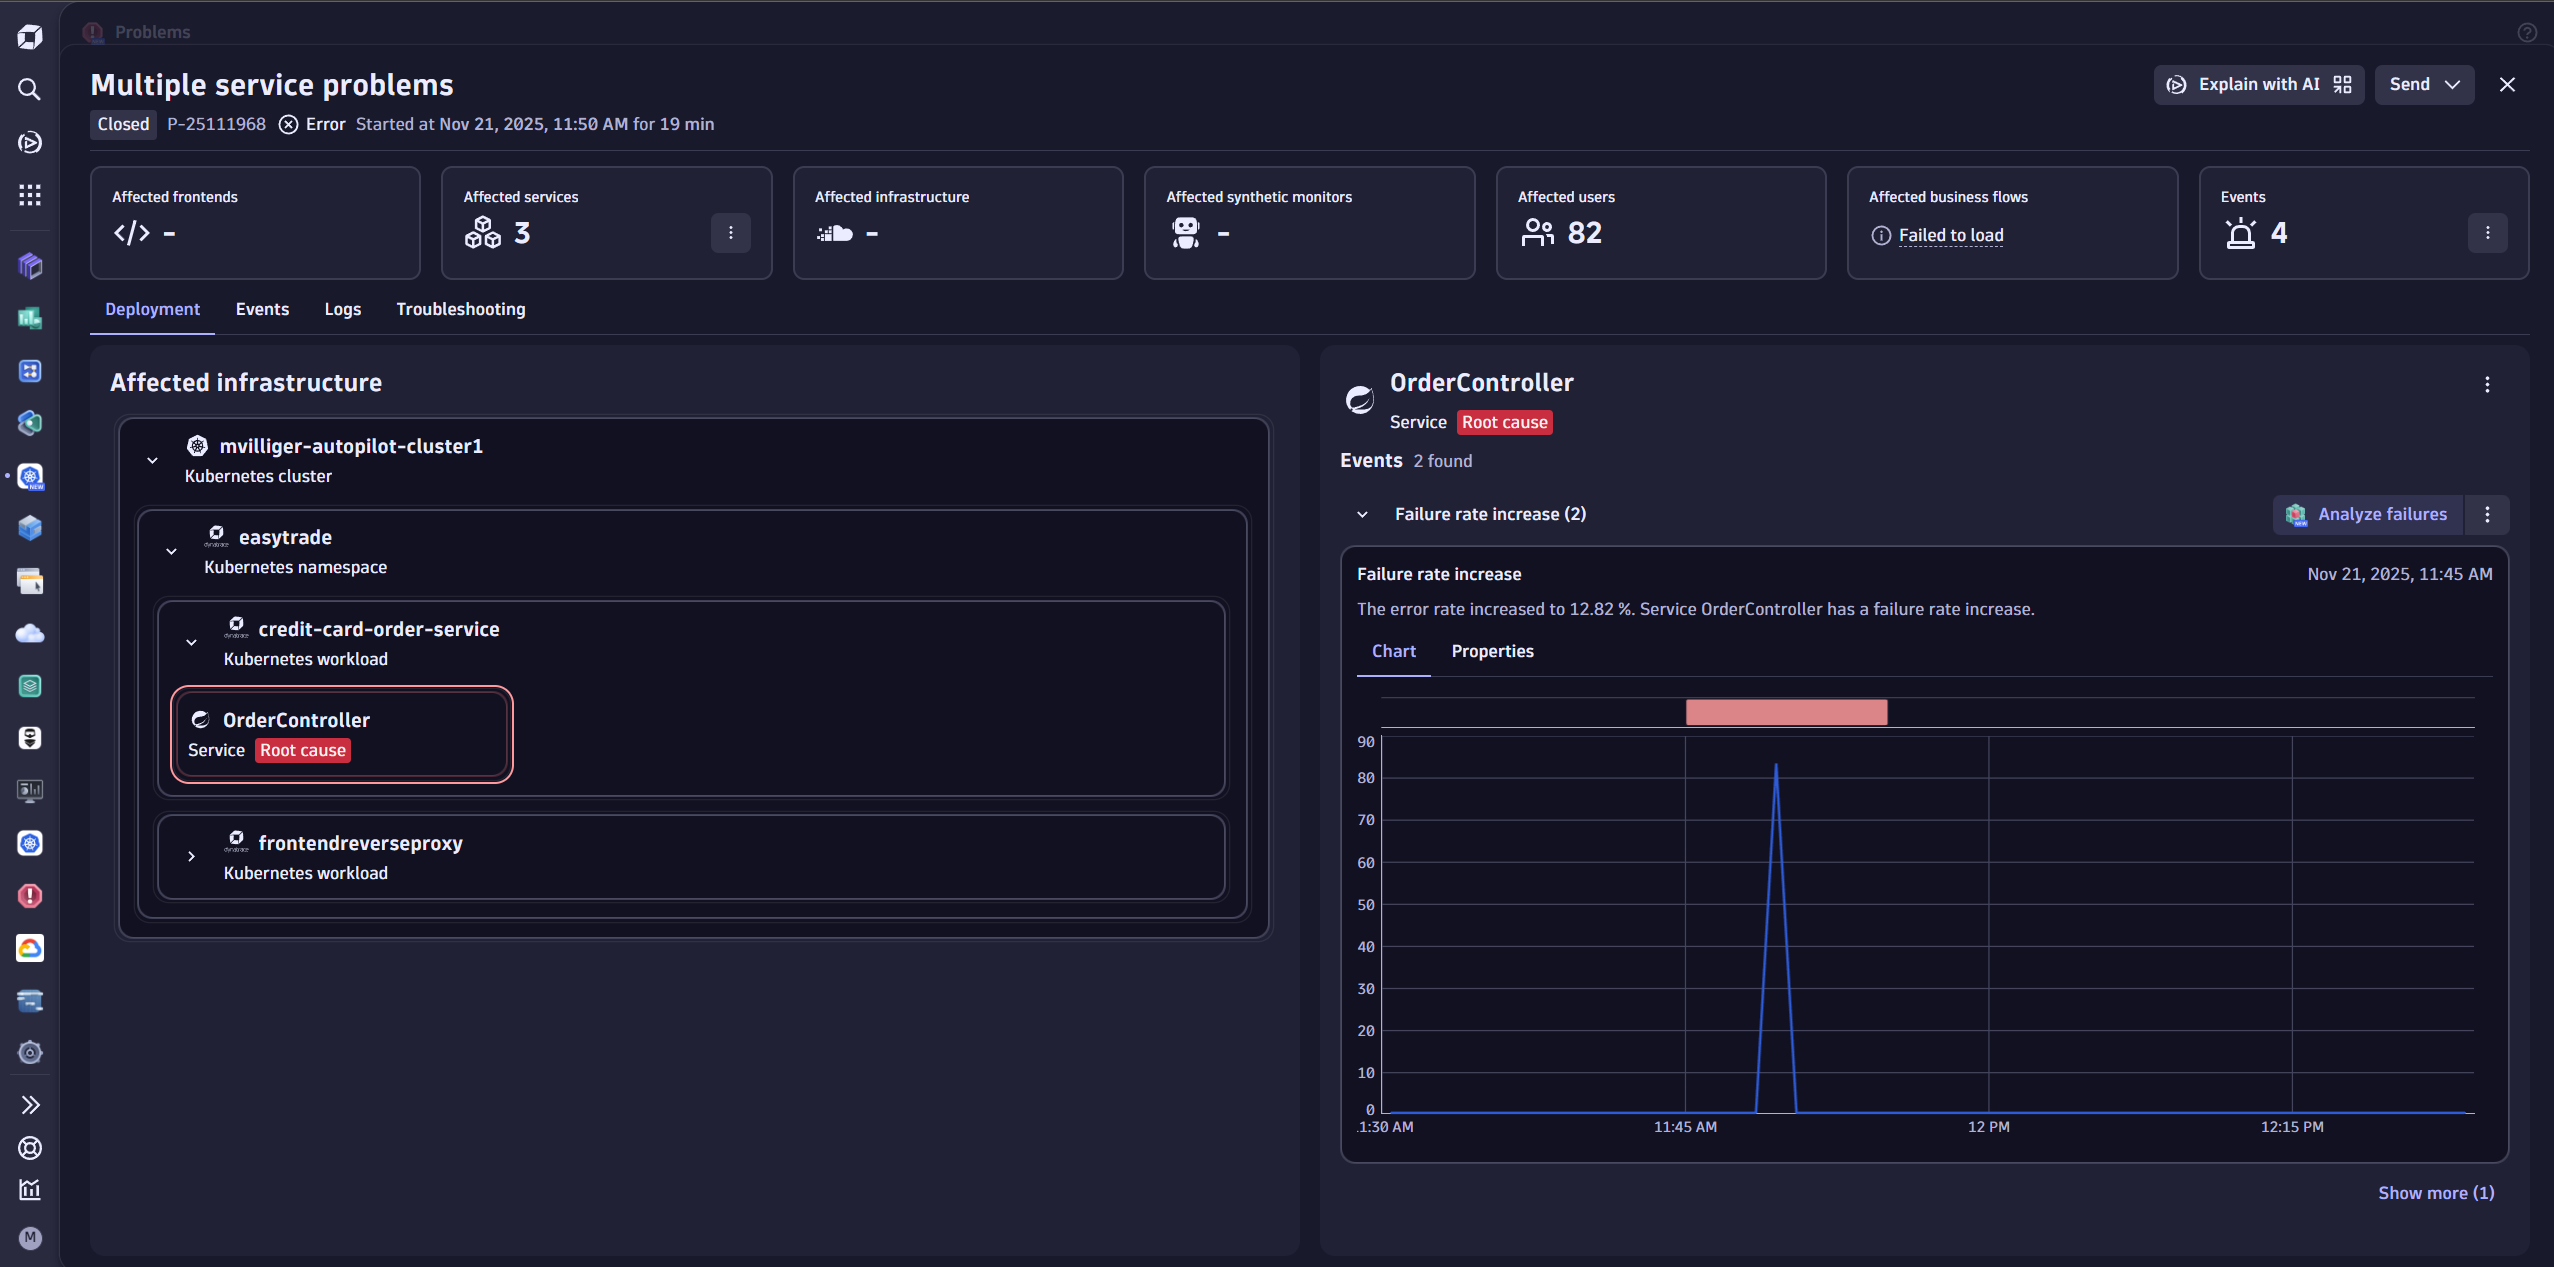
Just when I thought I could relax, Dynatrace surfaced another issue. This time, it was the credit-card-order-service showing a failure rate increase. Different service, different problem. Same reliable detection system.
Back to Gemini CLI.
I pulled up a list of current problems. Gemini knew the resource contention issues we were seeing were expected, but Dynatrace flagged something else — a problem with multiple services impacting 98 users. That one needed our attention.
Gemini was able to immediately determine that the issues were caused by a feature flag and recommended we turn that feature flag off and even updated and applied the manifest for us. Easy peasy.
After deploying the updated feature flag, I remained in Gemini CLI to verify the fix. The logs were clean — no more ArithmeticException. Within minutes, Dynatrace had correlated the fix across all affected services and automatically closed the problem. Once again, the whole workflow — from detection, to investigation, to fix, to verification — happened without me leaving my terminal.
A single workflow in a single place
The synergy between Dynatrace and Gemini CLI isn’t just about having two good tools. It’s about having the right tool at the right time in the right place.
Dynatrace excels at the big picture. It detects anomalies, correlates issues across your entire application landscape, and surfaces problems you didn’t even know existed. It’s your early warning system.
Gemini CLI, connected through the Dynatrace MCP server, lets you query Dynatrace without leaving your terminal. Look, the web UI can do all of these same things and then some — dig into logs, build DQL queries, verify fixes, show pretty dashboards. But when you’re already neck-deep in terminal work, staying put is the move. No alt-tabbing. No mental context switching. Just you, your terminal, and your data.
And here’s where it gets even better: Gemini CLI isn’t just passive. It’s agentic. It suggests fixes, modifies manifests, and can even deploy changes on your behalf. You saw this in action with both problems we tackled: Gemini recommended the readiness probe solution and updated the deployment manifest. It identified the feature flag issue and applied the fix.
The takeaway
Both of these troubleshooting sessions taught me something valuable. The startup race condition showed me the importance of proper initialization ordering in Kubernetes.
But the biggest lesson was to trust your tools but understand what they’re doing. When Dynatrace takes a few minutes to close a problem after you’ve verified the fix, it’s not lagging — it’s being thorough. It’s analyzing patterns, checking for recurrence, and making sure you can confidently move on to your next task.
The combination of intelligent monitoring and command-line power creates something greater than the sum of its parts. Dynatrace watches everything, spots the problems, and shows root cause. Gemini CLI lets you investigate and address those problems without breaking your flow. Together, they make troubleshooting feel less like detective work and more like having a conversation with your infrastructure.
And that morning cup of coffee? It actually stayed warm this time.
The Dynatrace MCP server is available as an open source project. Check out the Dynatrace MCP repository for setup guides and documentation. And if you’re curious about the broader implications of AI-assisted development, look at how similar integrations are transforming developer workflows across the industry.


Looking for answers?
Start a new discussion or ask for help in our Q&A forum.
Go to forum