
The new Smartscape® real-time dependency graph gives teams a real‑time understanding of how their entire digital environment works. By unifying cloud resources, Kubernetes objects, services, and infrastructure into a single live topology, Smartscape removes the guesswork from operations. With a continuously updated view of production, enriched with full metadata and knowledge of all dependencies, teams can explore their environments visually in domain‑specific Smartscape views or analytically through the Grail® unified data lakehouse. In this blog, we highlight concrete new use cases across modern cloud‑native systems.
Unify cloud resources across accounts, regions, and services into a single, real-time dependency graph
As workloads continue to sprawl across AWS, Azure, Google Cloud, and on-premises data centers, teams are overwhelmed by massive volumes of telemetry and constant change. Simple questions like “What service depends on this?” or “Is this vulnerability exposed?” often turn into hours of manual investigation. Smartscape changes this dynamic by unifying every cloud asset, metadata field, and connectivity path into a single, real-time dependency graph, delivering instant answers and visualizing them in a continuously updated Smartscape view. Instead of hopping between AWS and Azure consoles, platform teams finally get a continuously updated picture of how their cloud environments are truly behaving.

With new AWS integrations, Smartscape now also captures deep configuration data, such as VPCs, load balancers, security groups, subnets, network services, and compute metadata, and models these dependencies as native cloud entities. Unlike any other observability vendor, Dynatrace provides full access to the raw observability data in Grail via Dynatrace Query Language (DQL), unlocking powerful exploratory analytics use cases. Each entity includes the complete unprocessed definition of the cloud service as JSON, covering metadata, resources, configuration, security, and networking details, and tags, making this information fully transparent and directly queryable. This unified model delivers immediate customer value:
- Security posture and exposure analysis: detect publicly reachable endpoints, analyze real security group and network policy paths, and prioritize fixes based on true blast radius and reachability.
- IAM hygiene and drift control: uncover risky role sharing across Lambdas, identify configuration drift across accounts and regions, and validate whether access paths reflect intended policy.
- Cost optimization: identify x86 vs ARM workloads, right-size EC2, RDS, and EBS based on real utilization, and connect cloud spend to actual service dependencies to make safer cost decisions.
- Architecture & multi-account visibility: map cross-VPC and cross-region dependencies, unify runtime topology across all cloud accounts, and eliminate hidden or forgotten resources.
- Operational readiness & risk reduction: understand how misconfigurations or outages propagate through infrastructure and into applications, improving impact assessment and response.
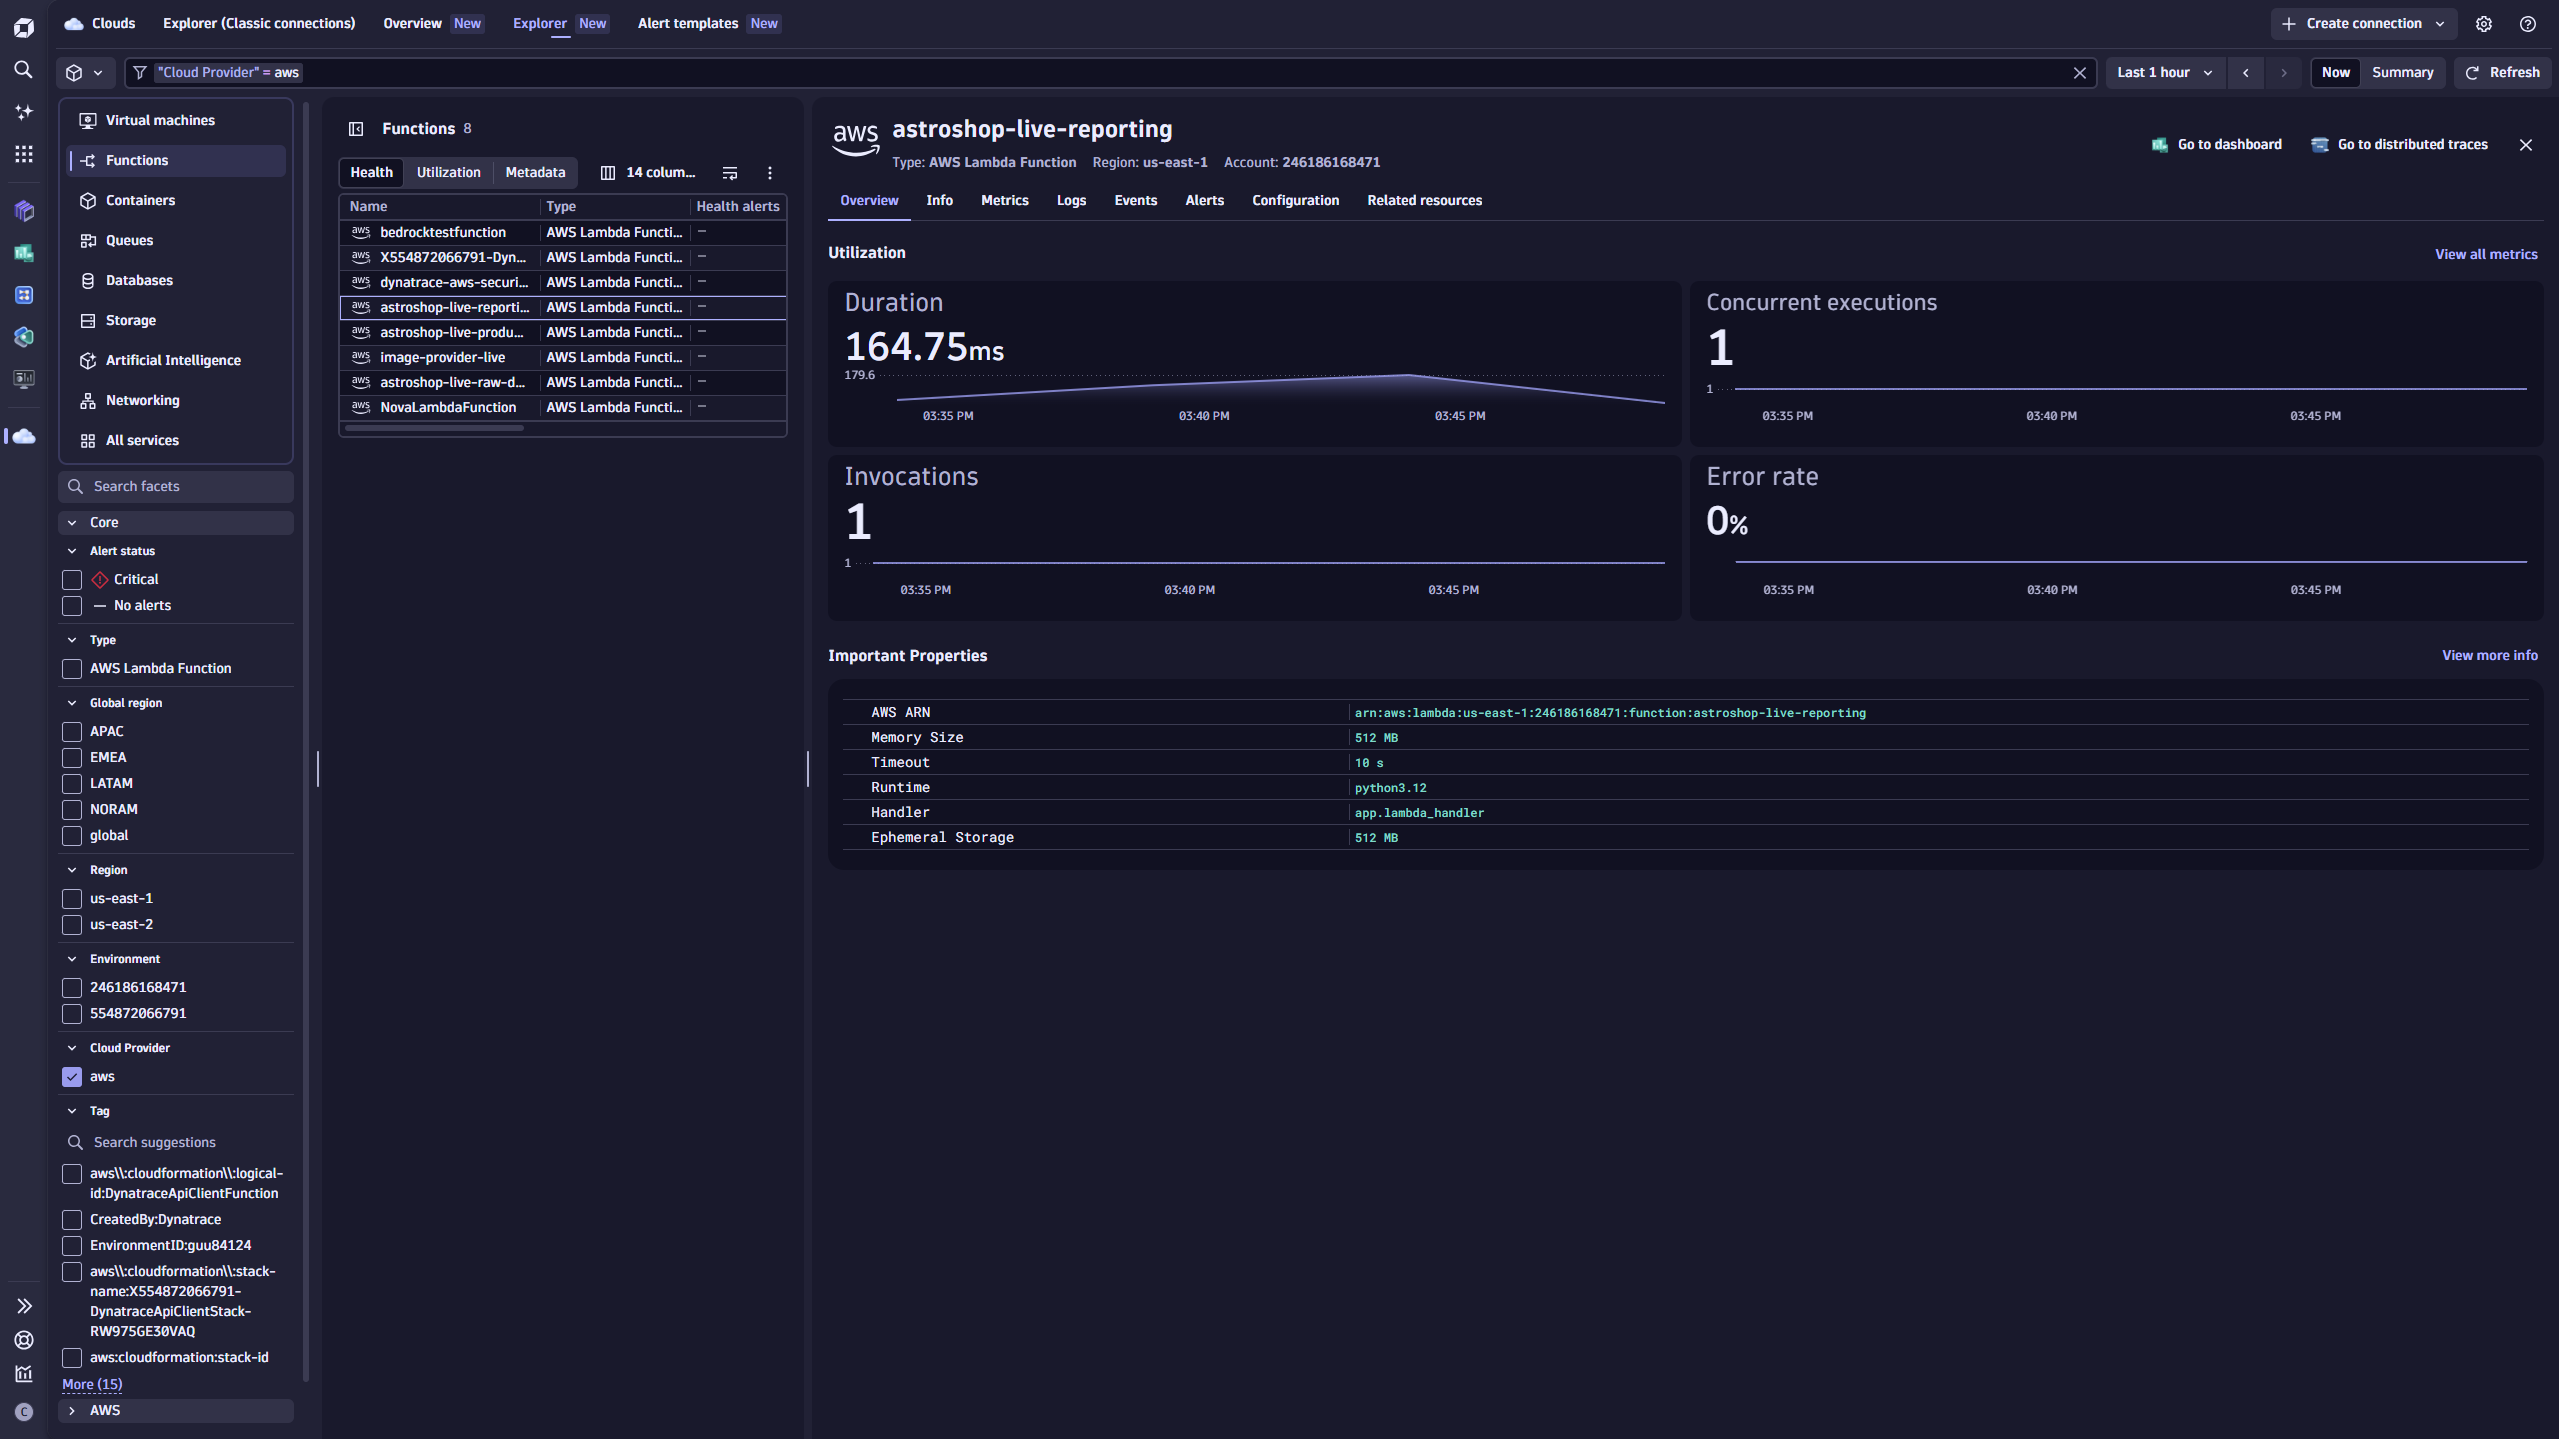
The Clouds app provides comprehensive insights and metadata, including metrics and logs for your services, deep insights into resource configurations and cloud topology, and the ability to leverage your cloud tags for access and visibility. With Clouds, teams can interactively explore and analyze their cloud estate, apply segment filters, follow connectivity paths, and compare environments.
Understand your entire setup at a glance through advanced visual analytics
The new Smartscape app’s domain-specific views turn complex, multi-layered cloud estates into something teams can understand instantly. Visual exploration makes it easier to:
- Understand real, observed connectivity between workloads across VPCs and environments, enriched with cloud networking context such as subnets and security constructs.
- Instantly understand problems and their blast radius with affected entities clearly highlighted.
- Identify hidden relationships or unintended dependencies that spreadsheets or lists will never surface.
- Validate migration plans, architectural assumptions, and segmentation strategies before changes go live.
Create a single source of production truth with flexible views and segmentation across cloud dimensions, including tags, accounts, regions, environments, and ownership.
This visual context is often where the “aha” moments happen, the point where teams finally see how their cloud is structured, where risks live, and where optimizations will have the greatest impact.
Utilize DQL for advanced insights customized and enriched with what matters to you
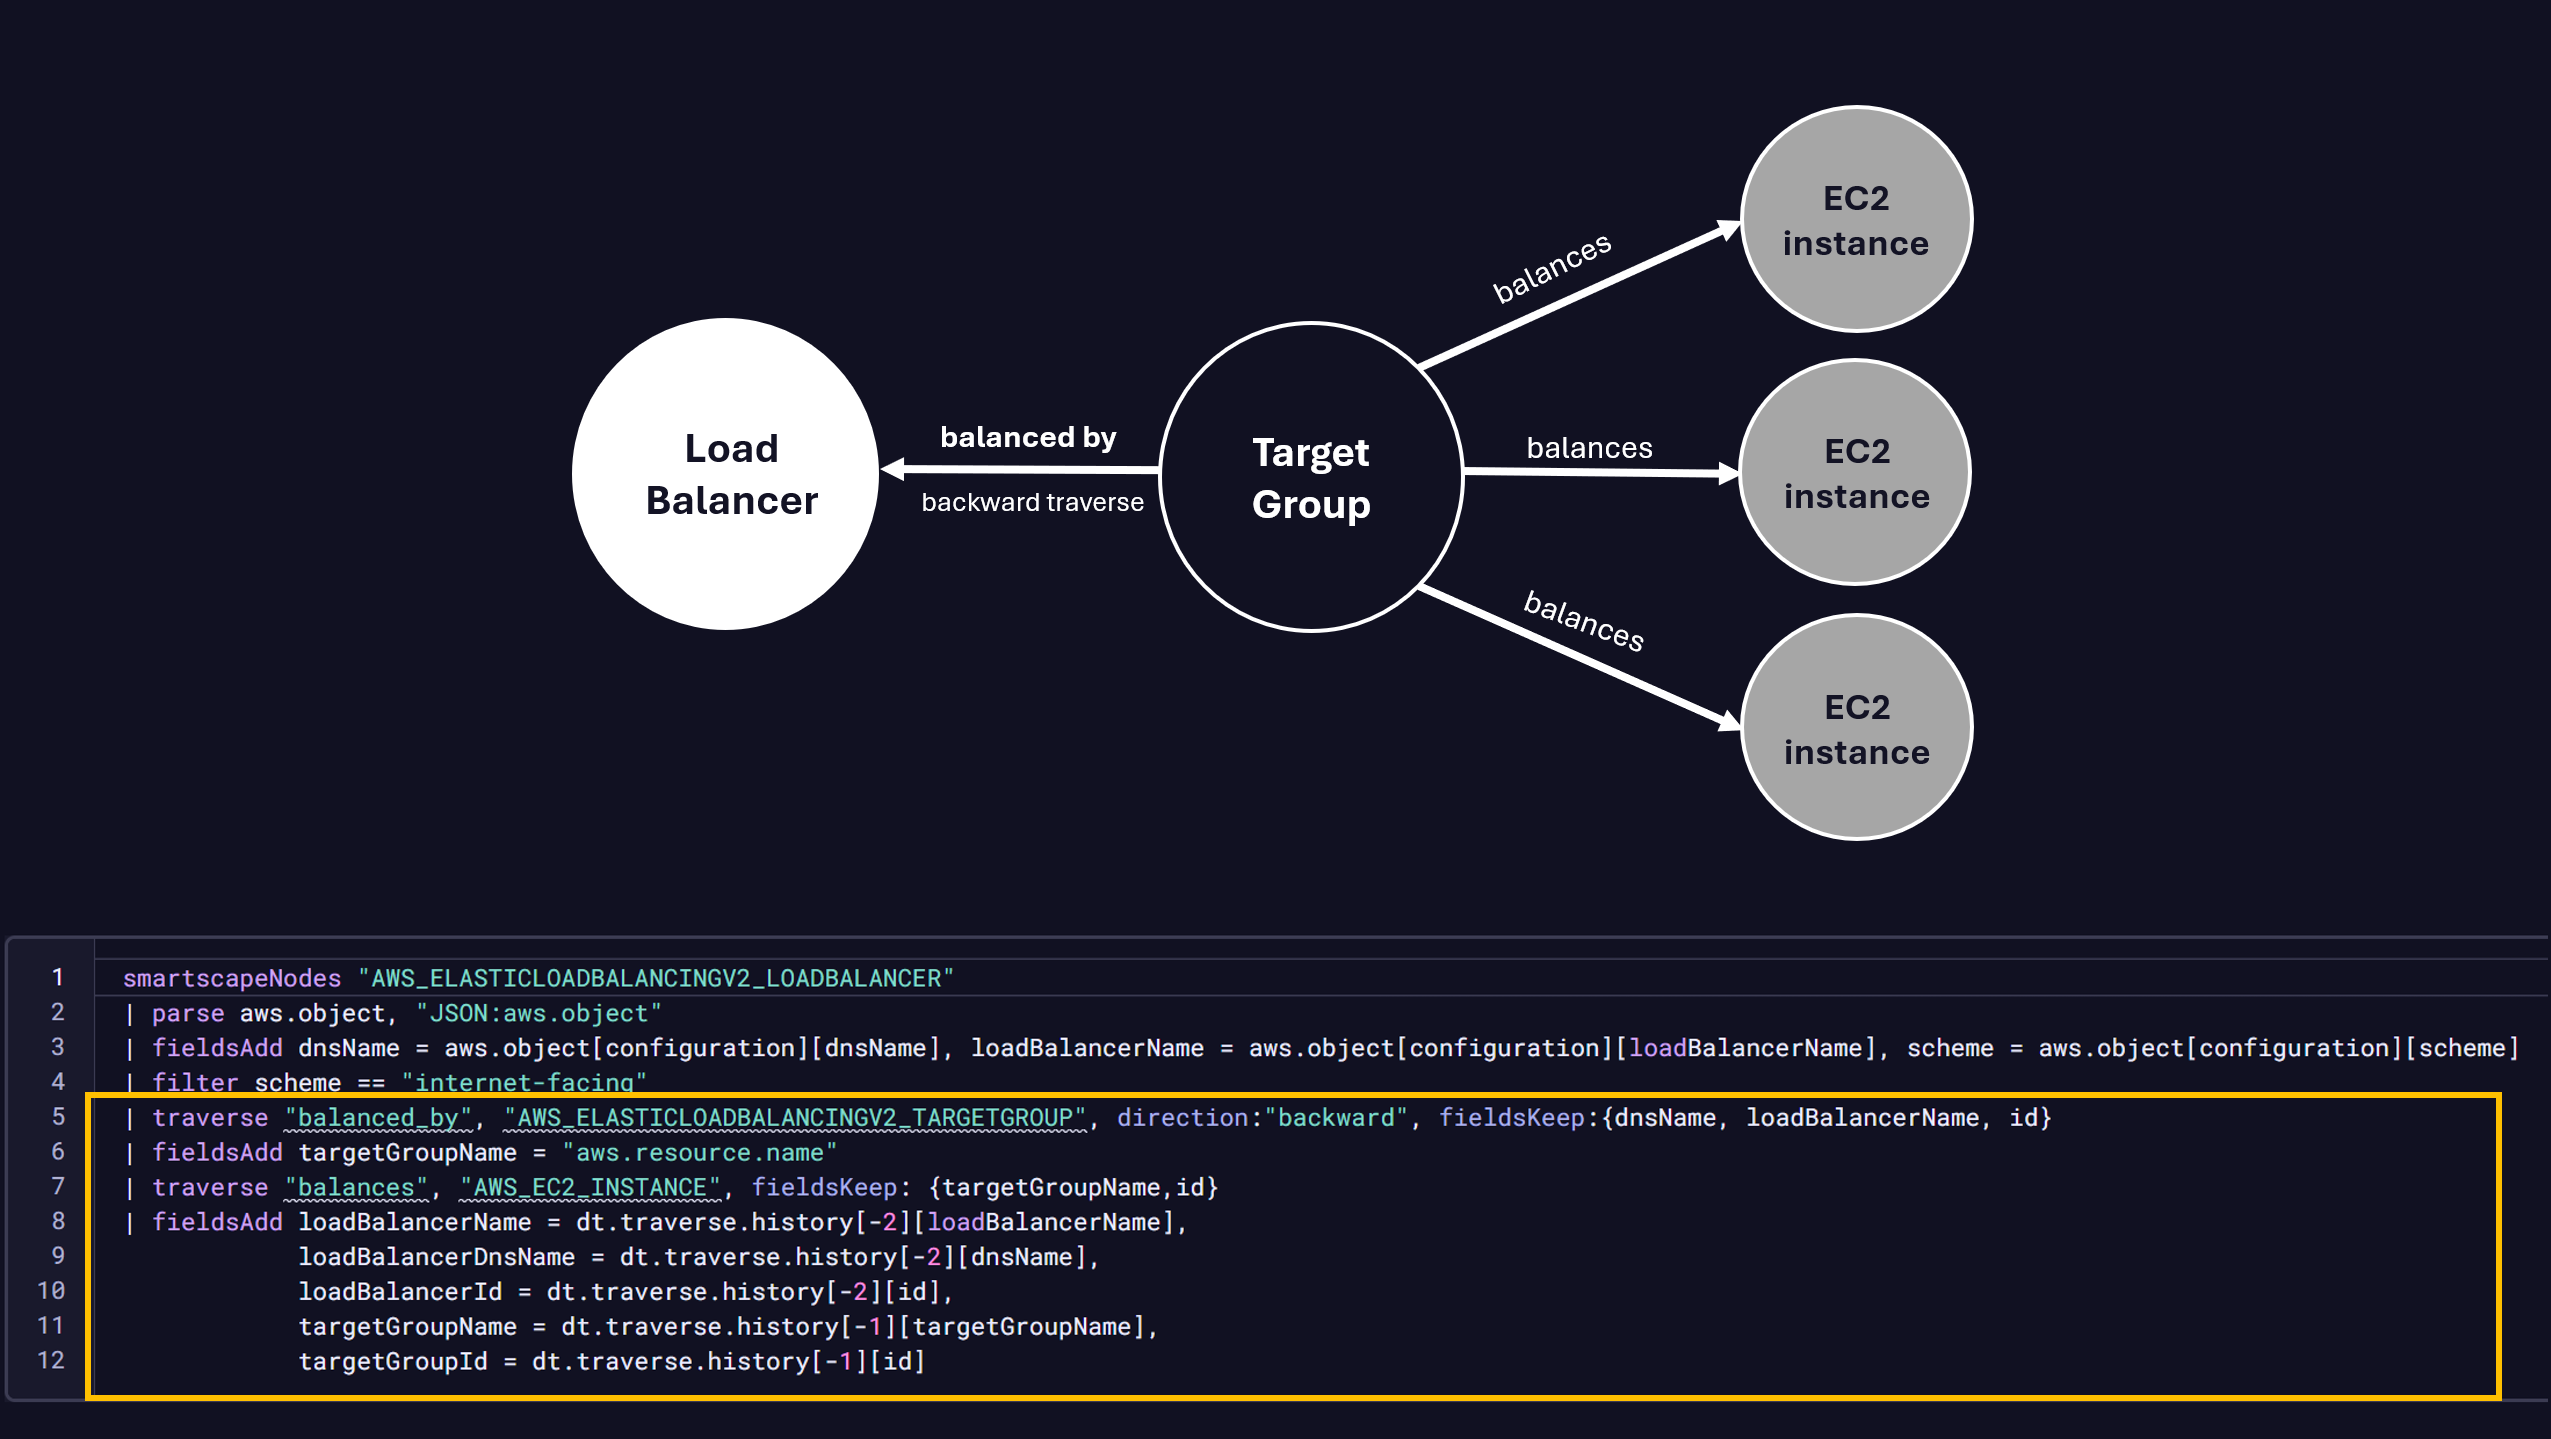
For deeper investigation or automation, DQL lets teams query relationships, join topology with logs and metrics, and run impact assessments programmatically. These queries can be operationalized through dashboards and notebooks. Learn more about how to utilize the new Smartscape DQL commands to query the AWS topology.
Kubernetes: how Smartscape gives you clarity on fast-moving, complex clusters
Kubernetes environments evolve continuously: pods appear and disappear within seconds, configurations drift, and a single missing reference in a YAML file can cascade into service failures across namespaces, or even clusters. While traditional tools expose fragments of this reality, they fall short when teams need complete answers to foundational questions like what does this depend on?, what changed?, or why did this break?
Smartscape further enhances Dynatrace Kubernetes observability by unifying Kubernetes objects, relationships, and configurations across clusters and clouds into a single, real‑time dependency graph. Instead of jumping between kubectl commands, point‑in‑time UIs, and disconnected dashboards, teams gain a continuously updated, system‑level view of how their Kubernetes environments actually behave.
With enhanced ingest, Smartscape now captures all major Kubernetes object types, including ConfigMaps, Secrets, Ingress, PV/PVC, workloads, services, and namespaces, and stores their full YAML definitions and metadata directly in Grail. Teams can query configurations across clusters and clouds, trace live end-to-end dependency paths, and automatically surface misconfigurations, missing references, policy violations, and drift. What was previously scattered across files and tools becomes instantly explorable context, at a global scale. The value of Smartscape can be felt immediately:
- Faster troubleshooting: trace live relationships across clusters, namespaces, workloads, and services to pinpoint drift or misconfigurations that cause runtime failures.
- YAML misconfiguration detection: identify missing references, invalid fields, or policy violations with full YAML-in-context, and regenerate correct configurations using Dynatrace Intelligence.
- Ephemeral awareness: retain visibility into short-lived workload changes or crashes that normally disappear before engineers can inspect them.
- Policy and compliance enforcement: check networking, storage, config maps, resource quotas, and image standards at the object level for stronger governance.
- Safer releases: segment clusters by team or namespace and visualize impact paths before and after deployments to reduce risk and improve deployment confidence.
All enhanced Kubernetes insights and YAML definitions are directly accessible within the Kubernetes app.
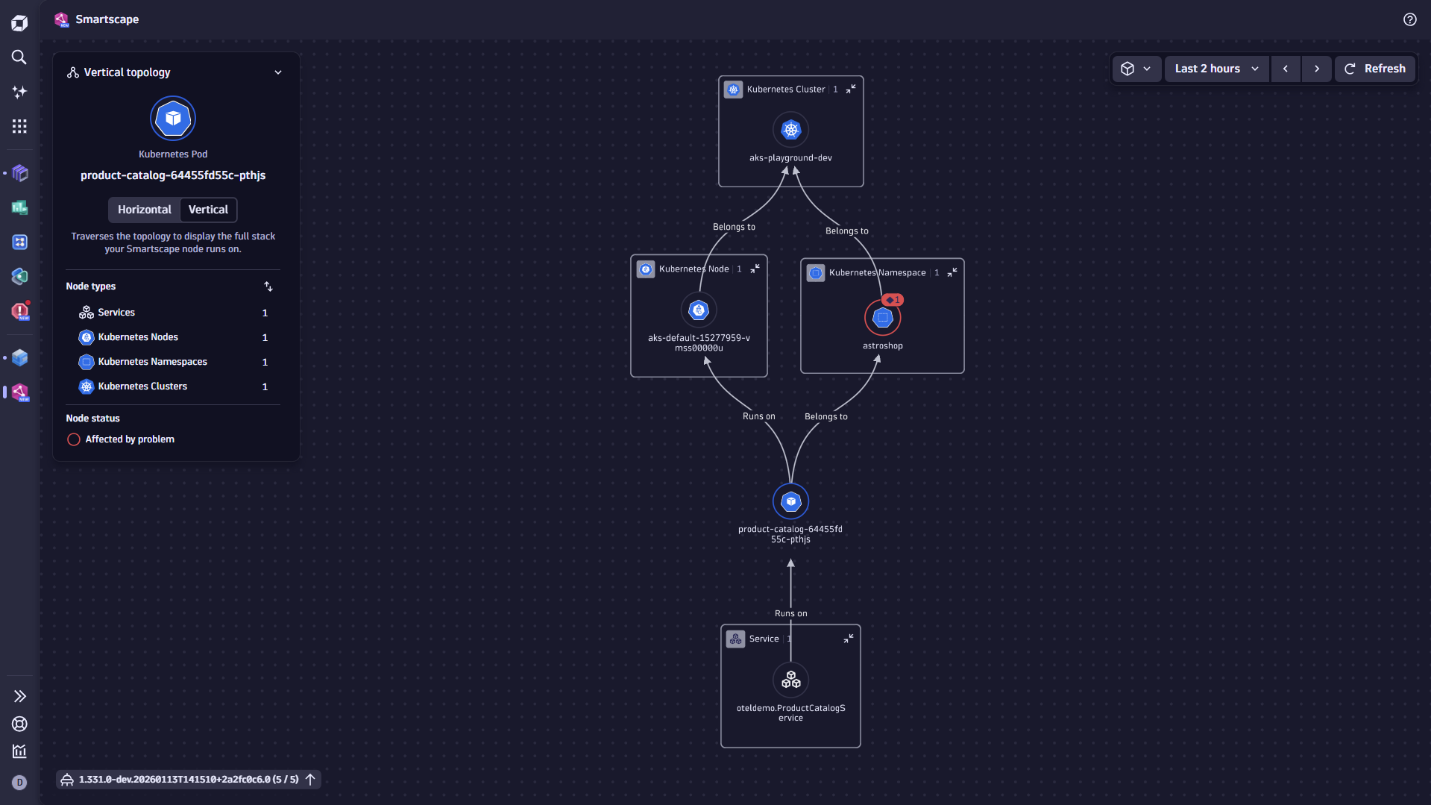
In Smartscape, access the Kubernetes domain view, where you can:
- Visualize cluster topology for instant clarity on structure and relationships.
- Follow real dependency chains across namespaces, workloads, services, and underlying infrastructure to understand impact paths.
- Segment clusters dynamically by team, namespace, environment, or workload identity for precise context.
- Isolate critical workloads or namespaces for focused investigation and remediation.
- Validate architectural assumptions by comparing expected versus actual relationships.
For advanced analytics, DQL lets you query Kubernetes objects, relationships, and signals at scale. For actual use cases and examples, check out this notebook on the Dynatrace Playground.

Other domain-specific enhancements, from infrastructure to services
The new Smartscape unlocks a broader range of high-impact use cases across every layer of your IT environment, with topology-enriched information across apps; many new ways to explore your data via DQL, and several additional, use-case-optimized Smartscape views. Below are some additional examples and inspiration to help you get started:
Services
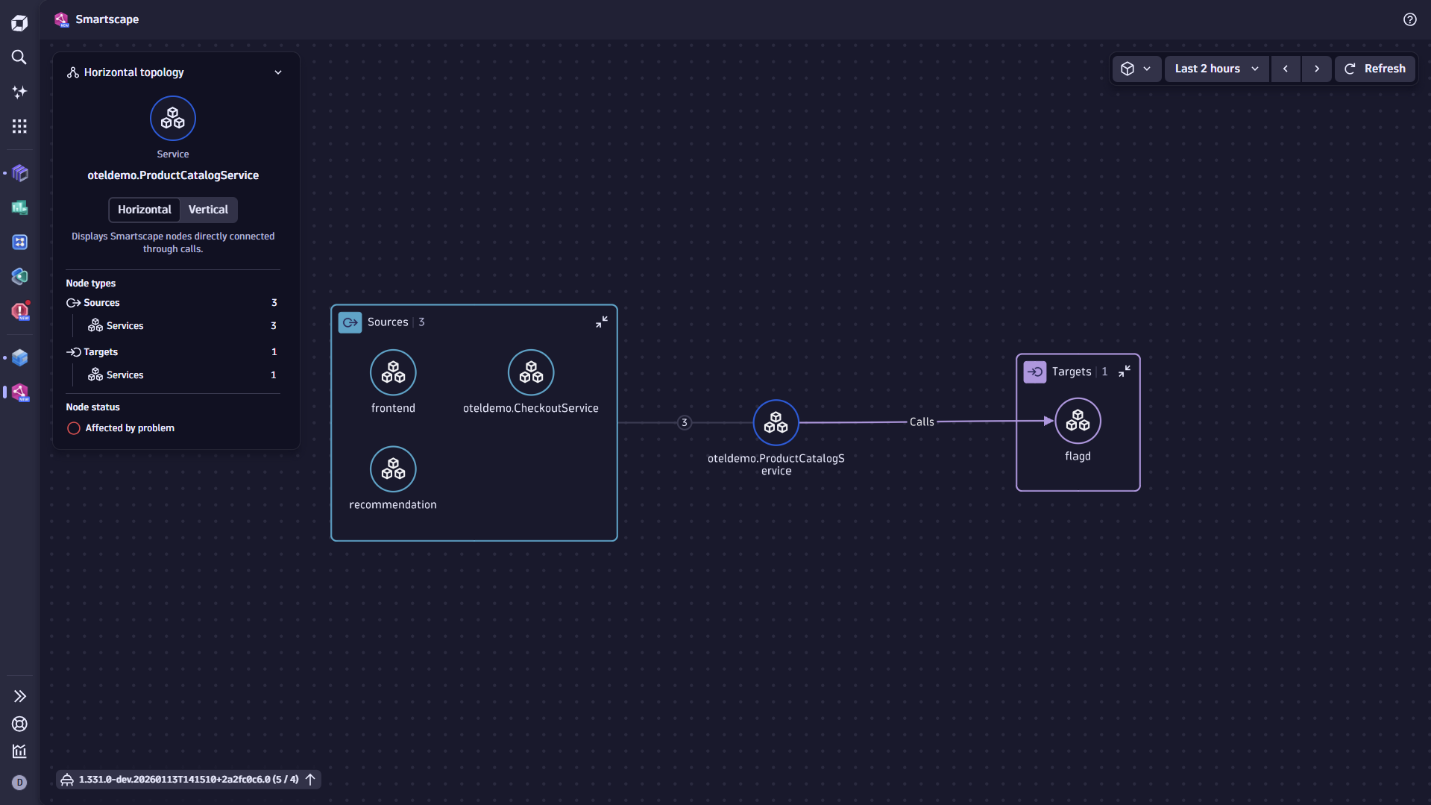
Smartscape now gives you deeper insight into how services connect and communicate in real time. By modeling upstream and downstream dependencies alongside KPIs and infrastructure anchors, Smartscape makes it easier than ever to understand how services interact, where failures originate, and how changes ripple across the stack.
With the new Service Dependency Graph view, teams can instantly visualize their service landscape. The interactive graph makes it easy to follow call flows, isolate a single service and its direct dependencies, highlight performance or error hotspots, and identify unexpected communication paths. Apply your own business context, for example, ownership, to help teams see how services come together to deliver business functionality.
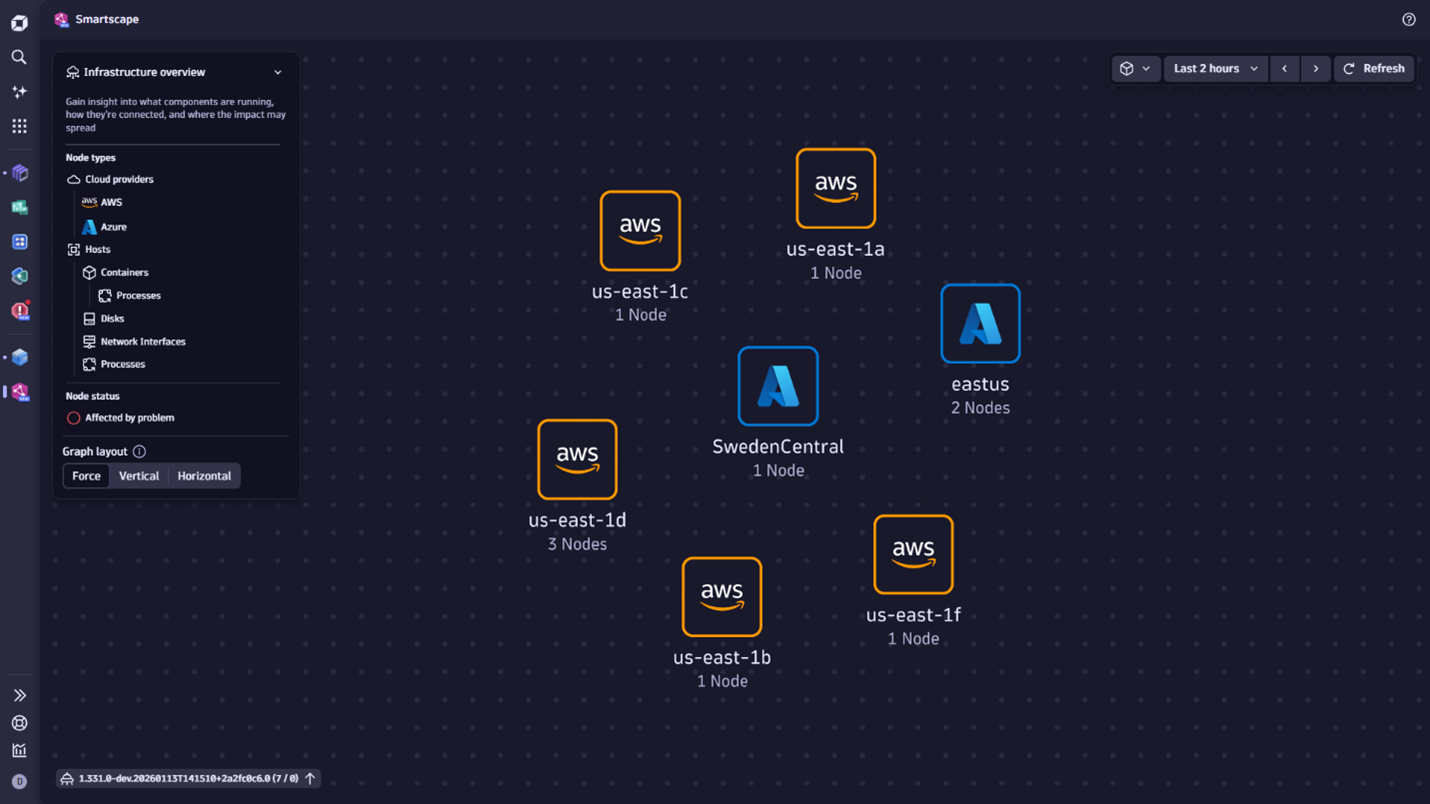
Infrastructure
Smartscape expands visibility into infrastructure by mapping all running components, showing how they’re connected, and identifying how performance issues might impact other critical services. The Infrastructure Overview turns this into an intuitive, navigable map that lets teams focus on the data relevant to them and spot bottlenecks or drift patterns through topology shape. Building on this foundation, upcoming Dynatrace enhancements will allow teams to visually inspect host‑to‑process chains and explore network paths enriched with SNMP/LLDP data.

Problems
Smartscape enhances problem analysis by automatically connecting detected anomalies to the entities and dependencies they impact across your environment. This shows not only what is broken, but how issues propagate across services, workloads, and infrastructure, giving teams immediate clarity on root cause and blast radius. The Problem Graph highlights affected entities, correlates related anomalies, allows for impact isolation, and provides AI-powered insights in context.
End-to-end discovery
The Smartscape app also exposes your entire digital ecosystem as one coherent model, visualizing all dependencies and connecting cloud resources, Kubernetes clusters, infrastructure components, and services end-to-end in the Smartscape on Grail view. This allows teams to understand the real system structure, uncover hidden dependencies, and validate architectural assumptions with complete context rather than piecemeal data.

Experience the new Smartscape today
Smartscape changes how teams operate by providing automatic, real-time context across all domains, enabling faster troubleshooting, safer releases, stronger security posture, and more cost-efficient operations.
- Explore domain-specific views for AWS EC2, Kubernetes, Infrastructure, and Services, with Azure coming soon.
- Run impact analysis with DQL graph queries.
- Combine topology with logs/metrics/traces/RUM for full stack insights.
- Let Dynatrace Intelligence take safe, informed actions based on production truth.

Looking for answers?
Start a new discussion or ask for help in our Q&A forum.
Go to forum