
The Dynatrace MCP Server is now available in Port via Port MCP Connectors. A single OAuth flow connects it in minutes. Set up Port AI to communicate with Dynatrace, GitHub, Slack, and your service catalog in a single conversation, correlating production signals, code, and ownership in a single agent run rather than three browser tabs and a manual handoff. For incident triage, this turns a multi-tool investigation into a single prompt: just ask Port AI what’s wrong; you’ll get details about the failing service, the error signature, the file and function, and the suspect commit.
Ground every Port AI conversation in live production data from Dynatrace
Port is an agentic engineering platform that platform teams use to organize their software development lifecycle. It gives software and DevOps teams a central place where engineers can find system information, take action on it, and route work across their connected tools, without waiting on IT or operations.
Port AI is the assistant that queries the catalog using natural language. Through Port MCP Connectors, the same chat also reaches external systems, such as Dynatrace, GitHub, and Slack.
Dynatrace complements Port by providing context-rich observability and security insights, right where you need them:
| What Dynatrace brings | What Port brings |
| Live observability signal across logs, traces, and metrics | Service ownership and team responsibility |
| Dependency topology between affected services | On-call rotation and escalation paths |
| Open problems with root cause already identified | Recent deploys and commit history per service |
| Security vulnerabilities and exposures detected in running services, with severity and affected entities | Remediation ownership and the team that’s accountable for the fix |
The result: Team members ask a question in the Port AI chat, where they’re already working, and get back complete answers that no single tool could produce on its own.
![Complete triage run with Port AI [VIDEO]](https://play.vidyard.com/s44G2jTPhz5XXL73GHBRUh.jpg)
Incident triage from a single Port AI prompt
The Dynatrace MCP Server provides Port AI with a set of tools it can call during any conversation. For incident triage, the most relevant needs are:
- Query production data. Logs, traces, metrics, and events from across the Dynatrace tenant returned in structured form.
- List open problems. An overview of all active problems on the tenant.
- Get problem details. Root cause, causal chain, and affected entities for a specific problem.
- Get troubleshooting guidance. Relevant troubleshooting guides matched to a problem description.
The full toolset also covers security findings, entity and topology lookup, query generation, forecasting, and more. See the Dynatrace Hub for the complete list. In combination with Port AI, these capabilities turn the Port AI chat into a single place to ask production questions.
The example below walks through the triage of an incident affecting broker_service, a fictional service. The same investigation, done manually without this integration, starts in Dynatrace (where the failing service shows up in seconds), then jumps to GitHub to scan recent commits, to Slack to confirm ownership, and back to a doc to write up the summary. With this Port AI integration, those steps run in a single agent run, with the Dynatrace signal at the center of the chain.
The scenario begins when broker_service degrades and lands as a new incident, INC-1003. In Port AI chat, an SRE asks, “Help me understand the root cause of INC-1003.”
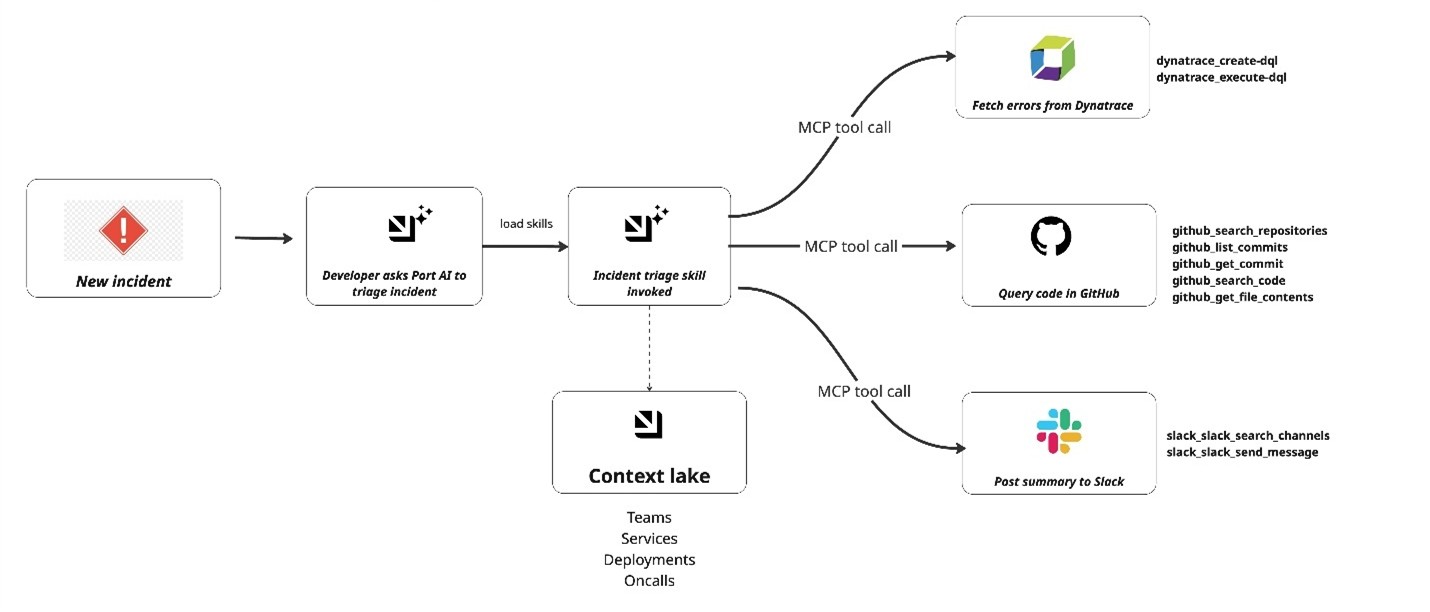
Port AI loads the ai-incident-triage skill and runs the following steps:
- Resolve the incident in Port’s catalog. Port AI looks up the incident entity and pulls the affected service identifier.
- Query Dynatrace. The Dynatrace MCP Server queries logs and traces for broker_service. The response carries the first-seen failure timestamp and the top error signature.
- Find the suspect commit in GitHub. Port AI passes the failure window to the GitHub MCP Server, locates the failing function, and lists the commits to that file. One commit aligns with the first-seen timestamp.
- Return a structured triage summary. Port AI returns the failing service, the error signature, the file and function, and the suspect commit.
- Post to Slack and close the loop. The Slack MCP Server posts the same summary to #incident-updates (Figure 2). The incident entity records a triaged_at timestamp through a Port self-service action.
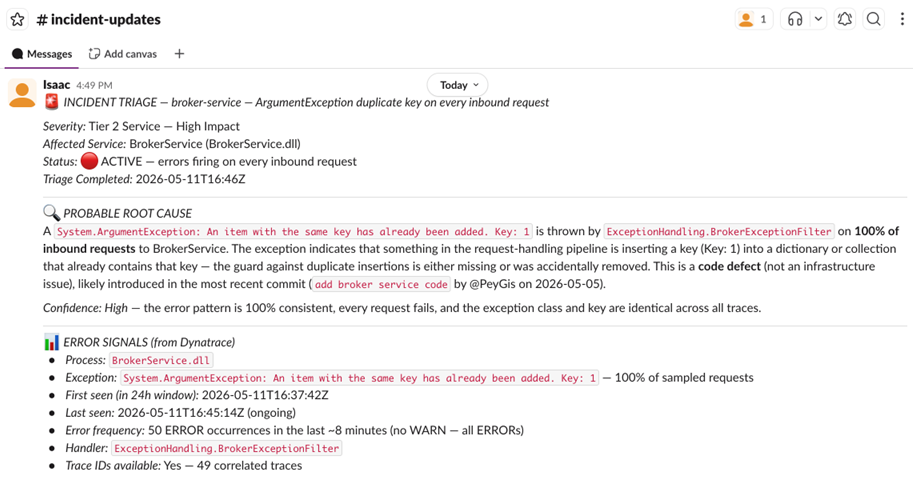
Within a single agent run, the engineer receives a triage summary in Slack that already includes the live Dynatrace signal.
The same Dynatrace integration allows many more use cases, such as deployment correlation, on-call summaries, and postmortem drafts, each built as a Port AI skill.
Security triage works just as easily: ask Port AI about a vulnerability; the Dynatrace MCP Server returns the affected running services, severity, and exposed entities, while Port resolves ownership and routes the fix to the accountable team.
Roll it out across teams, govern centrally
The integration is designed for organization-wide rollout. Admins maintain central control over which tools are exposed and who can access them, while each query remains scoped to the user’s existing permissions.
- Per-tool selection. Admins choose which Dynatrace tools Port AI can call across the organization. Sensitive tools can be scoped to selected groups.
- Per-user authentication. Each user authenticates to Dynatrace through OAuth. Queries return only the data that their existing Dynatrace permissions already allow.
- Audit trail on both sides. Every Port AI call and every Dynatrace MCP call names the same person, with no stitching required between platforms.
- Scales without new workflows. The same per-user model that works for a pilot team works for hundreds of developers. No separate access-request workflow needed.
Get started: connect Port with Dynatrace
The Dynatrace MCP Server connects to Port through a single OAuth flow. Setup takes a few minutes and is done once by an admin.
- Add Dynatrace as a data source. In Port, go to Data Sources > + Data source > MCP Servers. Select Dynatrace, fill in the connector details, and select Connect to authenticate with your Dynatrace tenant.
- Expose the tools you want Port AI to use. Under Allowed Tools, add the Dynatrace capabilities you want available to your organization (querying production data, listing problems, getting problem details, finding troubleshooting guidance). Select Publish.
- Register the incident triage skill. Add the ai-incident-triage skill from Port’s skill library and point it at the incident entities in your catalog.
Once published, the integration is available to every authenticated Port user in your organization. Each user authenticates to Dynatrace individually through OAuth on first use.
For full setup walkthroughs, see Port documentation
Port MCP Connectors documentation: connector setup and admin configuration
Triage incidents with AI: full skill walkthrough


Looking for answers?
Start a new discussion or ask for help in our Q&A forum.
Go to forum