Performance improvement is the art and science of making online applications faster, while performance optimization is the art and science of making online applications efficient. While these two concepts are very closely related, using the homepage of a high-end specialty retailer, this article will show how a focused performance optimization effort can
- Shrink page size by nearly 40%
- Reduce CSS and JavaScript files by more than 75%
- Decrease Hosts and Connections on the page by up to 50%
- Improve overall response time by 40% as a result
- Have little or no effect on the overall site design seen by customers
Even optimization can’t find every issue, and it is often these lower priority or browser/device specific items that become roadblocks in succeeding in both performance improvement and optimization efforts. We’ll highlight how one overlooked item inadvertently affected the performance for a large group of customers.
The Case for Optimization
While it is not always true that performance improvement requires performance optimization, it is almost universally true that performance optimization leads to performance improvement. Improvement can sometimes be achieved through methods that don’t require any deep inspection of site mechanics (CDNs, adding more hardware, etc.), but optimization relies on clear thinking about how individual applications are built and delivered to the customer with an eye to addressing fundamental questions such as
- How do we reduce the number of JavaScript and CSS requests by 50% while still ensuring that the customer experience is not affected?
- Do we know where all of the third-party content on our site originates? Can we quickly and effectively control or disable poor performing third parties?
- Do we have standards for image size, resolution, and quality that all content providers in the organization adhere to prevent the inadvertent slowing of page response?
- Do we audit the site regularly to detect content that does not meet the standards or may be causing performance issues?
- Have we verified that all optimizations work with the top 5 customer browsers and devices?
An initial examination of the page highlighted that the site relied on a large number JavaScript and CSS files to be loaded when a first time visitor arrives at the site.
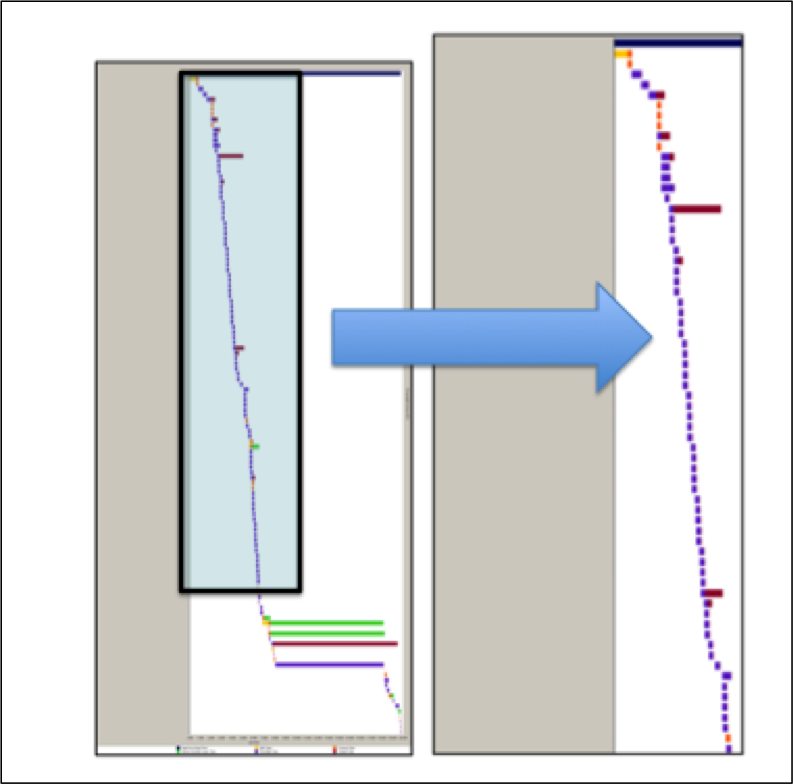
An organization focused on performance improvement would be immediately drawn to the slow objects at the bottom of the waterfall, with a focus on determining the root cause of the slow performance and identifying internal applications or third-party services that needed to be investigated.
Companies that have included a focus on optimization in their performance analysis would also ask another question: Does the performance of those objects affect the customers’ perception of page performance?
Full-page measurement and perceived performance measurement address two different concerns. Full-page measurement reports on performance as the time to completely load all of the objects on a transaction step that have been requested on that step, either from HTML, or from CSS and JavaScript requests that further modify the page. Perceived performance measurement provides data on when the page was complete enough for customers to interact with it, regardless of the objects remaining to download.
Following web performance best practices, objects that provide services that are not directly related to the business purpose of the page – analytics, customer feedback polls, advertising, customer support chat services, etc. – are placed below the most critical content to prevent this important but not critical additional content from accidentally interfering with the customer experience.
For the page being studied here, the objects at the bottom of the waterfall should be investigated for their effect on the complete page load time, but the customer who is visiting the page probably was interacting with it before these objects finished downloading.
If content at the bottom of the page is not critical to customer experience, what is worth investigating by the performance optimization team? Looking at the page in the light of optimization, a likely place to start is by determining how to reduce the 45 JavaScript and CSS file requests required by a first-time visitor.
Let’s start with the good news: repeat visitors don’t have to load these files across the internet every time they visit the site. The team that initially configured this site placed a heavy reliance on client-side caching for follow-on requests. Comparing a first-time visit and to a returning visit in AJAX Edition shows that the cached column only captured the first 4 requests returning to the origin server on the page reload, with the remaining CSS and JS files being pulled directly from the browser cache.
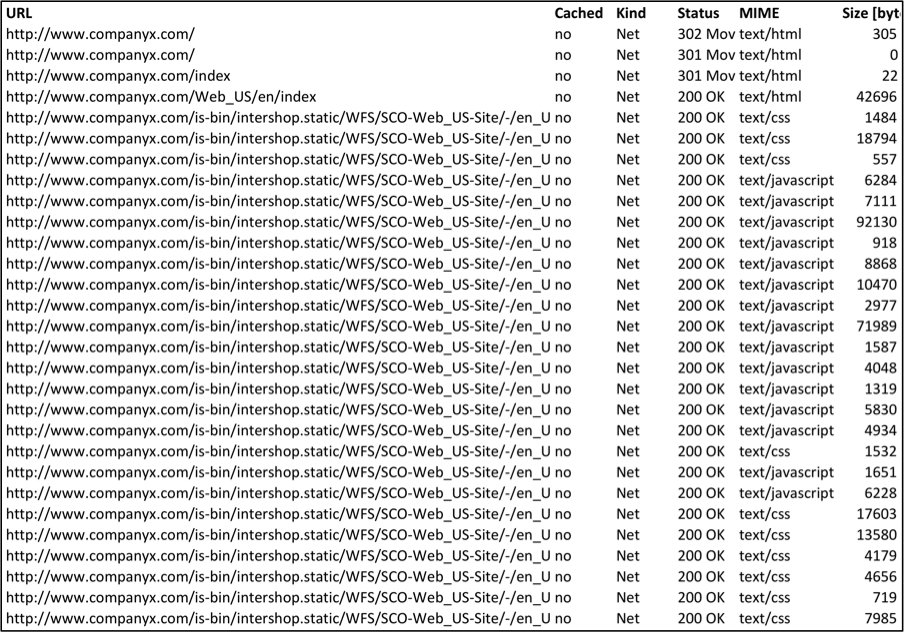
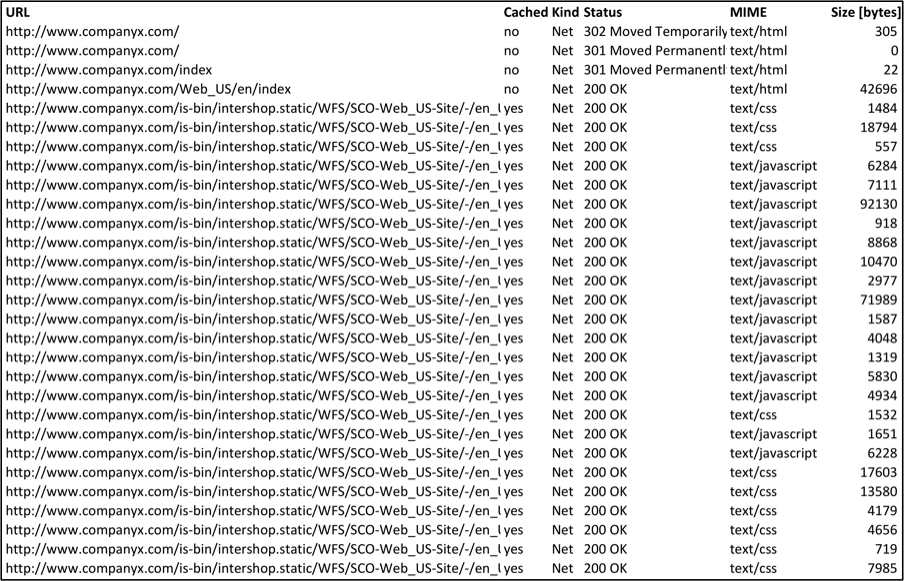
By designing their site so that the first-time visitor incurs a minor performance penalty by loading all 45 of the JavaScript and CSS files upon entering the site, the developers were counting on the performance improvement gain that would result for other pages visited during the customer session through loading the CSS and JavaScript files and pulling them from local cache. But does the first-time visitor need to pay such a performance penalty? Can the performance of this page be optimized to squeeze even more performance improvement out of it?
Optimizing the Page
All of the data above indicates that the page could get faster through means other than acceleration. With the help of Joshua Bixby of Strangeloop, I ran the sample site through their automated Front-End Optimization (FEO) algorithm. The Strangeloop system returned results strongly indicating that there is still more that could be done to improve performance through optimization.
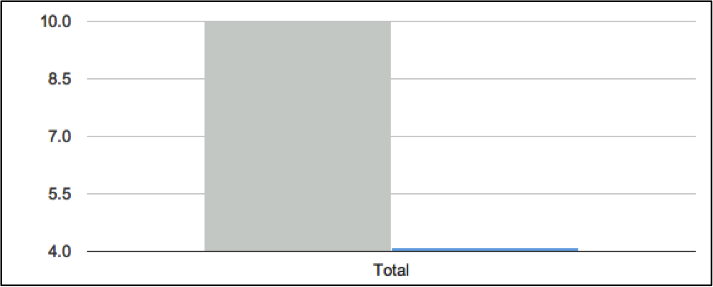
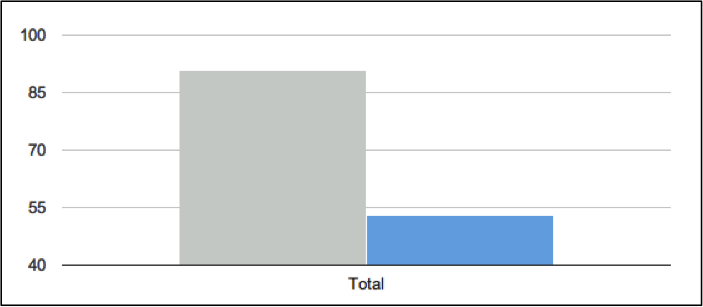
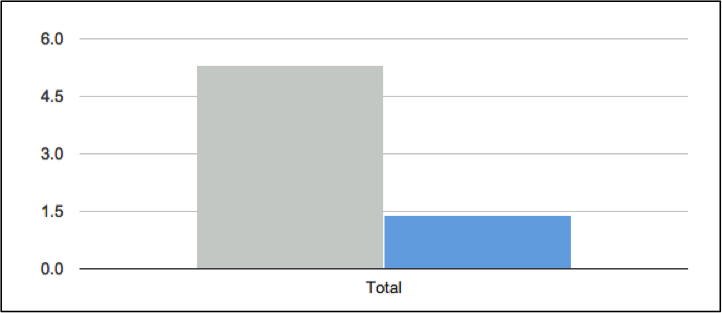
I used an automated FEO system because I did not have access to the developers and systems for the example page, and could not begin to determine the complex interactions between the CSS and JavaScript files on my own without a great deal of effort.
The team that develops and maintains this site should be easily able to ask and answer questions, like:
- Can we reduce the number of CSS and JS files through consolidation and minification?
- Is it better for customer experience to spread loading of CSS and JS files throughout the site on a need-to-use basis rather than loading all required CSS and JS files on the first page?
After asking these questions, then developing, implementing, and testing the optimization answers, the development and business teams can make a deployment decision that ensures that the performance optimization process does not interfere with the desired customer experience in a way that affects brand and revenue.
This site serves as an excellent example of performance optimization at work. A week after the initial data was collected, the number of objects on their page was cut by more than a half, having a dramatic effect on all aspects of the page construction and performance, including a 1.5-2.0 second performance improvement.
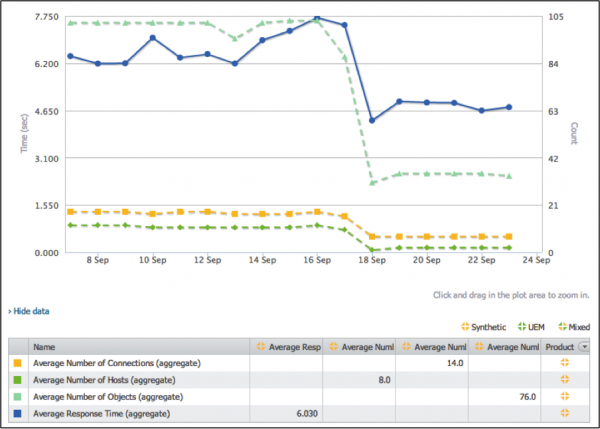
One of the most obvious areas of performance optimization was in the number of CSS and JavaScript files on the page, with the 45 files dropping down to 11 files. But that’s not the whole story. Using two-hour snapshots from before and after the optimization shows that the Application content, primarily composed of Flash content, made up the largest percentage of the page size before the optimization. After the optimization, this changed dramatically, with Flash being reduce a quarter of the original size.


To compensate for the removal of some of the Flash elements, it appears that the site chose to rely more heavily on JavaScript and images to provide the page design elements previously delivered by Flash.
Now that this optimization effort has been completed, is it time to stop? No, because there are likely further optimizations that will be discovered that will drive other incremental improvements.
Missed One – Browser-Specific Optimizations
The site made great strides forward. Except in one area – cross-browser compatibility.
Deeper examination of the data shows that the page delivered for Firefox – the primary study engine so far – is now approximately 577,000 bytes, down from 924,000 at the start of the data collection. But this page size reduction does not transfer to the page delivered to IE8 users, which remains at nearly 920,000 bytes.
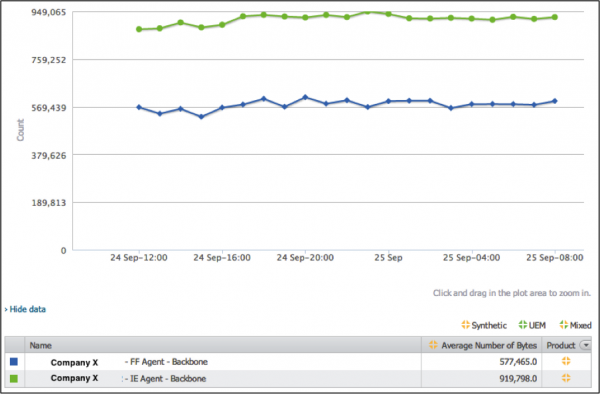
The clearest reason for this is in the size of text elements on the page. Where Firefox average 57,000 bytes of text content, the IE measurement averaged 130,000 bytes.


What is happening here? Some investigation found that this site uses Apache, which relies on an internal module, mod_deflate, to compress outgoing content using a set of rules defined in the Apache configuration files. Occasionally, when analyzing comparative page performance, we find sites that use old mod_deflate filters designed to respond to the bad behavior of certain older browsers when handling compressed JavaScript and CSS files.
If the majority of your visitors use web and mobile browsers that are from the last 5 years, these filters are most likely unnecessary, and sites such as Yahoo! have removed these filters to prevent accidental performance issues such as this.
[NOTE: If you have customers who use versions of IE that should have been made extinct over 10 years ago, their performance experience is likely not something that you can plan for, and your site is only one of many where these customers will experience performance issues.]Changing the mod_deflate rule to remove the delivery of uncompressed content to IE users is a very quick fix, that often only requires a server restart after the edits are made in the Apache configuration files.
The Case for Optimization and Improvement
This one page provides an example of how optimization can benefit performance improvement. The team that built the site understood how the components worked together, and what they needed to do to ensure that performance improvement and optimization efforts were successful without affecting the customer experience or the bottom line.
While this team tackled the project through a re-design and restructuring of the content, another approach to performance optimization would be to use one of the increasing number companies provide front-end optimization (FEO) solutions that automatically tackle the challenge of image optimization, file merges, concatenation, and JavaScript minification. As was seen by the Strangeloop example, the automated system was able to closely match the structure of the optimized site without any human intervention.
While the automated solutions are growing in sophistication and popularity, the manual approach is still the recommended first step. The best use of an FEO solution is to elevate page optimization to the next level, not use it as a crutch to support inefficient page design practices.


Looking for answers?
Start a new discussion or ask for help in our Q&A forum.
Go to forum