


From failed checkouts to disputed transactions, when something goes wrong in a digital customer journey, you often need more than metrics or events. You need to see what the user saw, what they did, and what exactly happened in the end-user browser or mobile application.
The new Session Replay lets you replay the full experience in context with logs, traces, events, and RUM data. With the support of Dynatrace Intelligence, you can understand issues faster, improve reliability, and resolve customer-impacting problems with less guesswork. Session Replay is built on the foundation of Dynatrace Grail, the unified data lakehouse, so user events and sessions stay connected with your logs, metrics, and traces — giving you powerful ways to find exactly the session you’re looking for. Session Replay then becomes the visual layer that brings those sessions to life,

In this blog post, we’ll cover what the new Session Replay unlocks for you, how it connects to your application stack, and how to easily get started today, now that it is generally available for all Dynatrace SaaS customers using Grail.
Session Replay is now connected to logs, traces, events, and RUM data with Grail
Built natively on the Dynatrace Grail unified data lakehouse, every recording lives alongside your full observability data, as seen in the demonstration above. With all data in one place, teams can investigate across sessions, logs, traces, biz events, and user and session events without manual stitching or tool-hopping.
See how Session Replay connects user actions, timeline events, and backend signals

Replay user sessions alongside the event timeline
We bring visual replay of the user’s browser and mobile app session to the next level. This includes requests, errors, user action events, and recently introduced User Interactions.
While you’re rewatching a session, the left side of the screen provides you with the chronological order of events and actions, also summarized and grouped in the timeline.
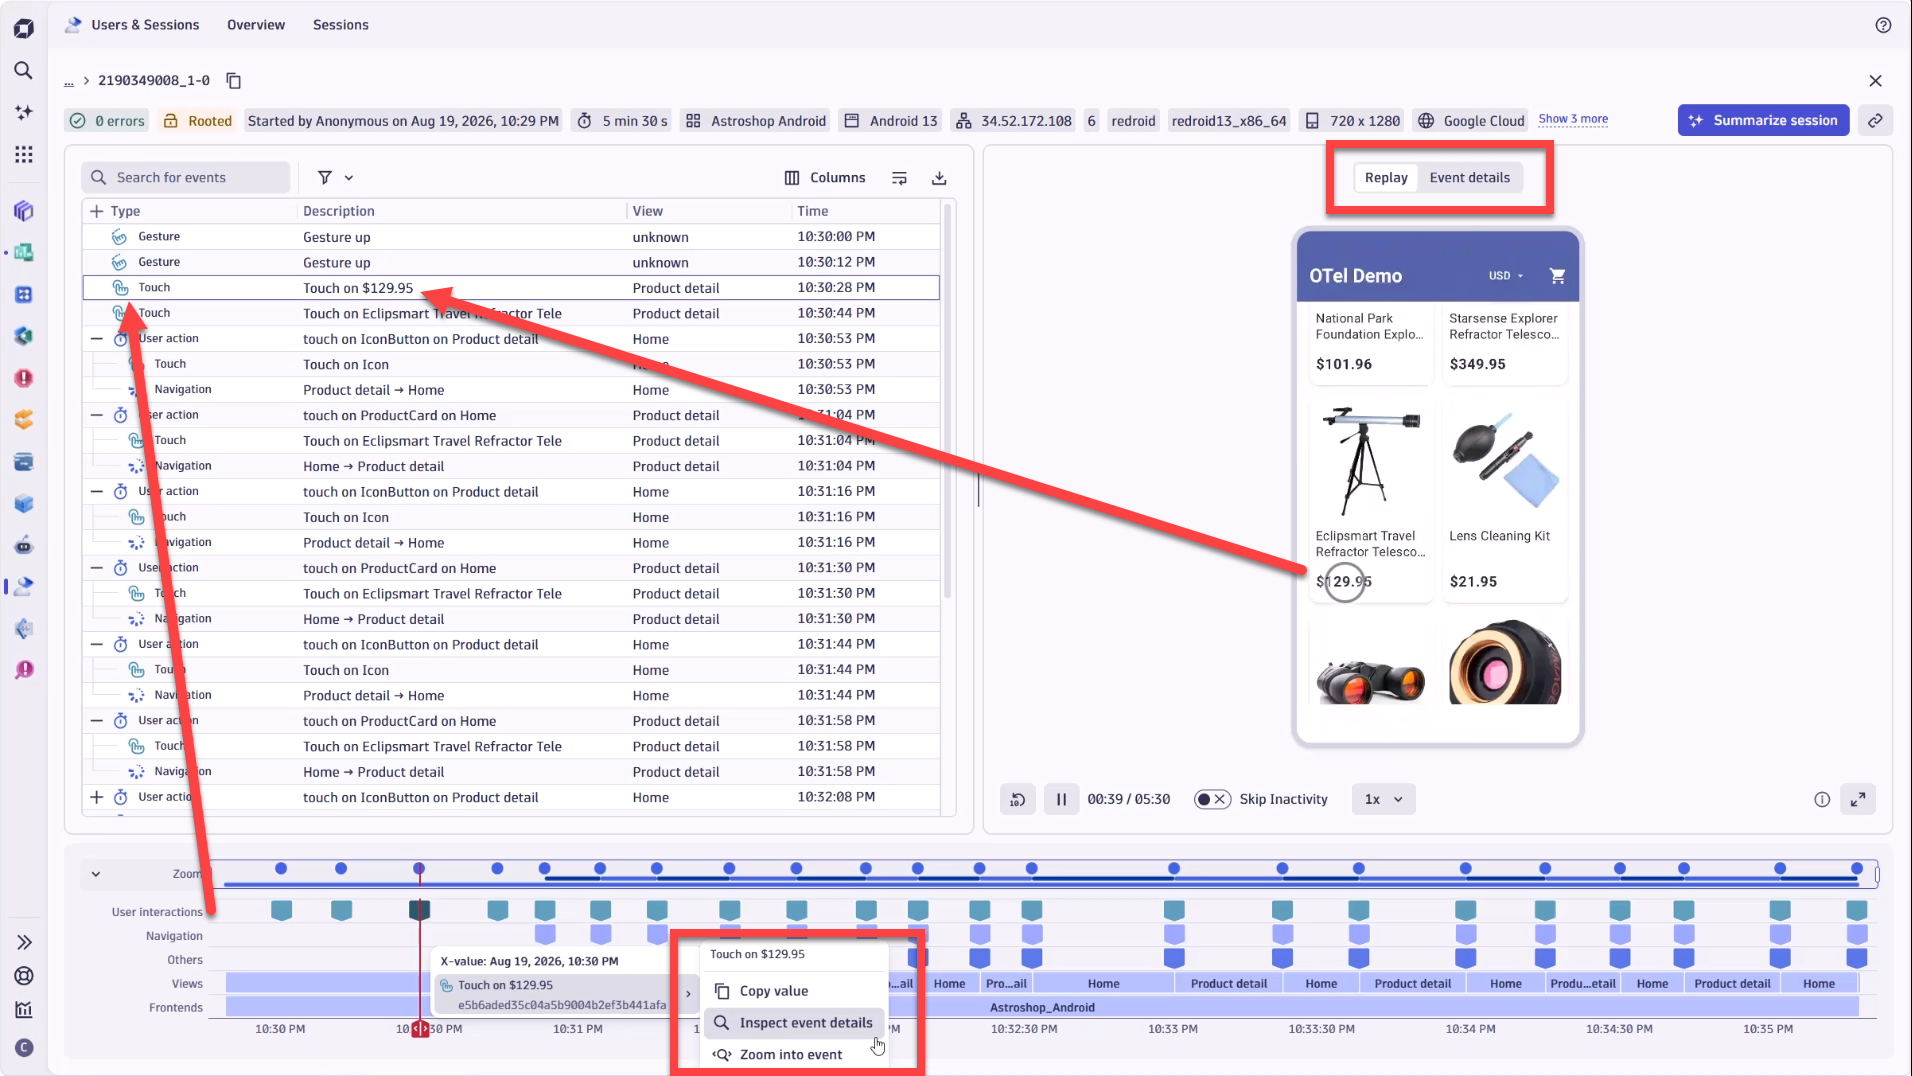
The playhead travels through the timeline, reflecting the current moment of replay. It can be used to navigate to the exact part of interest. Player controls such as replay speed, skipping inactivity, and reverting a few seconds help you watch the replay according to your preferences.
Jump to key moments in the session timeline
Jump straight to what matters without scrubbing through minutes of recording.
All your backend and frontend events and calls are visually represented, offering you the capability to zoom into events and to drill into all event details captured about this particular event.
A visual overlay marking key events helps you to identify crucial moments in the user session to investigate and rewatch.
Easily find sessions that include replay
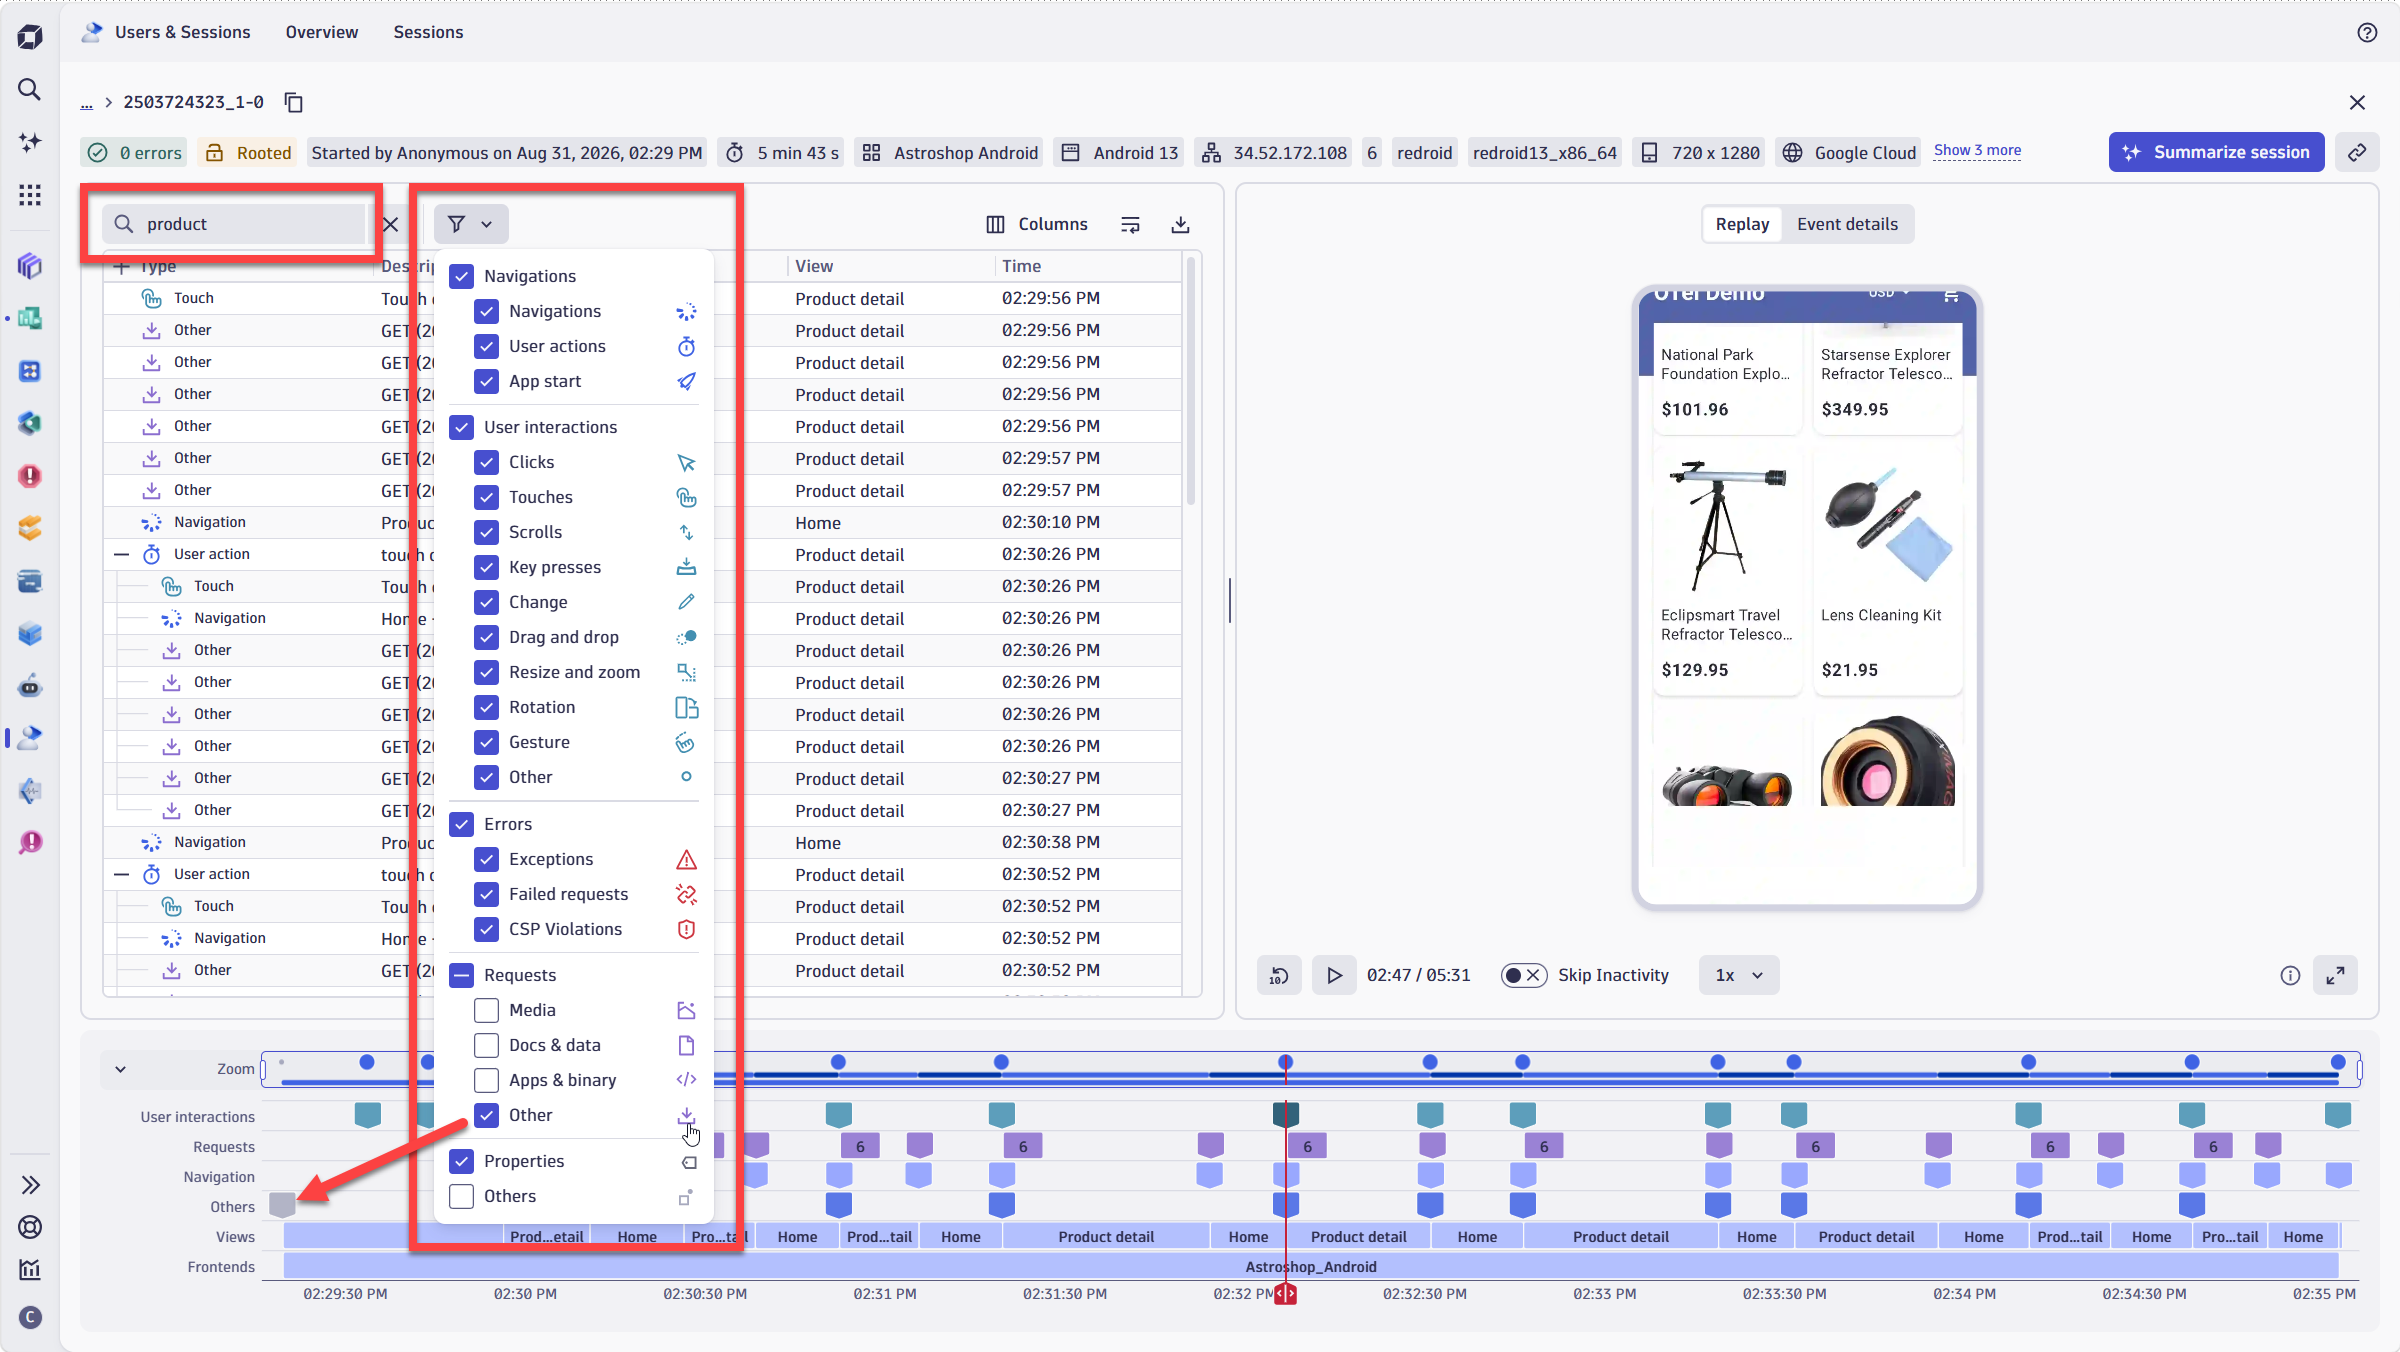
Sessions with a replay are clearly marked in the session list. Use the filter bar and left-side facets to narrow the list and quickly find the recording you need. Each session during replay was captured with annotations on a session list.
Navigate long sessions without losing the moment that matters
Even long sessions are easy to navigate. The search bar and event selector let you cut straight to the moment that matters, keeping investigations focused and fast.
Filter sessions by user, device, location, frontend, and error count
Finding the right session is fast and intuitive. You can filter by user identifier, country, browser, OS, visited frontends, error count, and more, all through a structured facet bar. For advanced queries and specific use cases, DQL lets you go deeper. Sessions also appear directly in Notebooks, so your analysis stays in context.
Move from session events to logs and traces in context
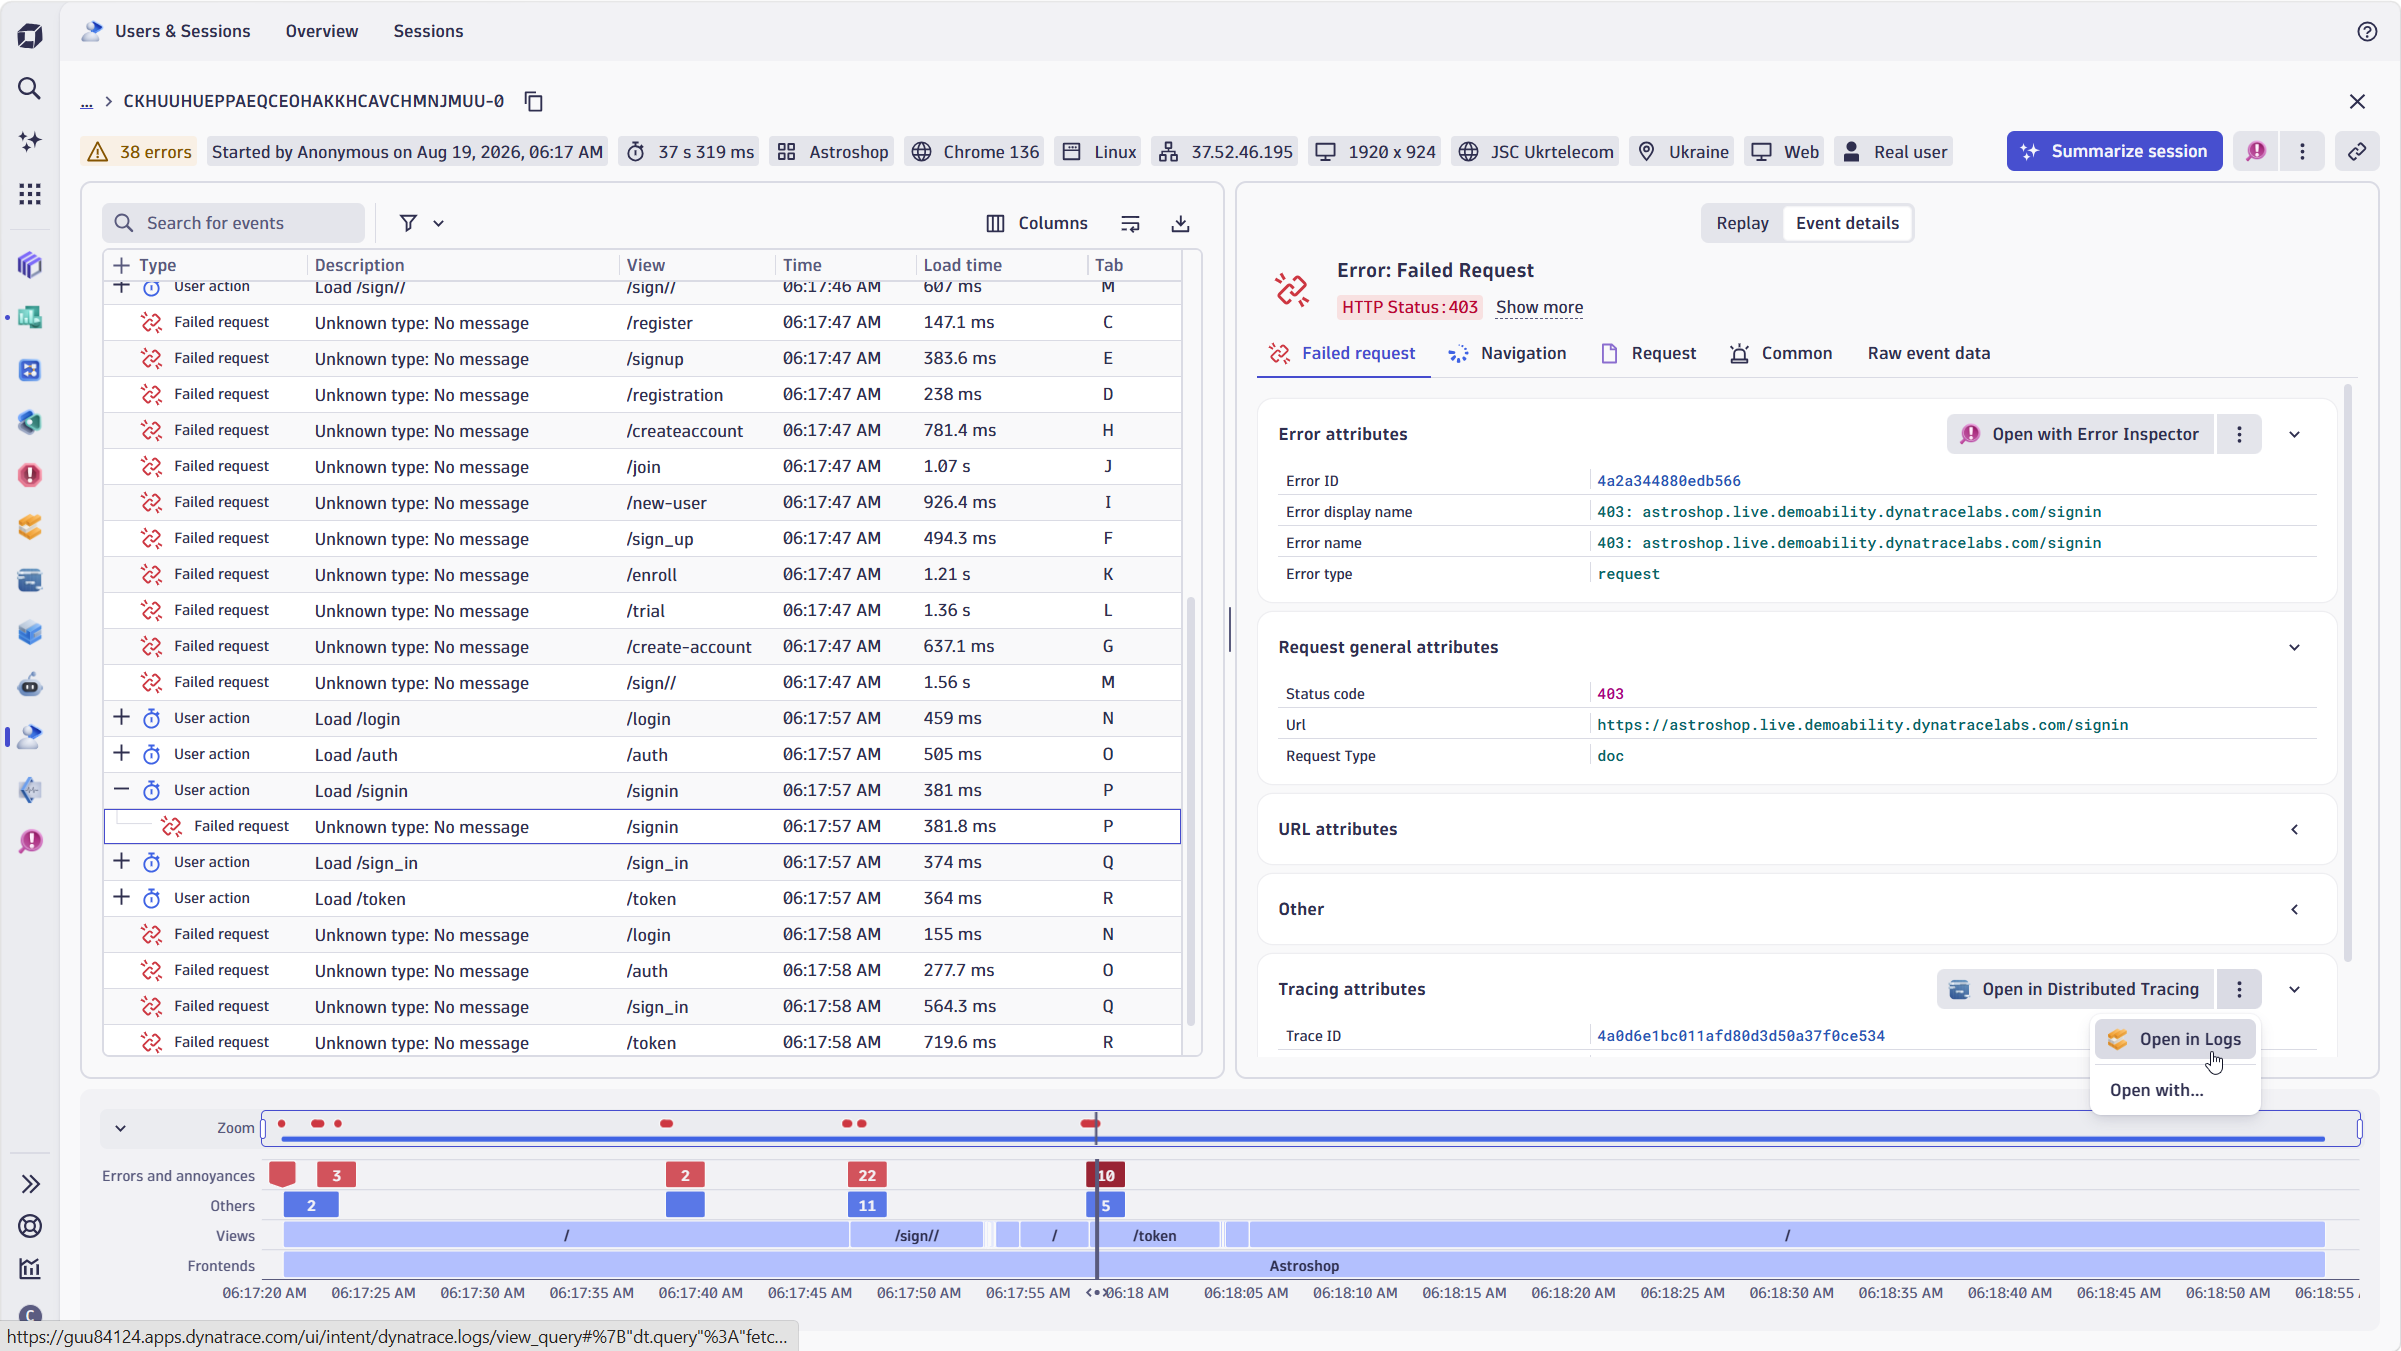
Expand any session event to access the underlying raw telemetry. When you need to go deeper, the data is right there. The intro video shows how quickly you can move from a session event to the related traces and logs, or use the collected data in Notebooks, Investigations, and Dashboards with DQL.
Use Dynatrace Intelligence to summarize sessions and surface likely causes
Every session comes with a built-in AI expert. By selecting the ‘Summarize Session’ button, Dynatrace Intelligence automatically surfaces anomalies and errors. But it goes further than flagging issues. It reads the RUM events behind the session and explains them, giving you a clear, plain-language summary of what the user experienced and what happened beneath the surface. Think of it as pairing the visual evidence of Session Replay with an expert who has already analyzed the events, intent, and user journey for you.
Analyze each user interaction as a standalone event
User Interactions capture each interaction as a standalone event with detailed context, so you have a clean relationship between what a user did in the replay and the actual event that represents those interactions. This capability is currently in Early Access and must be enabled separately.
If you’re currently using Session Replay Classic, then your existing configuration remains active — you won’t pay twice for double-storing. However permissions to data needs to be granted.
Replay every session with the frontend and backend context
This is where Session Replay on Grail becomes something fundamentally different. When a user experience degrades, the cause rarely lives in one place; it could be a user action, a frontend issue, or a backend service failing silently.
With Session Replay natively connected to your full observability stack, you don’t have to guess where to look. Logs, traces, and host metrics are automatically in context alongside every recording, with built-in frontend-to-backend linking. That means faster investigation, a clearer path to root cause, and the ability to resolve issues independently, whether the problem started in the browser or deep in your infrastructure.
With Session Replay on Grail, you can move through the full investigation flow without losing context:
- Session data is automatically correlated, so you don’t have to connect events manually.
- You can move between sessions, logs, traces, and events without copying request IDs or switching tools.
- Because the data is connected in one platform, you can start your investigation from the user session, the backend trace, the logs, or the broader experience data.
- Sessions are connected to logs so that you can go from a log entry to the related user sessions.
- Traces are connected to user sessions so that you can go from a session event to the related distributed trace.
- Digital Experience data of user sessions and events on Grail are queryable with DQL and available in Workflows, Dashboards, Notebooks, and other Dynatrace apps that support DQL.
Everything in Grail is automatically interconnected and contextualized:

You can follow an investigation from frontend behavior to backend cause without leaving Dynatrace. Start with a non-responsive element observed in Session Replay, switch a view to check event details, and go to the related backend trace, span by span. Or start from a backend incident and find the user sessions that were active at the time. Either way, the data is already connected, so you can move from signal to session—or from session to signal—without manually stitching the story together.
That connected view matters beyond engineering teams. For example, customers using Session Replay saw it used by non-technical teams, including business users and customer support.
For teams moving from standalone session recording tools, this is the key differentiator. Dynatrace does more than show what the user did. It connects the replay to the logs, traces, events, and infrastructure data that explain what happened behind the scenes. In other words: Say goodbye to swivel-chair ops.
Analyze historical session data with extended retention and DQL
Dynatrace now offers extended retention for Session Replay data. While currently in preview, this capability is already enabling new use cases. We’re leveling up your capabilities for fraud detection, compliance auditing, and customer complaint resolution that require long-term session history. One customer shared that extended retention is helping them serve use cases they couldn’t previously.
With extended retention, Session Replay becomes useful beyond immediate incident response. Because retained Digital Experience data stays in Grail, you can use DQL to analyze patterns across session history.
In the example below, sessions from real users are returned in which a promo banner graphic was visible to the users. The list of sessions is deduplicated only to show unique sessions:
Dynatrace Query Language example:
fetch user.events, from: now() - 48h
// fetch all user events from past 48 hours

| search "weekend-promo-product.jpg"
// filter sessions where the weekend promo banner image was visible, as part of any custom attribute, tag, or field

| filter dt.rum.user_type == "real_user"
// hide sessions initiated by robots and synthetic tests

| dedup dt.rum.session.id
// deduplicate sessions, resulting in a distinct visitor list
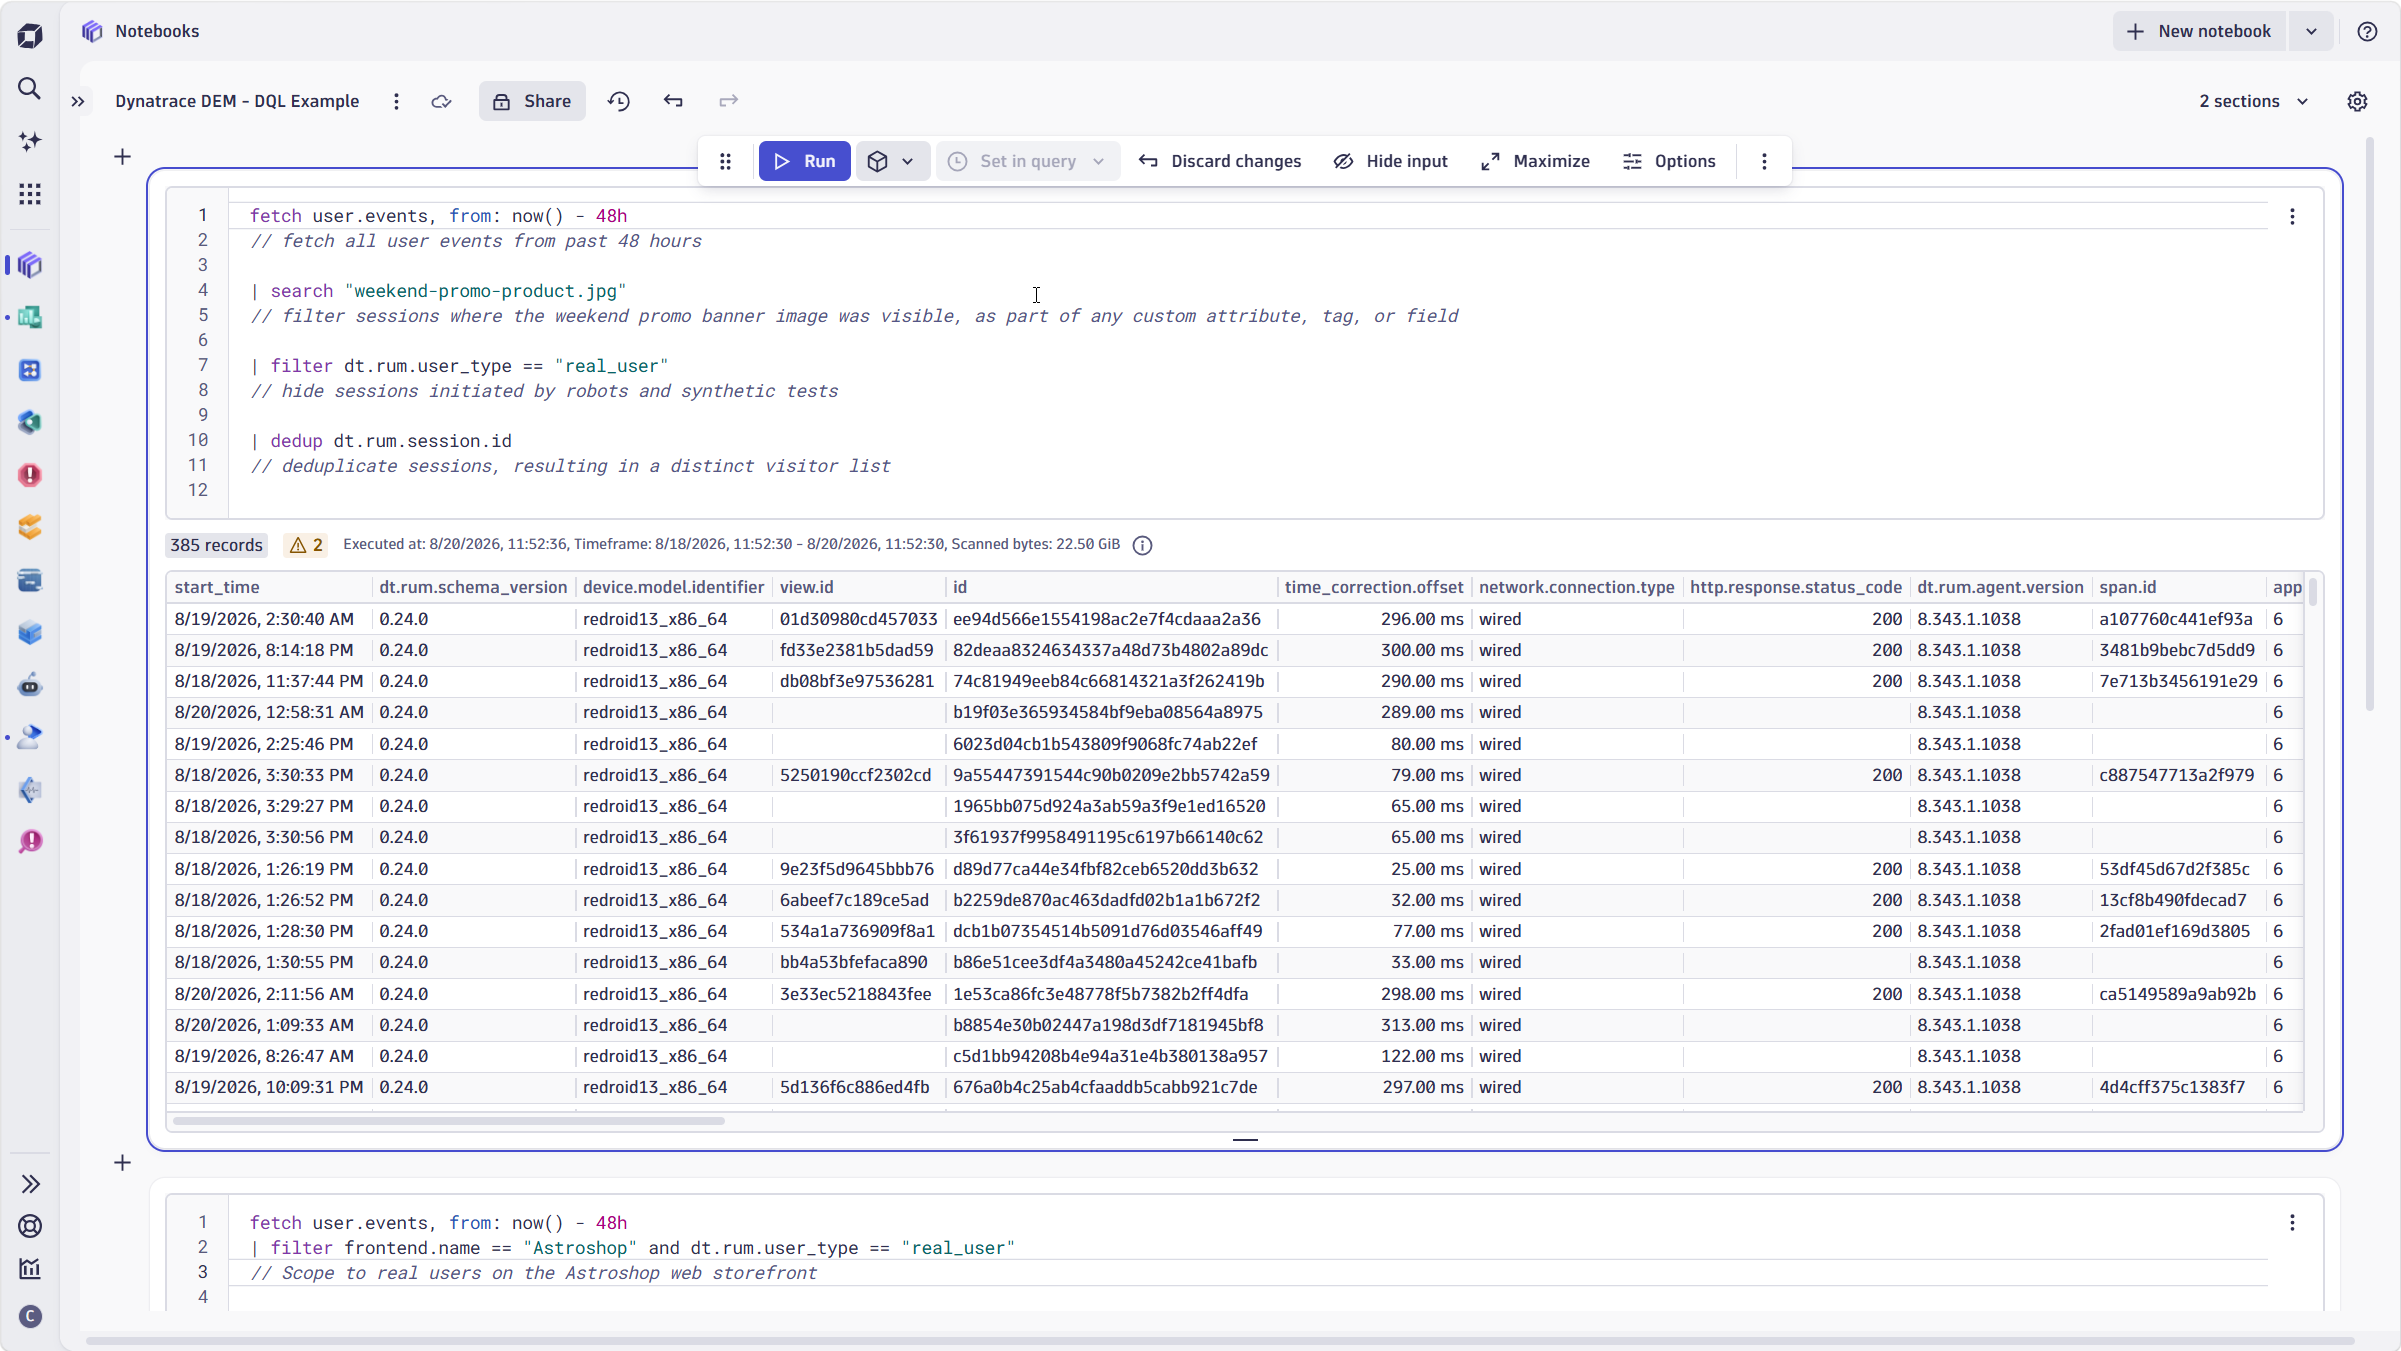
Dynatrace Query Language opens up opportunities specific to your use cases. It lets you fully benefit from the power of Grail and operate on data with full freedom. Learn more in our semantic dictionary documentation and DQL documentation.
Get started with Session Replay today!
Session Replay for Digital Experience Monitoring (DEM) on Grail is now available to all Dynatrace SaaS customers.
Enable via configuration as code
For teams managing multiple frontends at scale, Session Replay can be enabled using Dynatrace configuration-as-code tooling, also helping you maintain consistent recording policies across your entire fleet without per-app manual setup.
Ready for the new experience?
- Explore:
Navigate toUsers & Sessionsapp, apply the replay filter, and investigate your first sessions contextualized with the traces and logs collected. - Migrate:
Run Session Replay Classic and the new experience in parallel during your transition. - Share feedback:
Visit the Dynatrace Community feedback channel to tell us what you’d like to see next.
If you’re not yet a Dynatrace customer or you’re not using Dynatrace SaaS, start your free Dynatrace trial.
Just want to see it live and in action?
Explore the Dynatrace Playground with ready-to-use data for free.



Looking for answers?
Start a new discussion or ask for help in our Q&A forum.
Go to forum